Index
- Index
- In This Post:
- Why Read About Spikes and Channels?
- Where Did We Get to Last Time Video
- Spike and Channel Introduction
- Why Is This Important? Different Trade Management for Difference Parts of the Cycle
- Drill #1: Finding Spike and Channels
- Drill #2: Draw and Re-Draw Channels
- Drill #3: Spike and 2, 3, or 4 legs
- Drill #4: BO of Channel One Side, Then Breakout of the Other Side
- Drill #5: Leg size
- Summary
In This Post:
- We will cover new drills to take your understanding of spike and channels to the next level
Why Read About Spikes and Channels?
- In the first spike video we practiced identifying spikes
- In the second spike video we practiced one way to enter spikes after a pullback
- In this video we connect spikes to the rest of the market structure and introduce new drills
- Trading entries and exits should match the market structure they live in.
Where Did We Get to Last Time Video
- We found spikes
- We marked up 2nd legs
- We looked for failures
- Then we saw how failures lead to measured moves
- We also looks at counter-trend vs trend spikes
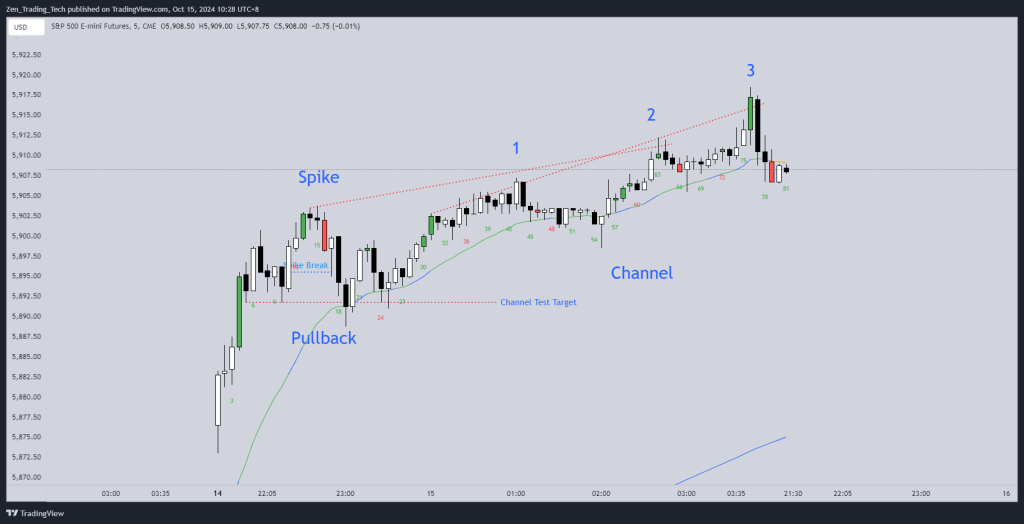
Spike and Channel Introduction
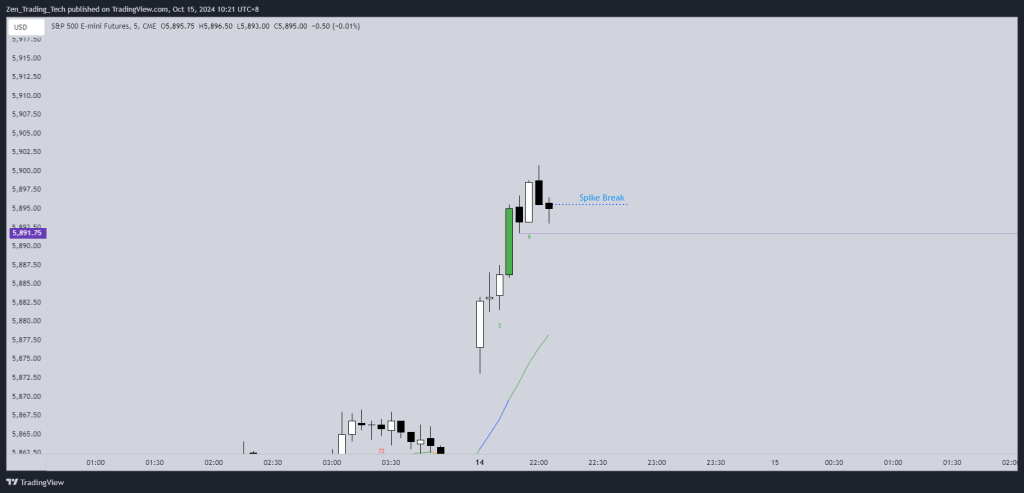
- Below is a breakout on the open
- The spike breaks, but we don’t know where the pullback will finish
- New high, so we can see where the channel test target is.
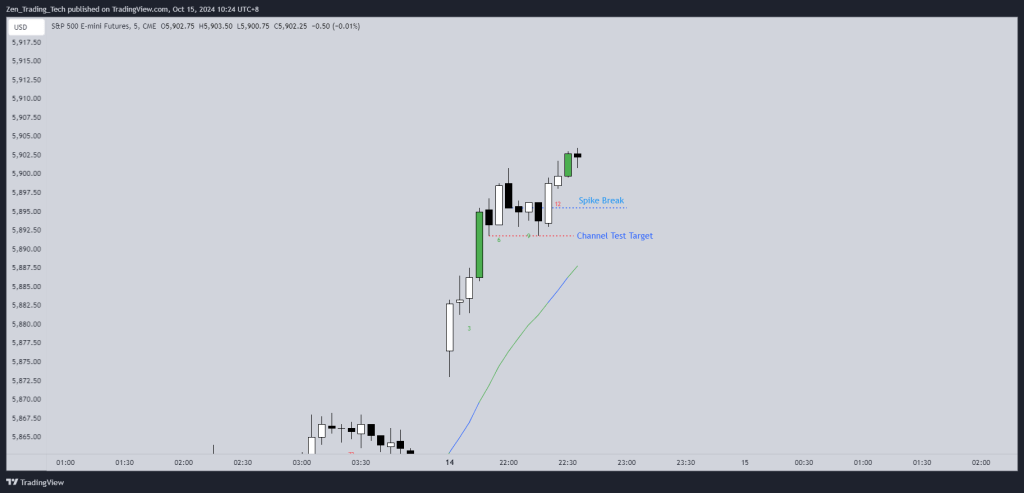
- Test the channel and it holds after 2 tests
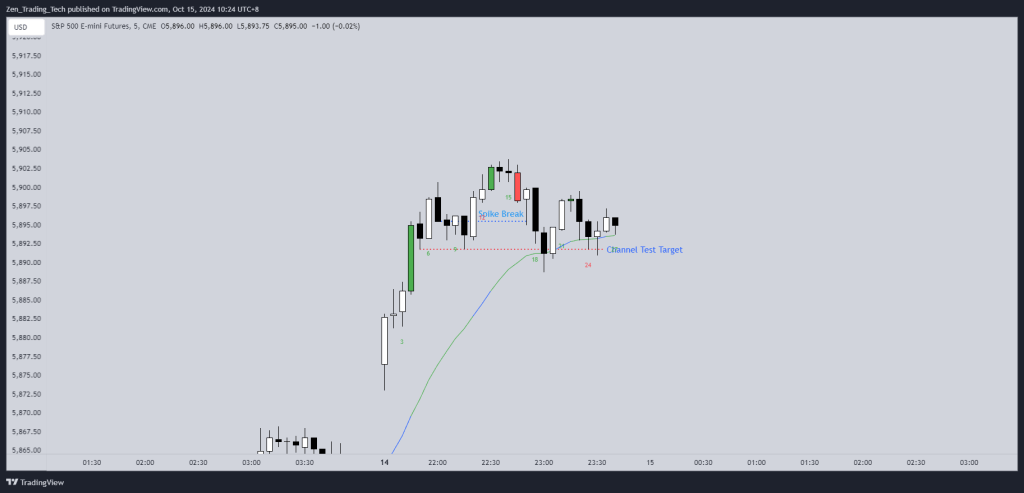
- New high and spike and channel continues
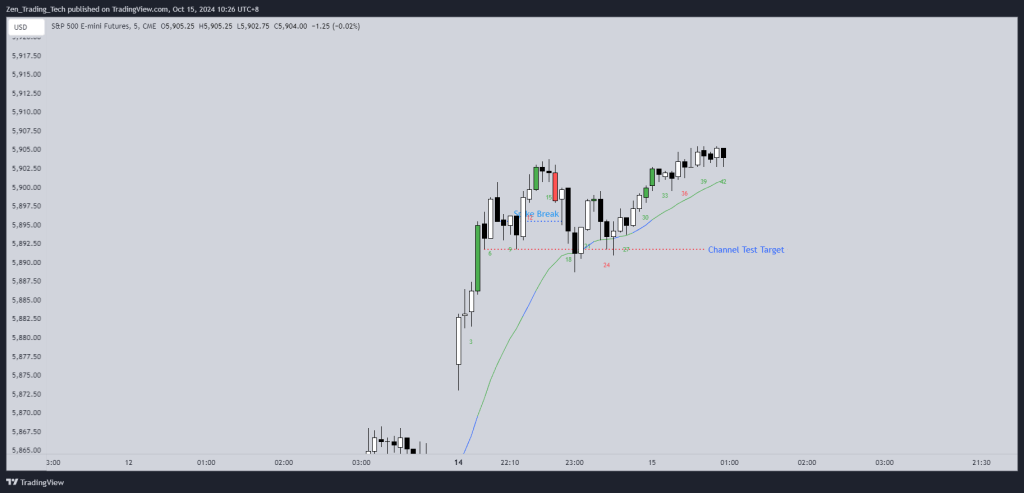
- Structure looks complete now. Spike and 3 legs up. Or 4 legs up.
Why Is This Important? Different Trade Management for Difference Parts of the Cycle

- It will be difficult to get consistent entries when our price action reading is not consistent
- So lets practice!
Drill #1: Finding Spike and Channels
Step 1: Mark Up Spikes
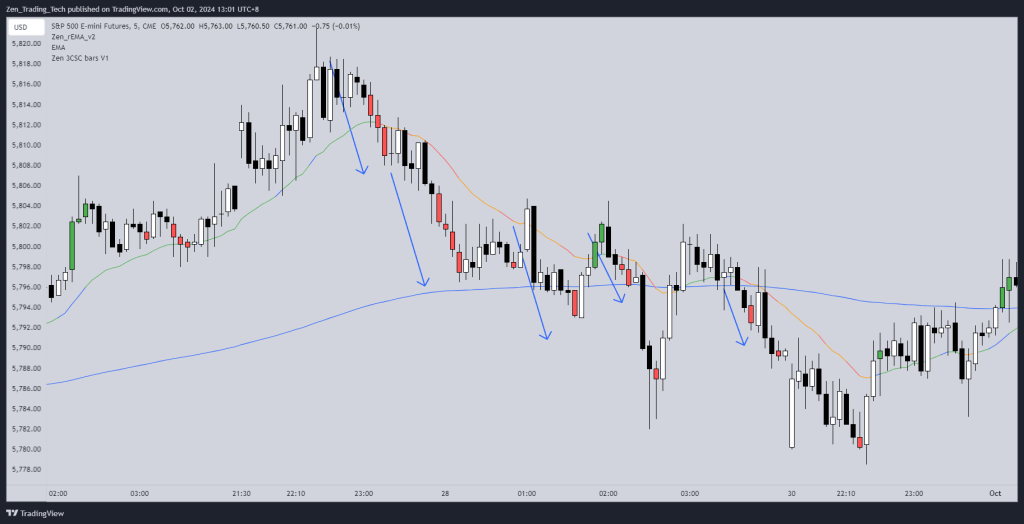
- Use indicator if unsure
Step 2: Mark Up Spike Breaks
- Where does the pullback start? Where the spike breaks
- An up-spike gets broken when we go below a prior bar. The reverse for bears.
- Note that a spike can break with an opposite or pause bar. See my video on leg counting.
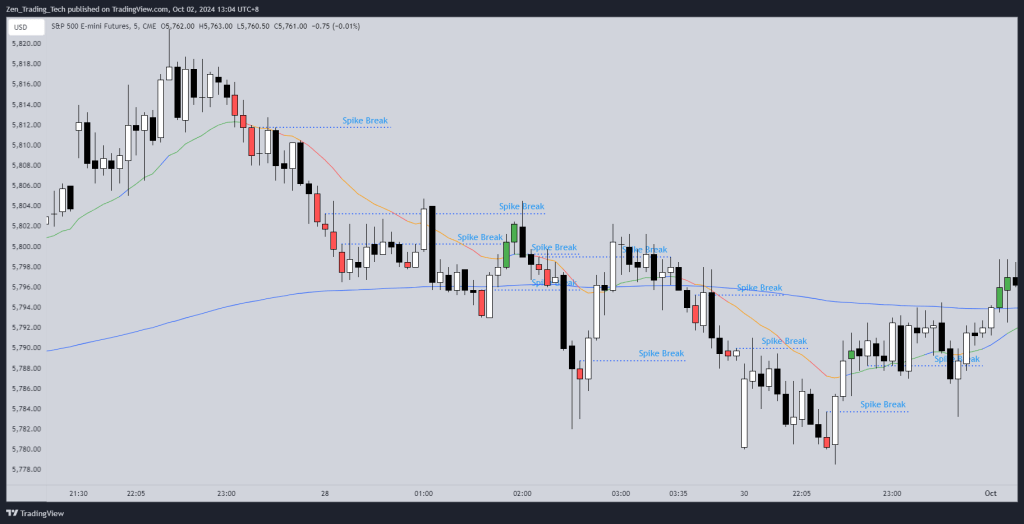
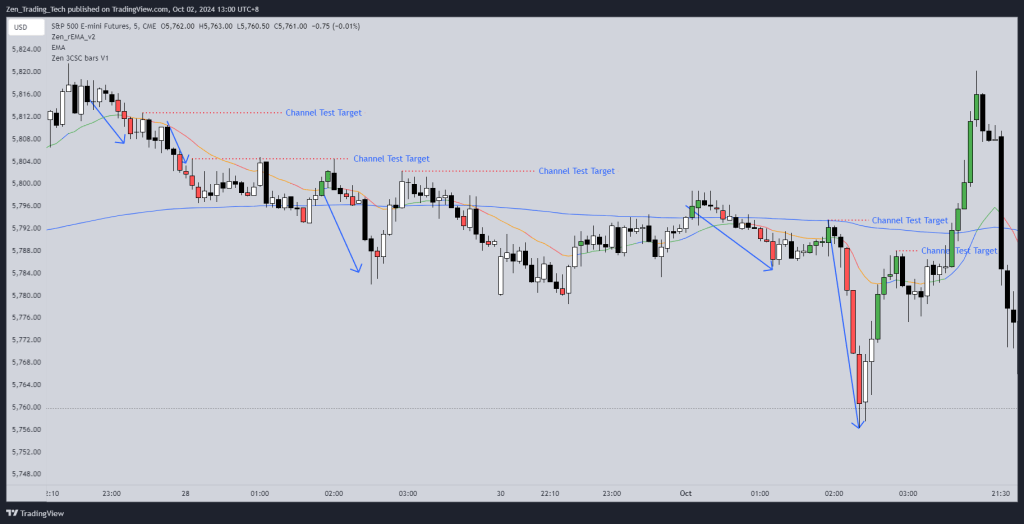
Step 3: Furthest edge of the pullback is a test target
- Now you know where the spike is because you also now know where the break is
- When price continues in the spike direction we can see the furthest point of the pullback
- Draw a Line at the furthest edge of the pullback
- This is the start of a channel
- This is a test target for later alligators
- The market loves to test them
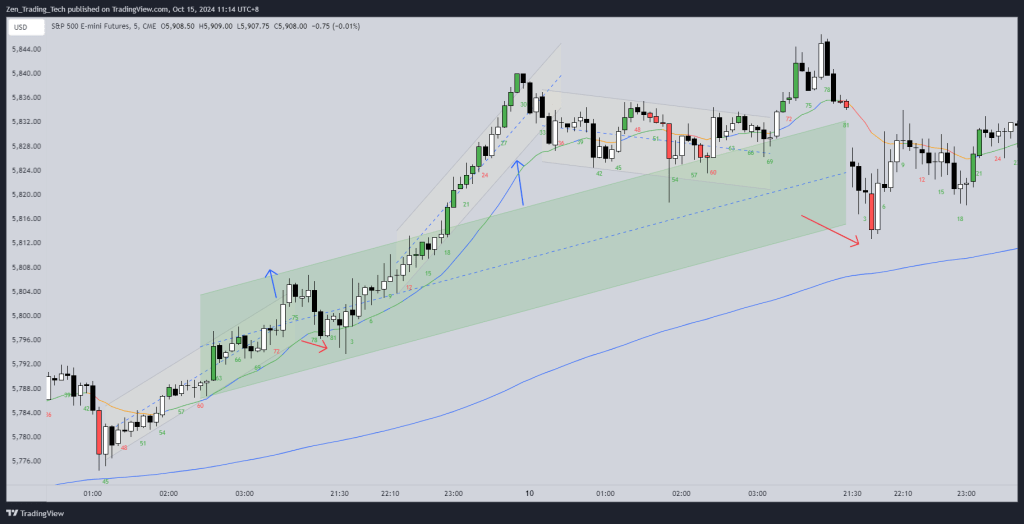
Drill #2: Draw and Re-Draw Channels
- Follow the drill from before and connect channel line (Use channel tool if your software has one)
- If the spike becomes faster, it will over-shoot the channel line
- If there is a 2-legged pullback it broadens the channel
- Over time it will change so practice redrawing the channel to see how they behave.
- Below I have not drawn ALL of them – just what I considered to be the major ones.
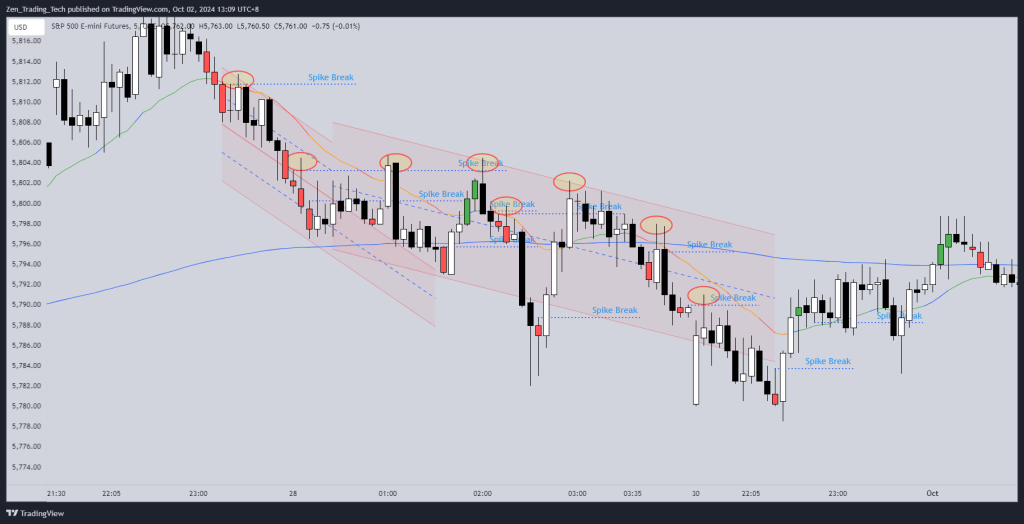
- As the day goes on the channels change – but they stil act like a channel
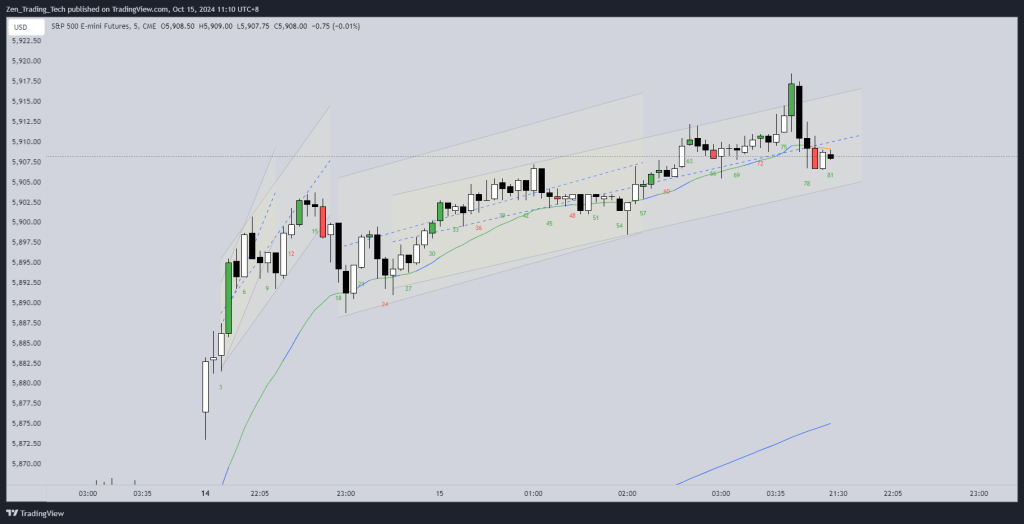
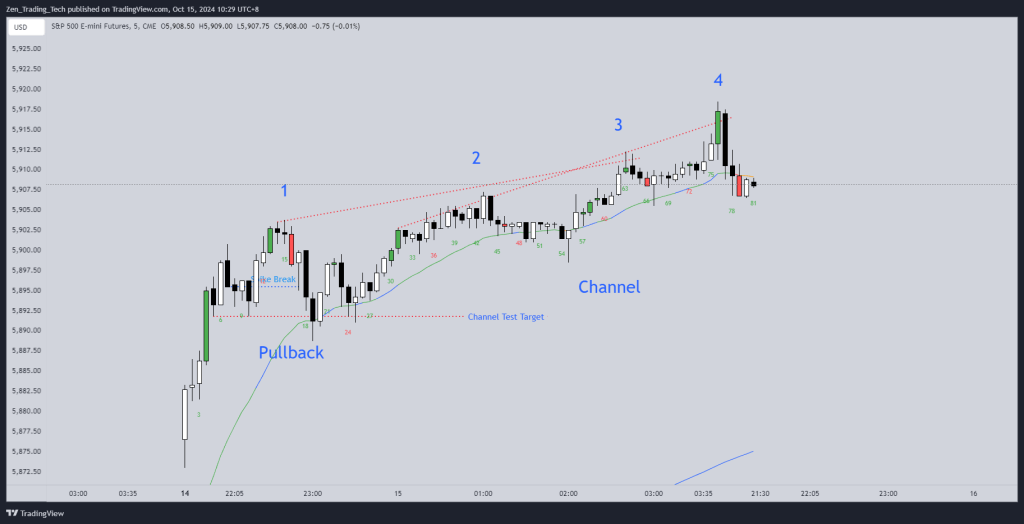
Drill #3: Spike and 2, 3, or 4 legs
- Put a box (green or red) around the spike
- Start counting the pushes relative to the size of that spike
- Most important part is to focus on the spike and legs after it to avoid countertrend trading
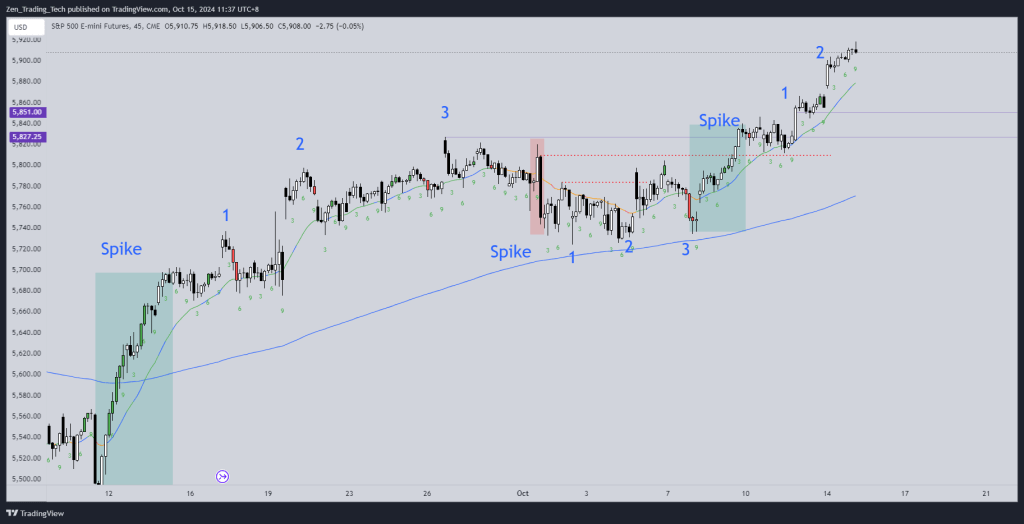
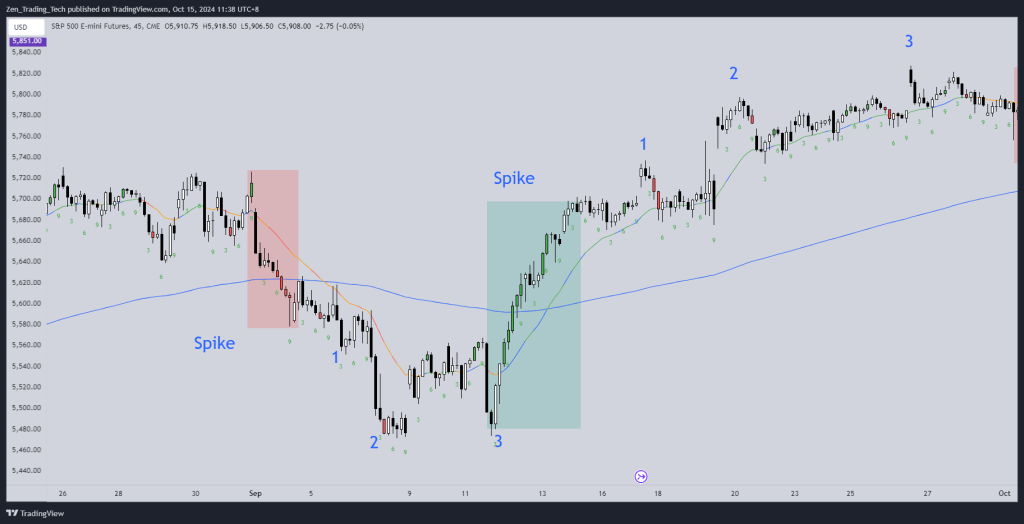
- Many ways to count
- Works on all timeframes
- Market can create infinite variations of the same pattern.
- Function is to match your trade order type and management to the structure
- Different phases will be relative to the spike
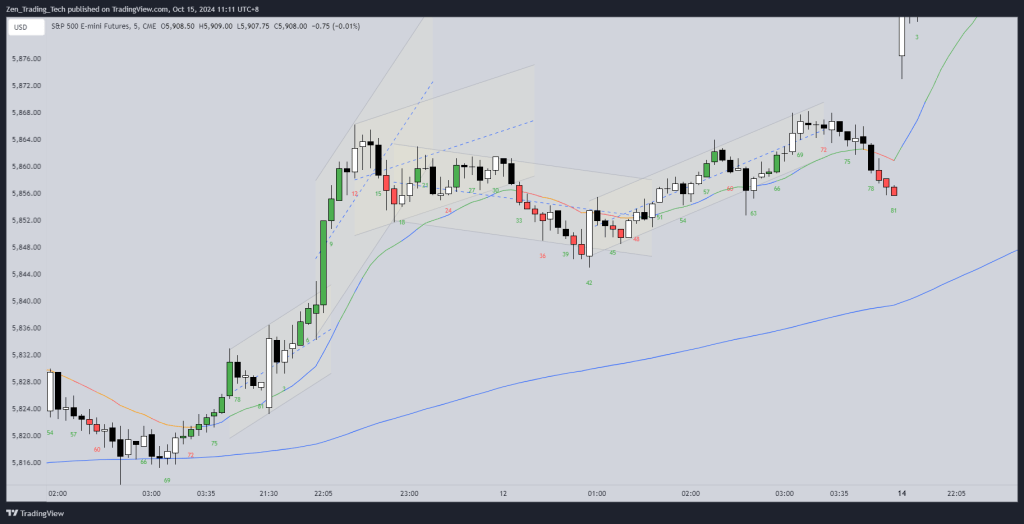
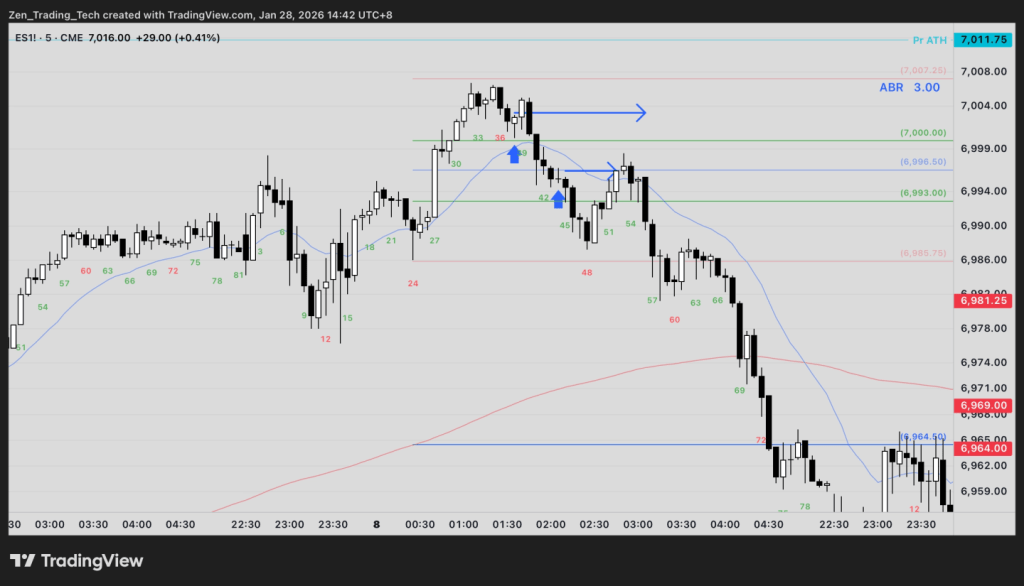
Drill #4: BO of Channel One Side, Then Breakout of the Other Side
- In this drill we will draw channels and look for the breakout of either side
- Here a small version and a larger version
- This drill can prevent you from entering late and help to position yourself for the swing back into the channel
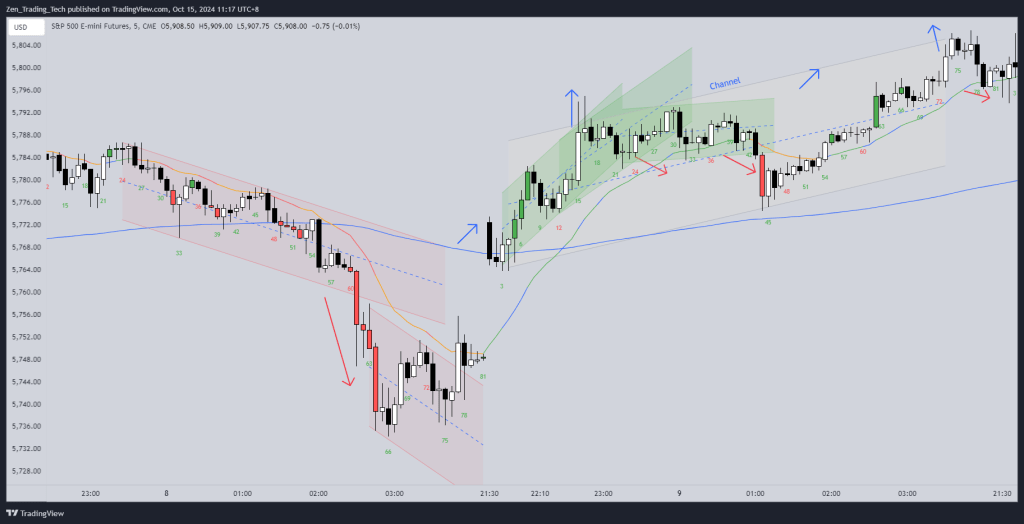
- You can also combine this drill with trendline break test – Video below
Drill #5: Leg size
- Once you can find spikes and channels look at the leg sizes
- Practice finding which 2 legs are the most similar
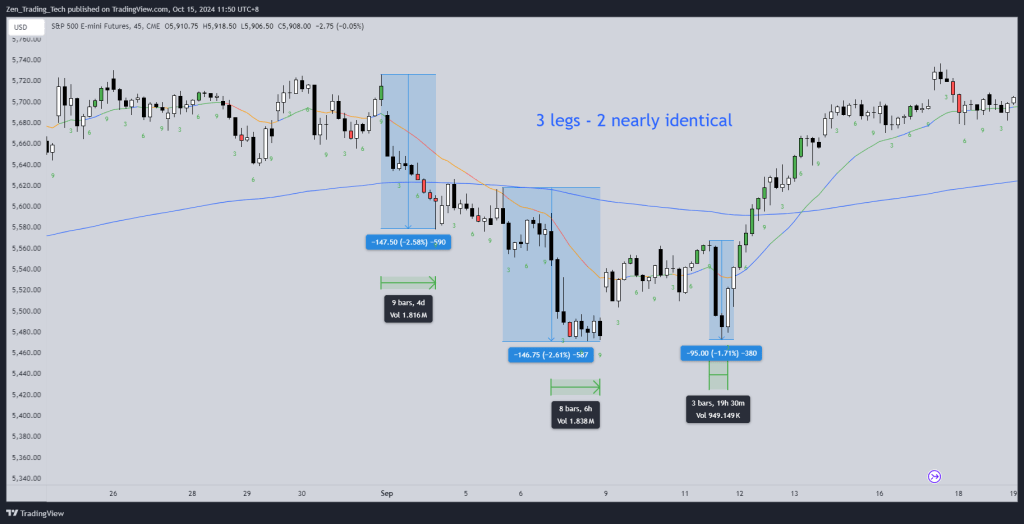
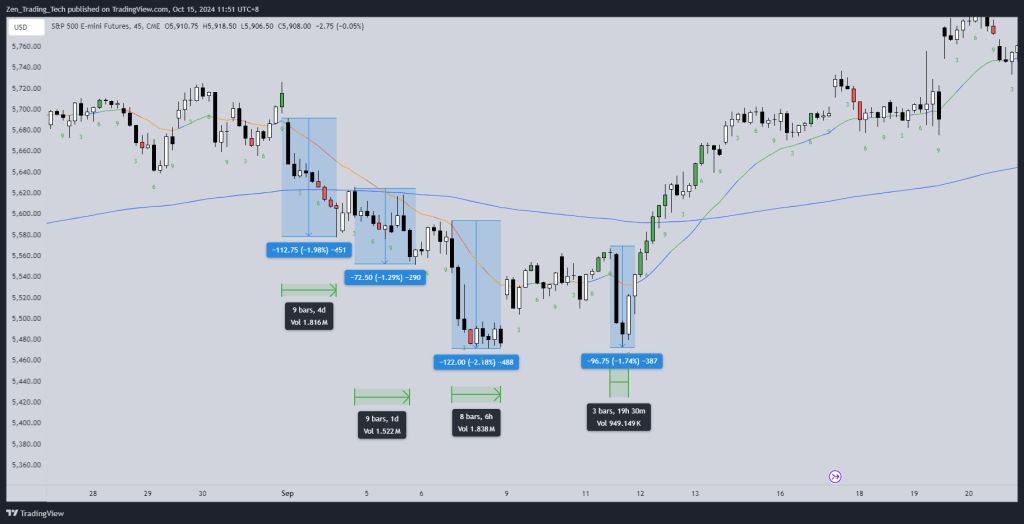
- This will help counting in a live environment because the legs should be relative to each other.
Summary
- In this post we covered 5 drills for spike and channels
- I highly recommend practising each one for a set of charts – 20 days or set a timer and practice it for 25 minutes.
- Staying focused on one aspect of price action will help develop live trading skill


Leave a comment