Intro
- In this drill you use the higher time frame to understand how your favourite setups work.
- For example – mine is a High 2.
- Zoom into your favourite setups to develop new understandings.
- I spend a lot of time researching how they play out, so I can manage them well.
Daily High 2 on DAX 40 – Success
https://www.tradingview.com/x/euTlpBC0/
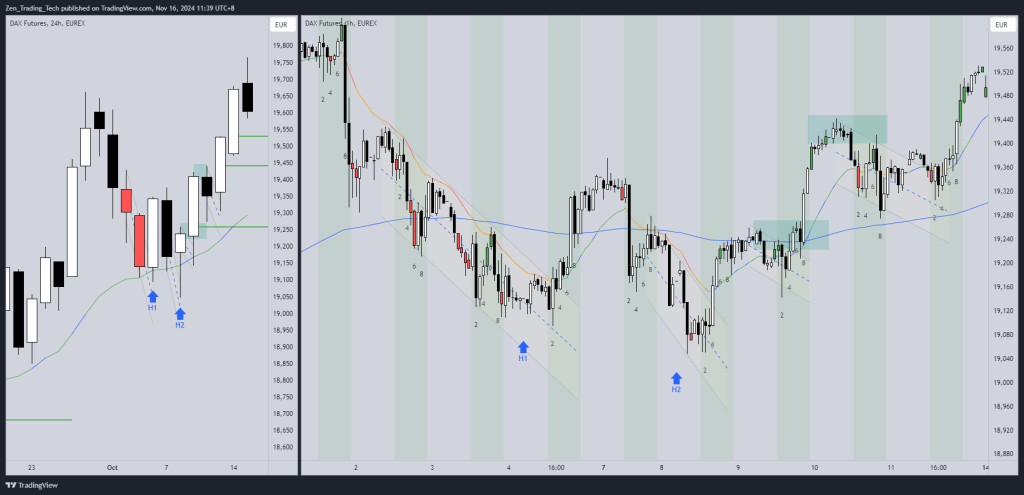
I write notes:
- Daily H2
- Good entry bar
- Good follow-through bar
- 60m Chart
- BR CH
- BLBO Fails
- TR
- LL MTF
- HL Inverse H&S
Daily High 2 on DAX 40 – Fail
- Compare the above with this one
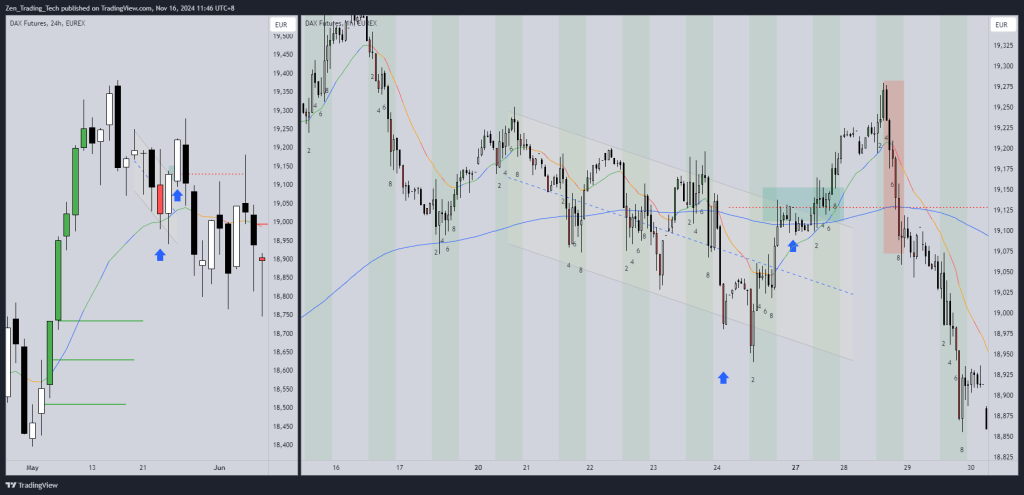
- Daily H2
- Good entry bar
- Bad follow-through – which closes below my entry
- And I can’t get out at my entry
- Earlier disappointment should have been a sign
- 60m
- Bear Channel, failed bear breakout, then failed bull breakout
- Once strong bear spike appears – probably close entry
- You can see in the first image that pullbacks were more of a channel – here the pullback is surely a SPIKE – needs more down.
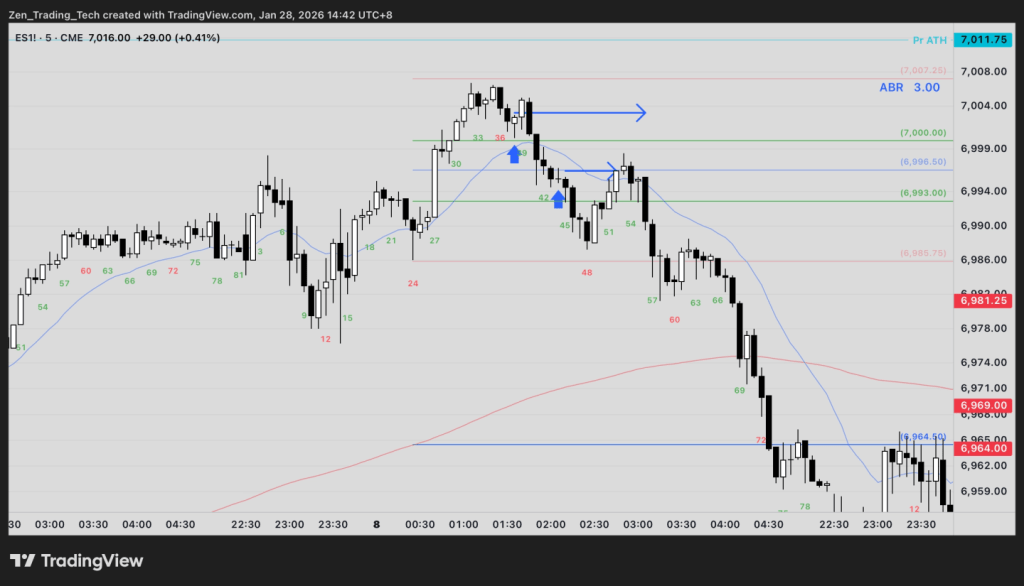
Breakeven on the daily chart
- Buying the H2
- Buying below the H2
- Could exit breakeven

Conclusion
- Suggest you take your favourite setups and begin to analyse them on a higher timeframe to develop the feeling of what the good ones look like AS THEY ARE FORMING.
- Using 2 or 3 is best.
- I like Daily -> 60m -> 15m
- Also 60m -> 15m -> 5m
Happy trading!
Tim


Leave a comment