
Introduction
I often get asked how I research different setups.
I’ve never actually written out my process before—this is my first go.
What I’ve shared below is just one way I approach it. It’s not the only way, but it’s helped me turn ideas into something more concrete.
I’m not touching on trading systems here—that’s a separate topic.
As a discretionary trader, I’ve found this kind of research useful. It helps me build confidence in execution, and sometimes it just helps me think more clearly.
I also enjoy it. Even when the ideas don’t go anywhere, they sharpen my eye.
And over time, I’ve found that knowing what to say no to is just as valuable as knowing what to trade.
Researching Setups
Types of Setups
a. Price Action Setup
What kind of setup are you looking to research and how will you define it?
Consider recording yourself as you talk through it.
I define a price action setup below:
- Examples:
- A bar
- ie Outside bar,
- A leg – Multiple bars with a relationship to each other
- ie Microchannel, 2-bar reversal
- Structures – Multiple legs with a relationship to prior legs
- ie Major Trend Reversal
- A bar
b. Day Trading Setup – Time-Based Setups
Perhaps the setup you are looking for occurs at a particular time of day like the open?
For my research I always consider WHERE a setup lives. It helps me remember it and trade it in the right place.
Also, when the setup has finished for the day I can ignore it and look for something else.
- Setup Locations
- At the open of RTH or relative to it
- Opening range breakout (needs definition)
- Opening reversal (needs definition)
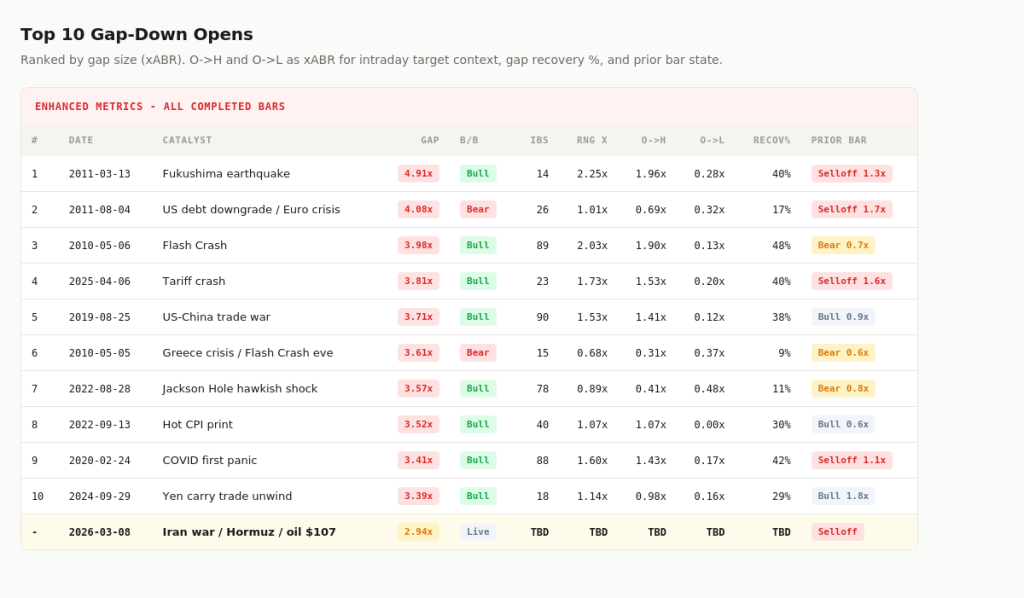
- Big gap (quantify ‘big’)
- Trading back to the gap
- Liquidity-based open (e.g. Euro Open, US Open)
c. Other Setup
- Non-price action based
- Big round number
- Options expiry
- News events
- Correlation-based (inter-market or instrument relationships)
- Other – anything else you can think of!
Research Process – Basic
Now we have a basic idea.
Ensure it is in fact, basic! Complexity can come later on.
Begin to explore this idea of yours.
Before any research I will start screenshotting charts and writing notes – I have done a previous post about it here:
- Define the setup to research
- Voice or video record to get directional feel (helps when returning later)
- Define the signal bar
- Add a clear trigger for order entry
- Define stop and target (basic order management)
- Collect many examples where the order was filled and trade completed
- Document examples
- Find the balance between too much and too little detail
- Screenshot and archive in a document as before
Example Research – Three Consecutive Bars (Base Case)
- Pattern:
- 3 consecutive bars
- Entry Criteria:
- Bull setup:
- Buy 1 tick above third bar
- Stop: 1 tick below first bar
- Target: 1R
- Bear setup is mirrored
- Bull setup:
Research Process – Detailed
Now we can formalise it deeper if it is still worth pursuing.
Start again above but record it in a spreadsheet.
- Some items that might be useful to you could be:
- Day of week
- Time
- Bar number
- Signal bar type – qualify it
- Entry bar
- Win/loss
- Time in trade
- Relevant market context
- Initial Risk
- Actual Risk
- Above / Below MA
- As before, finding a balance between too much / too little is key – if it takes you 10 minutes to do one chart, it will be hard to get momentum to complete it.
Iteration – Testing Filters
- Once base hit rate is known (e.g. 60%) we can start to test variables
- Apply one filter at a time across the same examples
- If I have documented it with screenshots / links next to my data I can VERY EASILY do this.
- Re-tabulate and observe how performance changes.
- For example: Even when I’m reviewing my trades I keep a link like below

Ideas for filters to Test:
- Continuation vs Reversal
- Is it in the direction of the prior move, or is it a reversal attempt?
- Always-In
- Is it agreeing with the current Always-in direction or not?
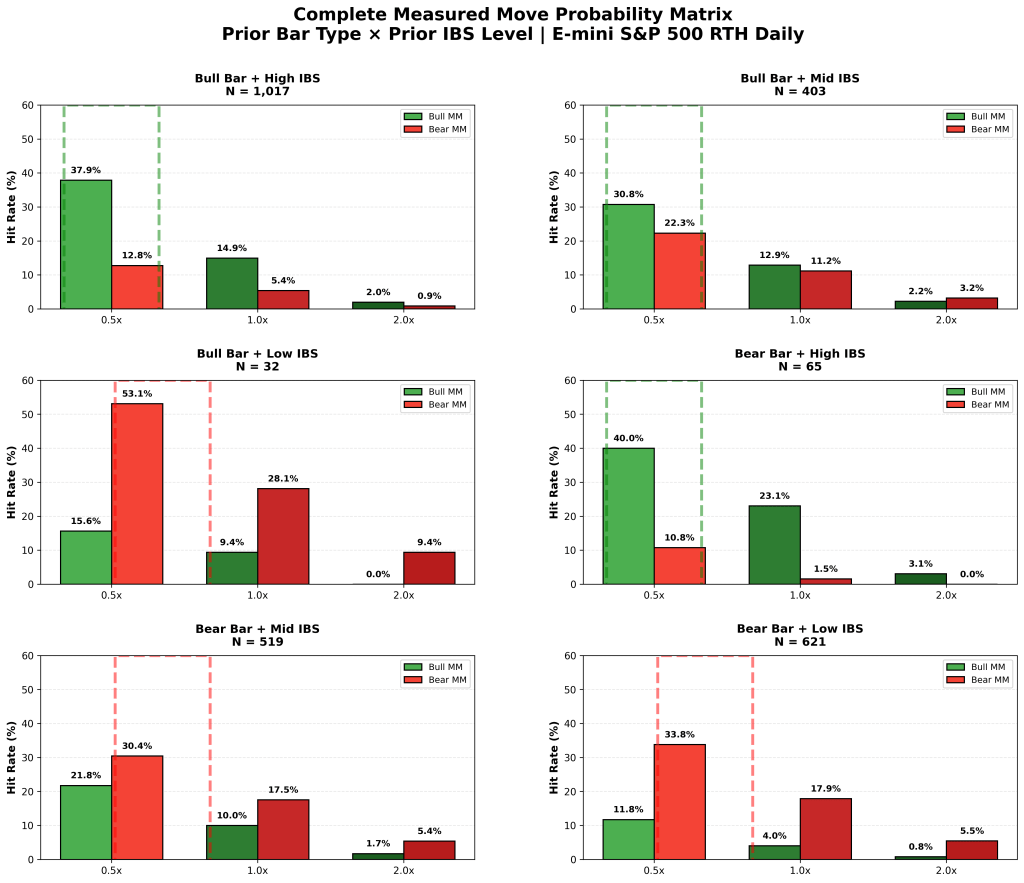
- IBS (Internal Bar Strength)
- Are the bars strong or doji-like?
- Day Structure
- Trend from open, trading range, small pullback trend, etc.
- Trending
- Does it change if the signal is trend vs counter trend?
- How do you determine strength of the move when a strong counter-trend setup appears?
- Volatility Context
- Does the VIX being in a high/medium/low range affect on setup?
- Time of Day
- First x bars vs rest of the day
- Leg Count
- Where in the leg count is the setup appearing?
- Moving Average Filter
- Above/below MA, crossing MA
- Repeated Signals
- First vs. second signal
- Does prior outcome matter?
- Target Variation
- Test exits at 0.5R, 1R, 2R
- Higher Time Frame
- Does the setup align/conflict with HTF structure?
- Opening Gap
- Size/direction of gap vs. setup
Each filter is tested in isolation.
Outcomes
- One of the best parts of doing research like this is you get familiar with the various outcomes the setup has.
- This is very valuable information and will help me manage my trade more effectively.
- There should be at least 3 outcomes and probably 5 you can consider:
- Strong move in your direction
- Expected move in your direction
- Strong move against your direction
- This can help you manage the trade.
- Some traders might add more examples – giving themselves options for adding or or scaling in.
Summary
The simpler your definition, the more likely you are to complete the work!
Over time I have done mini-research projects on many areas and I believe that has positively impacted my ability to trade.
I hope you will find benefit from doing it also.
Tim


Leave a comment