Built for traders using the Al Brooks Method
- Updated Aug 2025: v5 Available
This free TradingView indicator helps you study how the first 18 bars of the regular trading hours (RTH) session affect the rest of the day. It’s designed to support the kind of market reading taught in the Brooks Trading Course.
When you’re serious about learning to trade the open, you’ll start to see how much is encoded in those first few bars. The structure, volatility, conviction. The market often gives you clues early—if you’re paying attention.
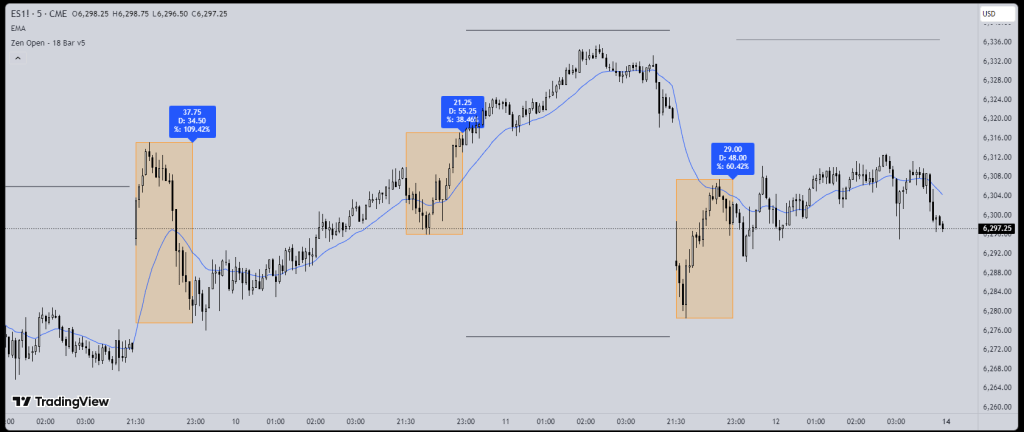
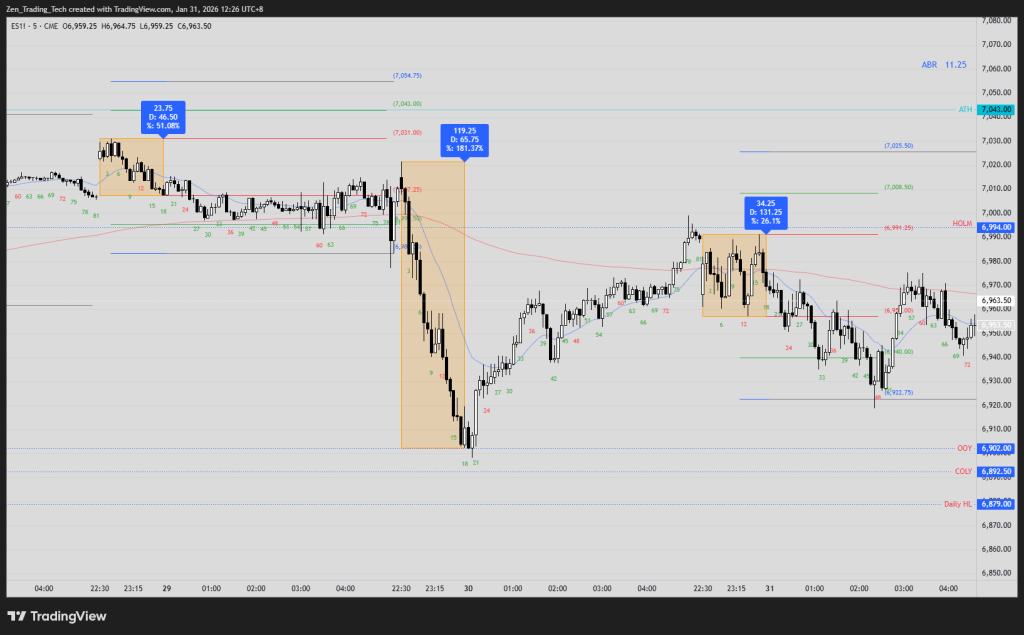
This indicator highlights the first 18 bars with a visual box and shows the range as a label. That’s it. But that simple visual aid can change how you study the open.
Update: Added daily range stats and comparison to the 18-bar open range. The label now shows:
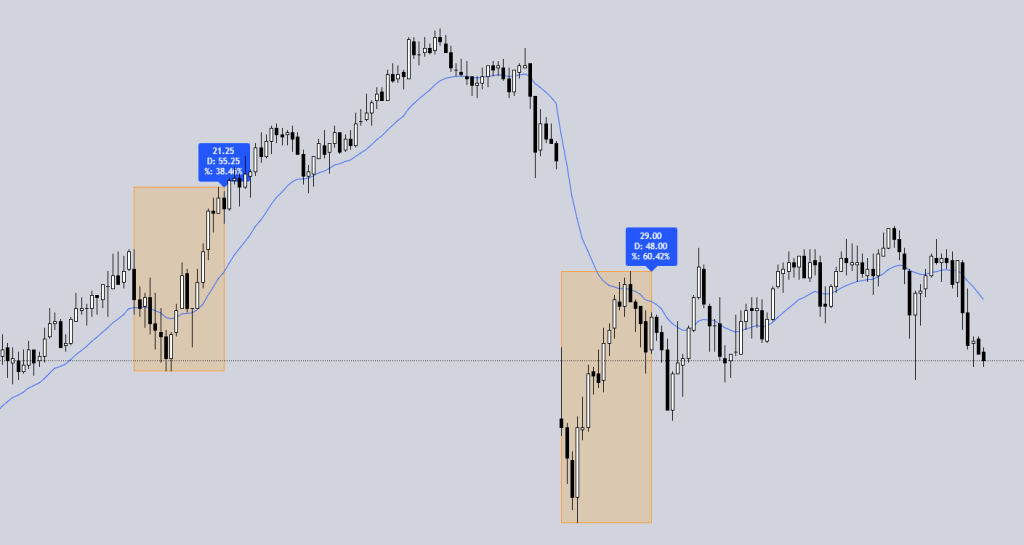
- the 18-bar range in points,
- the current day’s full range,
- the percentage of the 18-bar range relative to the average daily range (8-day lookback).
Also added an input to adjust label text size.
Update:
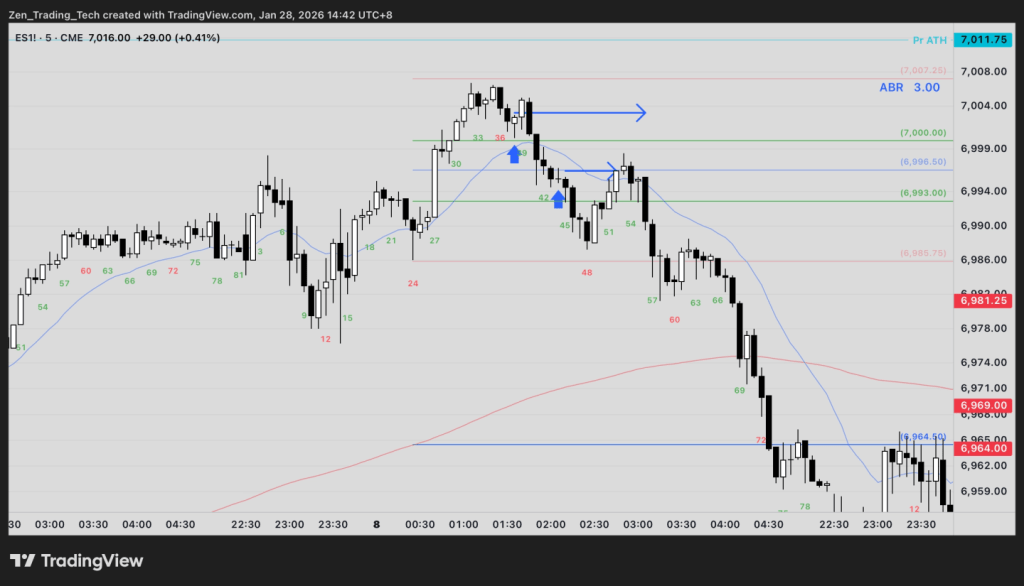
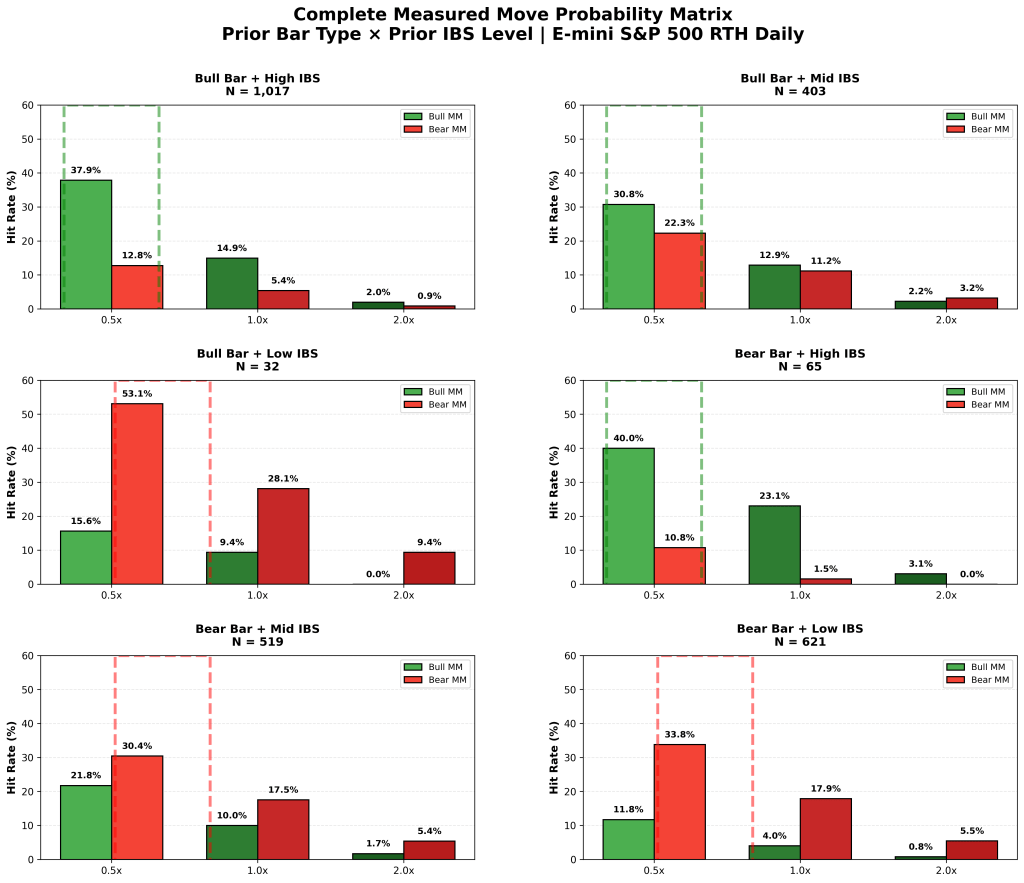
Added projection zones based on the 18-bar opening range. These appear as thin gray bands above and below the range, extending 62 bars into the session. Useful for spotting measured-move targets. Also added toggles for visibility. No impact on existing box or label functionality.
⛓ Why 18 Bars?

Link here -> https://www.tradingview.com/script/yPwe636O-Zen-Open-18-Bar-v5/
Al teaches that the open shapes the rest of the day. The first few bars show whether institutions are actively trading, whether there’s a breakout setup developing, or if it’s likely to be a trading range day.
18 bars is a practical cutoff. It’s short enough to capture the early session, but long enough to contain a potential breakout or failed breakout.
🧠 How to Use It
Some ideas:
- If the 18-bar range is small, expect expansion. Often, you’ll see an opening range breakout measured move.
- If it’s large, the market might have already done its move. Look for parabolic wedge tops or bottoms, and sideways movement.
- Observe how the range, location, and breakout attempts relate to the day’s final high/low.
This is for research, then practice implementing into your trading.
Go back, replay charts, study how the first 18 bars led to the rest of the day. Spot patterns. Develop your own expectations.
⚙️ Settings
- ✅ Toggle the box on/off
- 🎨 Set the box color and transparency
- 🏷 Optionally display the range label
Stay sharp,
Tim F
Zen Trading Tech


Leave a comment