Most traders know what an inside bar is. Most traders know what an outside bar is. But very few traders actually study how often these patterns show up—and what that might mean for their intraday strategy.
I wanted real numbers. So I wrote a simple tool to count them. Here’s what I found.

🔍 What This Study Does
I ran the script on the daily chart of the ES (S&P 500 E-mini Futures), going back 1000 bars—roughly four years. The tool classifies each daily candle as one of:
- Inside bar – high is less than or equal to yesterday’s high, and low is greater than or equal to yesterday’s low
- Outside bar – high is greater than or equal to yesterday’s high, and low is less than or equal to yesterday’s low
- Regular bar – neither inside nor outside
It then shows the total counts, percentages, and plots the results cleanly on the chart.
📈 What the Numbers Say
Here’s what I found from the ES 1000-bar sample:
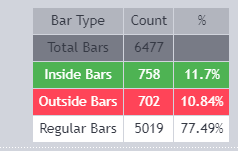
- ✅ Inside Bars: ~11%
- ✅ Outside Bars: ~11%
- ✅ Regular Bars: ~78%
That means in nearly 90% of all sessions, the market breaks outside of the previous day’s high or low.
🧠 Why This Matters for Day Traders
If we open inside yesterday’s range, statistically we’re likely to break out of it.
Not always. Not guaranteed. But often enough that it’s worth building a framework around.
This doesn’t mean fade inside bars or blindly chase breakouts. It means that if the market opens inside range, we can reasonably expect that at some point in the session, one side of that range is going to give way.
If you’re a scalper, it might shape how you manage trades.
If you’re a swing trader, it might inform your bias.
If you’re a beginner, it’s a good starting point for research.
🛠️ How to Use the Tool
- Add it to your chart (link below)
- Zoom out to view enough bars
- Check how the ratio changes over time or across instruments
- Use it as a data point, not a signal generator
🔒 No Signals. No Predictions.
This is not financial advice. There are no signals. This is a research tool for traders who want to understand market behaviour better. That’s all.
If you want to explore it, here’s the private indicator link 🔗 – https://www.tradingview.com/script/VRJ1GoSc-Zen-IB-v-OB-Bar-Count-v1/


Leave a comment