If you’re day trading the ES futures or similar products, understanding the relationship between the Globex (overnight) session and the Regular Trading Hours (RTH) session is critical.
The Zen Globex H/L v1 indicator is a simple research tool that tracks the Globex High, Low, and Open—and shows you when the RTH session breaks out of that range.
✅ What It Does
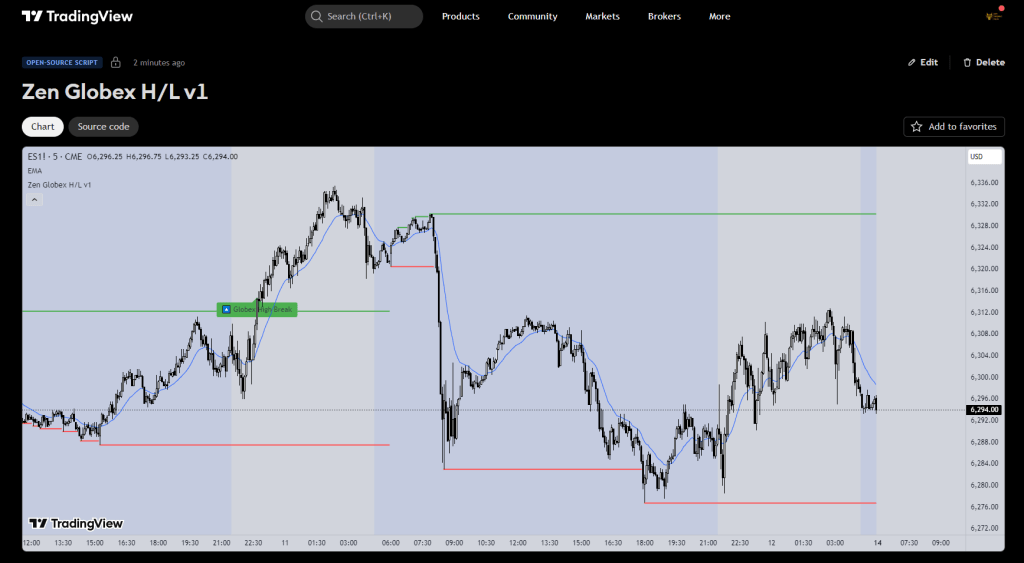
- Marks the Globex session range based on your input session (default: 17:00–08:30 Eastern)
- Plots horizontal lines for Globex High, Low, and Open
- Automatically tracks when the RTH session breaks the Globex high or low
- Adds clear visual labels when those breaks occur
- Keeps the chart clean by only displaying during RTH
📊 Why It Matters
This isn’t a signal tool. It’s situational awareness.
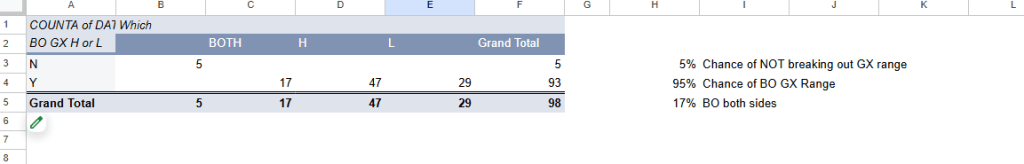
In our research, the RTH session will often break out of the Globex range—and many days, that first break leads to strong continuation.
Tracking these breakouts can help you:
- Stay on the right side of momentum
- Avoid fading strong sessions
- Study probability setups with a clear statistical framework
🛠️ How to Use It
- Load the indicator onto your ES chart
- Adjust session times if needed (e.g., for other contracts)
- Watch for 🔼 or 🔽 labels when the RTH breaks out
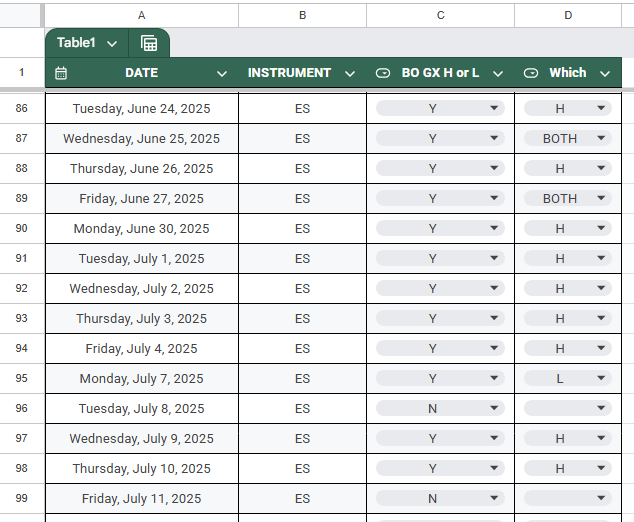
- Record or tag these days if you’re building a dataset
Here’s an example:
⚠️ A Note on Usage
This script is for educational and research purposes only.
There are no signals. No strategy. Just clear structure.
Use it to build your awareness and refine your edge.
As always, combine this with your own price action framework.
🧠 Simple tools. Clear logic. Designed for focused day traders.
📎 https://www.tradingview.com/script/O9q50J5P-Zen-Globex-H-L-v1/


Leave a comment