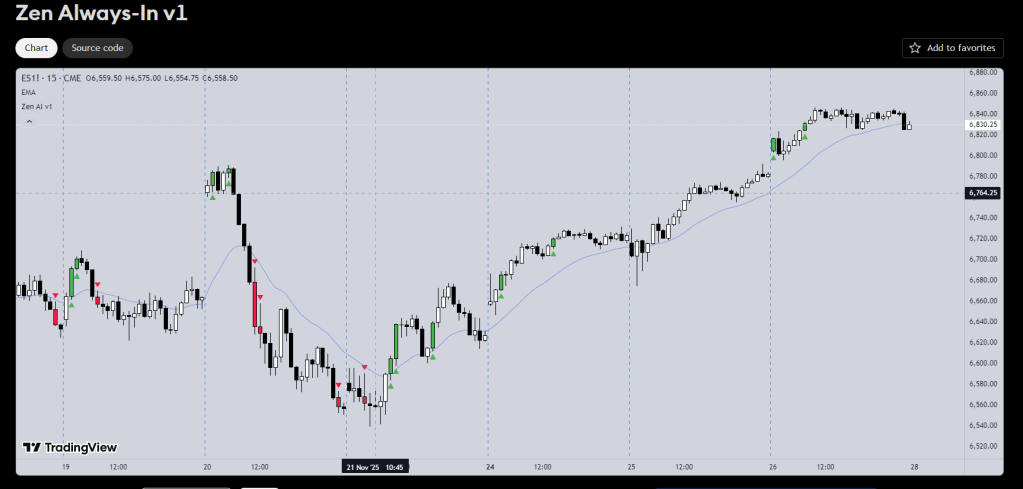
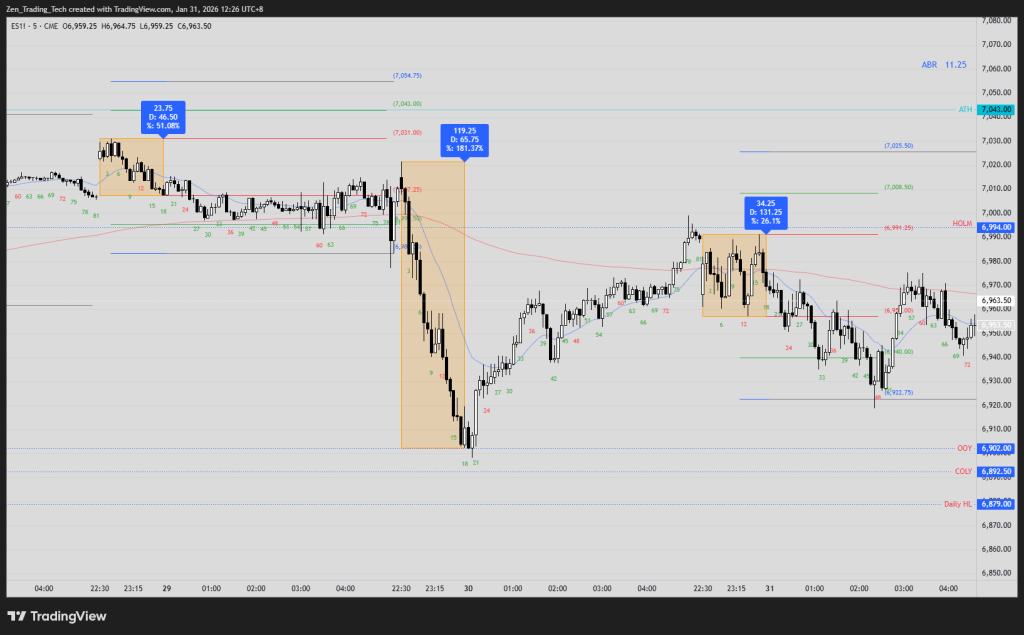
The Always-In indicator highlights bars on your chart to help determine context.
It looks for:
- consecutive bars on the right side of the MA,
- internal bar strength,
- and bar-range (size)
It is based off the work from Dr Al Brooks in the Brooks Trading Course.
Even if you don’t use TradingView, you can see the source code. You can get AI to make it for your charting package for research and learning.
The purpose is to make it easier to see when the market is leaning long or leaning short. It does not generate trade entries.
Link here:

Source code as usual is open for you.
1. Consecutive Bars in the Same Direction
The indicator looks for two consecutive bull bars or two consecutive bear bars.
2. Closing Position Relative to the Moving Average
Both bars in the sequence must close on the same side of a moving average:
- Bullish condition: both bars close above the MA
- Bearish condition: both bars close below the MA
You can choose EMA or SMA and adjust the length.
3. Internal Bar Strength (IBS)
IBS measures where the bar closes within its range.
The indicator checks that both bars meet the strength threshold:
- Bullish: IBS > 65
- Bearish: IBS < 35
This filters out bars that move directionally but close weakly.
4. Bar-Range Expansion
At least one of the two bars must have a range greater than the average bar range over a user-defined lookback.
5. Chart Output
When all conditions are met:
- Bull sequences highlight the bars in green
- Bear sequences highlight the bars in red
- Optional arrows are drawn to mark the sequence
- The moving average can be shown or hidden based on user settings
6. How Traders Typically Use It
The indicator helps with:
- Identifying when the market is leaning Always-In long or Always-In short
- Filtering weak countertrend ideas
- Understanding whether recent movement has enough strength to expect follow-through
- Training the eye to see bar sequences and bar quality in real time
- Used on higher time frames for swing entries.
It works on any timeframe or instrument.
Summary
The indicator applies a simple set of rules:
- Two consecutive bars in the same direction
- Both closing on the correct side of a moving average
- IBS confirming internal strength
- At least one bar exceeding the average bar range
When these align, the bars are highlighted.
It’s a clean tool for reading short-term context and bar strength.


Leave a comment