Mapping “The Dip”: A Visual Tool for Long-Term Investors
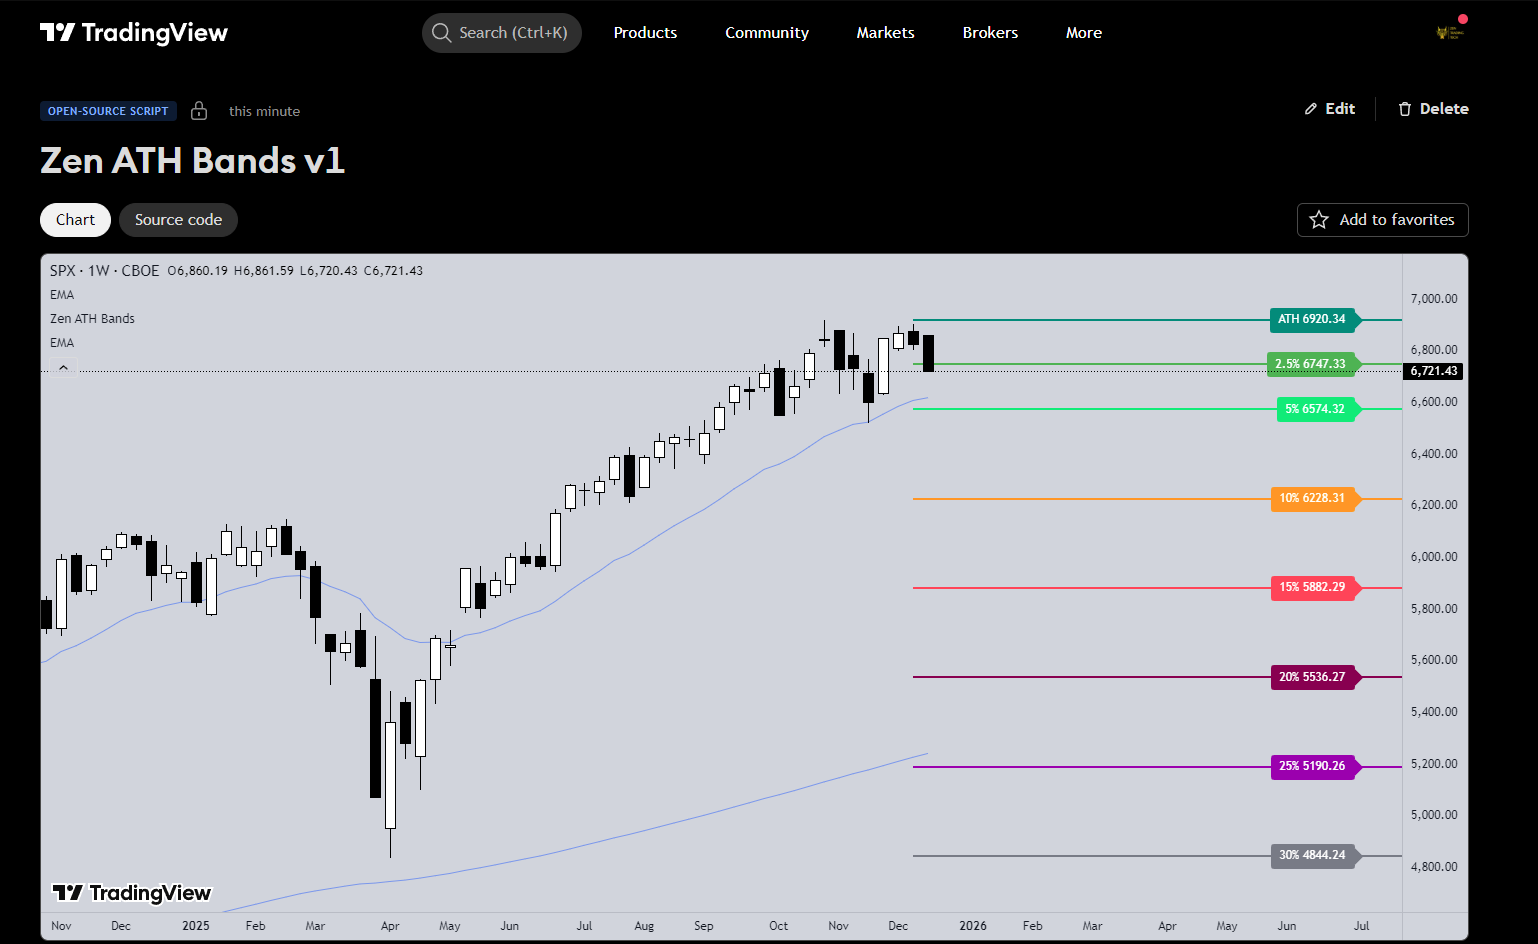
Technical Details This indicator plots horizontal drawdown levels projected into the right-hand margin. It calculates percentage drops from a selected anchor point (ATH or Current Price) to identify key price levels. Technical Features Custom Options Explained 1. Reference (refMode) 2. Right Offset (bars) 3. Percentage Band Toggles 4. Color Inputs Indicator Inputs Table Input Label … Continue reading Mapping “The Dip”: A Visual Tool for Long-Term Investors
3 Comments