If there’s one idea that explains more of what happens on a chart for me than anything else, it’s this: everything gets a second leg.
Maybe it works for you, maybe it doesn’t, but it helps me trade, so I’ll do my best to share it.
Strong breakouts get a second leg. Also pullbacks get a second leg. Even the counter-trend move against a trend gets a second leg. Even second legs get second legs… Once you start looking for it, you see it everywhere. And once you expect it, you stop getting surprised by it.
And when it doesn’t happen its a surprise. And surprises can get second legs too! Great huh?
This concept comes straight from Dr. Al Brooks — specifically Chapter 16 of Trading Price Action Trading Ranges, where he covers counting the legs of trends and trading ranges. It’s one of the most practical chapters in the entire series, and I think it deserves its own deep set of drills.
In this post, I’m going to walk through 9 scenarios where the second leg principle shows up. For each one, there’s a concept explanation, a homework drill you can run on yesterday’s chart, and a set of trade review questions to hold yourself accountable. Think of this as a framework you can return to again and again.
The Building Blocks: Bars, Legs, Moves, Structures
Before we get into the scenarios, let’s set the foundation.
- Bars form legs
- Legs form moves
- Moves form structures (trends, trading ranges, channels)
Simply: a leg is a smaller unit of a move, and a move is a smaller unit of a structure. When Al Brooks talks about “second legs,” he’s talking about the market’s tendency to try things twice before it either succeeds or gives up.
The trouble with observing energy and momentum on a chart is how abstract it can feel. Bars look different every day. The patterns don’t repeat exactly. That’s why you have to stay flexible with your counting. A leg isn’t always clean. Sometimes two small legs together form one larger leg. Sometimes what looks like one leg subdivides into two when you zoom in. The framework is a guide, not a straitjacket.
The Second Entry System
Al Brooks introduced the idea of using second entries (H2, L2) to get in and out of trades all day long. The logic is elegant: the market tries something once, pulls back, then tries again. If the second attempt succeeds, you’re with it. If it fails, you have important information.
This is actually a fairly robust system on its own. Many consistently profitable traders use second entries as the backbone of their approach. The whole thing rests on this simple truth: markets tend to try twice.
Everything below is an extension of that principle.
1. Strong Breakout → Expect a Second Leg
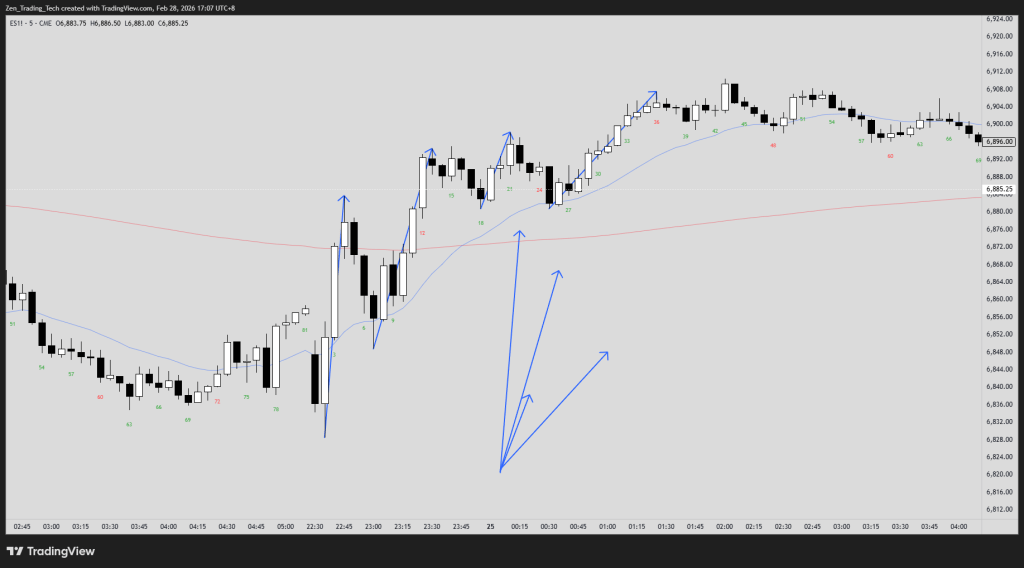
When you see a strong breakout (BO) — consecutive trend bars, closing on their extremes, good follow-through — expect the move to get a second leg after the first pullback.
This is one of the most reliable patterns in price action. The first leg breaks out. The market pulls back. Then a second leg pushes further in the same direction. Traders who sold or bought that first pullback are now trapped, and their stops fuel the second leg.
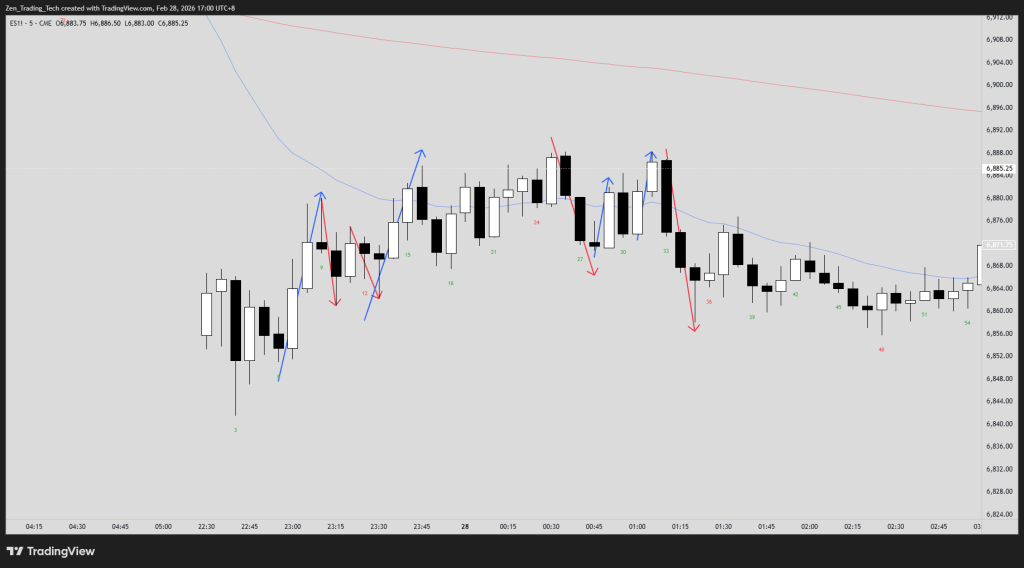
Homework: Pull up yesterday’s chart. Find every strong breakout that got a second leg. How far did the second leg travel relative to the first?
When it fails: When the second leg fails to materialise, or stalls quickly — what happened? Was there a strong reversal bar? Did the market run into a major support/resistance level? A failed second leg often means the move is done and a trading range (TR) is forming. Al calls this breakout mode and its a good time to go flat.
Trade review:
- How often did you get out before the second leg?
- If you exited after the first leg, ask yourself why.
- Was there a reason, or did you just get nervous?
- One of the most common mistakes is taking profits too early in a strong move because the pullback feels like a reversal.
2. A Strong Second Leg Can Get Its Own Second Leg
This is where it gets interesting. If the breakout is strong AND the second leg is also strong — big trend bars, momentum — then expect the market to pull back again and produce yet another leg. A strong second leg earns a third.
Think of it as the market saying: “There’s still energy here.” As long as the trend bars keep coming and the pullbacks stay shallow, there’s no reason to expect the move to stop.
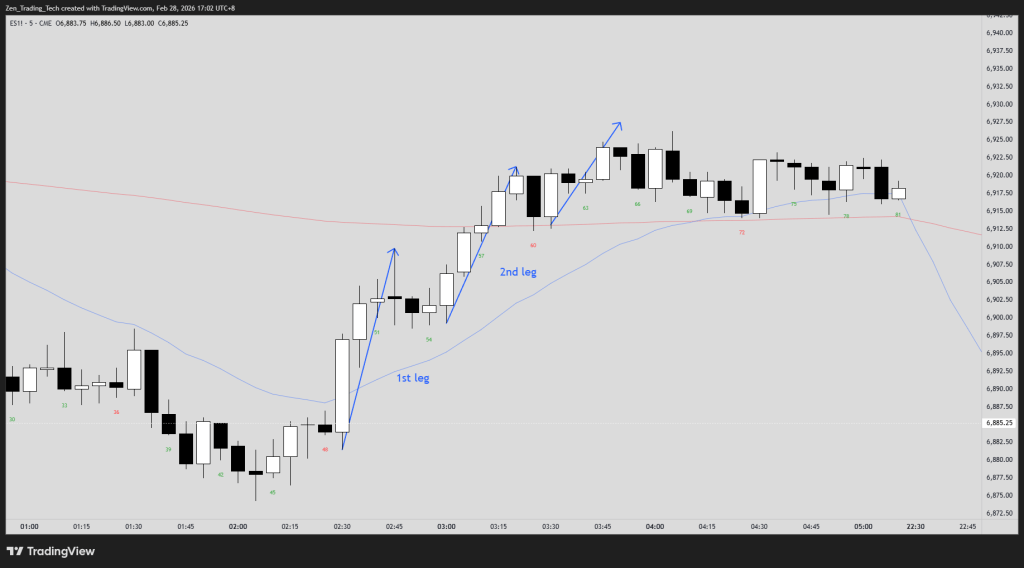
Homework: Look at yesterday’s chart. How often did a strong second leg produce another move? When you see three legs, notice that the third is really a “second leg of the second leg.”
When it fails: When does the third leg NOT come? Usually when the second leg shows exhaustion — overlapping bars, shrinking range, tail bars at the extreme. That’s the market telling you the energy is fading.
Trade review:
- How often could you have kept swinging for another leg?
- If you exited after the second leg, was there actually any opposite strength that justified your exit?
- Or did you just assume it was “enough”?
- A lack of opposite strength is your permission to hold.
3. Counter-Trend Moves Also Get Two Legs
This is the one that catches people off guard. You’re in a trend, and a pullback starts. The instinct is to assume it’s a one-bar or two-bar dip and immediately look to re-enter. But most pullbacks have two small counter-trend legs before the trend resumes.
After a strong breakout, the bears (or bulls, in a bear trend) will push back. They try once — that’s the first leg of the pullback. It fails to reverse the trend, but then they try again. That second leg of the pullback is where most trend traders should be looking to re-enter. Long live the High 2!

Homework: On yesterday’s chart, find every breakout followed by a two-legged pullback. Notice how the trend typically resumed after the second pullback leg, not the first.
When it fails: Sometimes the pullback only has one leg — the market just resumes immediately. This usually happens when the trend is extremely strong (spike phase). Other times, the pullback gets a third leg and starts to look like a reversal. Context matters.
Trade review:
- When you add to a trade or re-enter after a pullback, how often do you wait for the second attempt to fail before committing?
- Or do you jump in after the first pullback leg and then watch the market come back against you one more time?
4. Strong Pullbacks (Reversal Attempts) Get Follow-Through
Here’s the uncomfortable scenario. You’re long in a bull trend. The pullback is deep — strong bear bars, maybe taking out a minor swing low. It doesn’t feel like a normal pullback anymore. It feels like a reversal.
When a pullback is surprisingly strong, expect the first attempt at trend resumption to struggle. Strong reversals get follow-through. The bears tried hard, and they’ll try again. So even if the trend eventually resumes, the first push back up will probably fail or stall, and the pullback may get a second leg down.
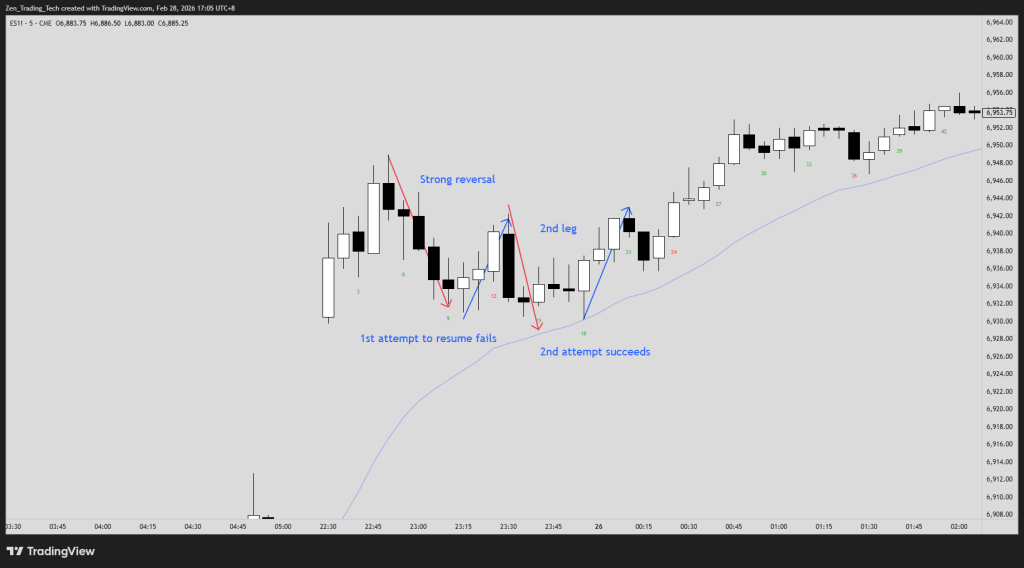
Homework: Find yesterday’s surprisingly strong pullbacks. Was the first trend resumption attempt successful, or did it fail? How often did the deep pullback get a second leg?
When it fails: Sometimes a deep pullback just snaps back immediately with equal or greater force. This is rare, but it happens — usually when the pullback runs into major support/resistance and buyers/sellers step in aggressively.
Trade review:
- When a pullback is running you over, what do you actually do?
- Do you exit and wait for more information? Or do you hold and hope?
- A strong pullback is either a fantastic place for a second entry long (2EL) or second entry short (2ES), or it’s the start of a genuine reversal.
- Either way, waiting for the second leg to play out gives you much better information than guessing after the first.
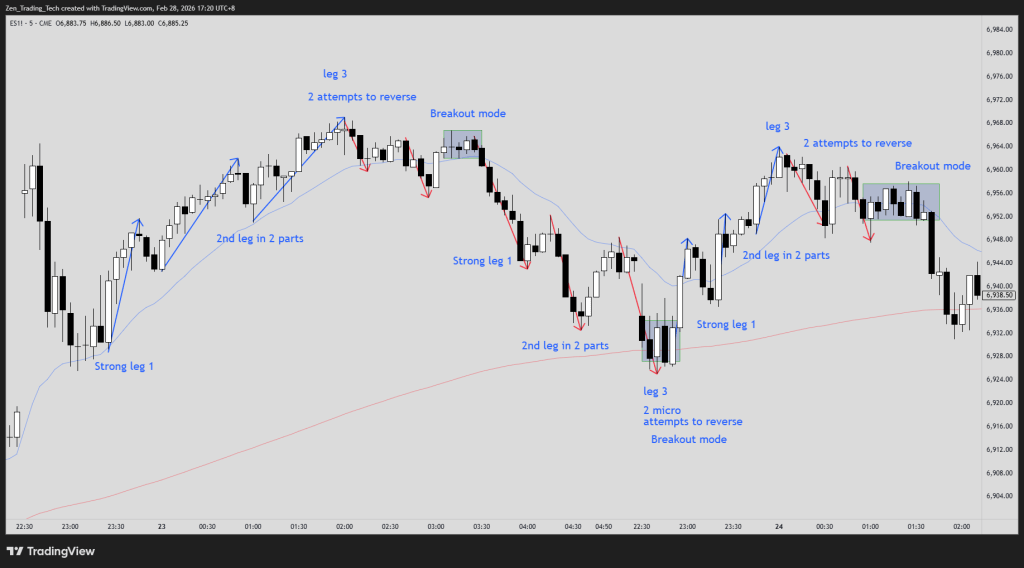
5. Second Legs Often Subdivide Into Two Parts
Here’s where counting legs gets flexible. A wedge pattern is technically three pushes — three legs. But you can also view it as two legs, where the second and third pushes together form one larger second leg.
A “leg” is relative to the timeframe and context you’re looking at. What matters isn’t the exact count — it’s the principle that the market tries twice at every scale.
Homework: Find yesterday’s three-legged moves. Now re-draw them as two-legged moves. Can you see how the second and third pushes are really just subdivisions of one larger second leg?
When it fails: When the “subdivisions” are all equal in strength and size, it can be hard to group them. That’s OK. The point isn’t perfect labelling — it’s recognising that the market tends to subdivide, and you should expect one more push even when it looks done.
Trade review:
- When you saw a second leg, did you exit?
- Or did you recognise it might subdivide and give you more?
- This is especially important at the end of trends where wedge-like behaviour is common.
6. First Leg Stronger Than Second Leg (Spike and Channel)
This is the spike and channel concept, and it’s one of the most important in all of Brooks PA.
The first leg (spike) is more commonly the strongest. It’s urgent, emotional, and fast. The second leg (channel) goes in the same direction, but it’s calmer. Smaller bars, more overlap, more pullbacks within it. The channel is still a trend, but it’s a more orderly version of what the spike started.
Many traders panic when the second leg looks weaker than the first. “The move is dying!” they think. But that’s exactly what a channel looks like. It’s not dying — it’s just more measured. The trend is intact until something actually breaks it.
Homework: Look at yesterday’s moves. Identify which part was the spike and which was the channel. Was the channel obvious in real time, or did you only see it after the fact?
When it fails: When the second leg is stronger than the first, pay attention. That’s unusual. It could mean the move is accelerating (buy climax / sell climax territory), or it could mean a different structure is forming. Either way, it’s worth noting.
Trade review:
- Did you panic out of trades during the channel phase because it “felt” weaker?
- Was the market actually reversing, or was it just the calmer second leg doing its thing?
- Learning to sit through a channel is one of the hardest skills in trading.
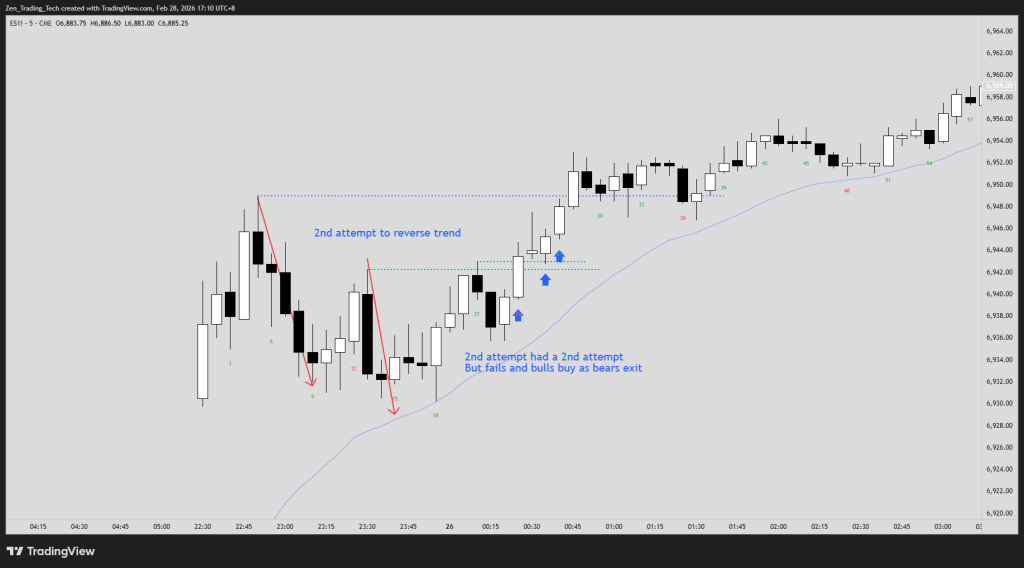
7. The Market Tries Twice to Reverse a Move
This is the flip side of the second entry concept. Just as the market tries twice to continue a trend (H2, L2), it also tries twice to reverse one. After a strong bull breakout, the bears will sell once, fail, then sell again. If the second attempt also fails, the bulls are in control.
This is why second entry signals are so powerful. You’re betting that the first reversal attempt was not enough, and that the second attempt will also fail. When both fail, the trapped traders fuel the next leg.
Homework: On yesterday’s chart, find where the counter-trend side tried twice to reverse the move. What happened after the second attempt failed? How much fuel did it create?
When it fails: When the first reversal attempt succeeds — when the market doesn’t even need a second try — that’s a sign of extreme opposite strength. The reversal was so powerful it didn’t need a second leg. These are rare but important to recognise. They often happen at major HTF (Higher Time Frame) support/resistance levels.
Trade review:
- Are you entering after the second reversal attempt fails?
- Or are you fighting the trend, trying to catch the reversal?
- Most traders would be more profitable if they simply waited for two reversal attempts to fail before trading with the trend.
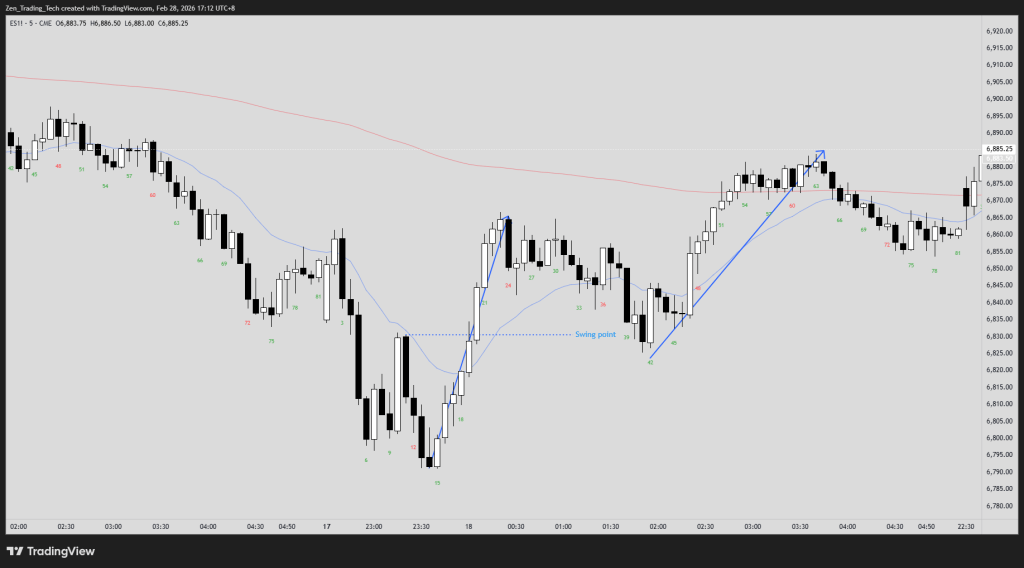
8. Major Trend Reversal (MTR): When the Counter-Trend Move Wins
Sometimes the second leg of a counter-trend move is so strong that it becomes a trend in its own right. This is a Major Trend Reversal (MTR) — when the counter-trend side takes out a swing point AND crosses the Moving Average (MA).
When this happens, the old trend is likely done. The new direction has proven itself with a strong enough move that “buying low, selling high, and scalping” (BLSHS) becomes a better idea than continuing to swing trade in the old direction.
Homework: On yesterday’s chart, where was the counter-trend move so strong that an MTR was the better read? Where would you have switched from swinging to scalping?
When it fails: Failed MTRs happen. The market crosses the MA, takes out a swing point, but then reverses again. This typically creates a large TR. If you see this, shift to range trading rather than expecting a new trend.
Trade review:
- Did you keep re-entering a move that was done?
- Were you trying to catch a late pullback or late leg in a trend that had already reversed?
- Or did you recognise the MTR and adjust?
- Equally important — did you exit at the start of the new move, or did you hold on hoping your old position would come back?
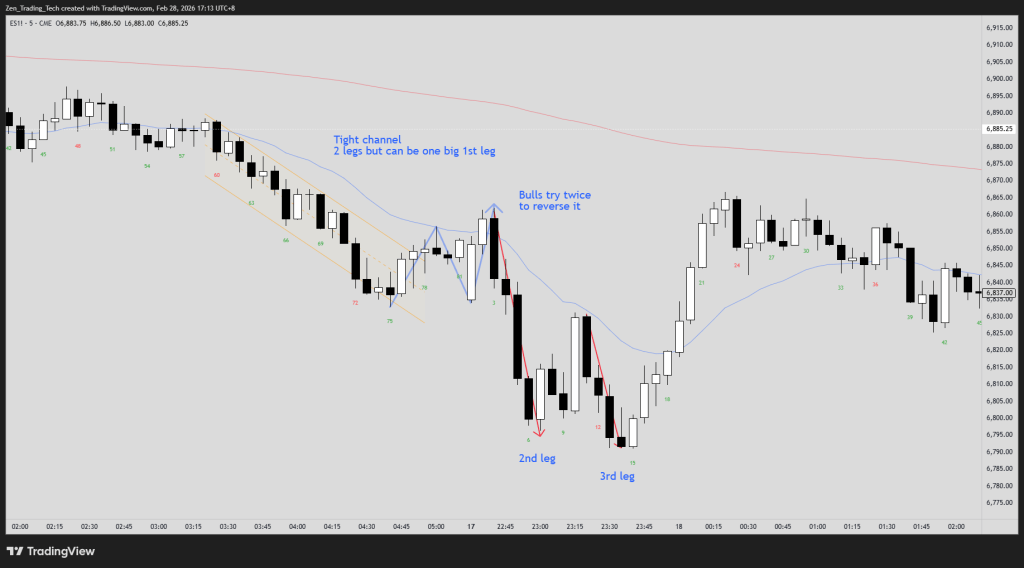
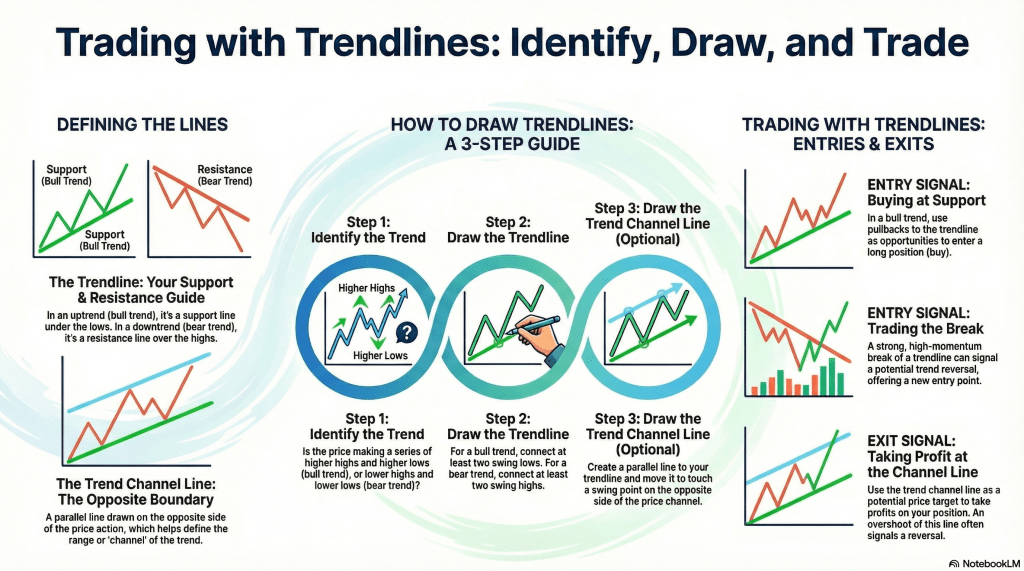
9. Two Legs in a Tight Channel? Might Be a First Leg
Here’s a subtle one. You see two legs in the same direction, but they’re in a tight channel (TC) — no trendline break yet, bars are orderly, pullbacks are small. When this happens, those two legs together might be a first leg of a larger move.
The logic: if there hasn’t been a meaningful trendline break, the energy hasn’t been tested yet. The whole channel could be building pressure for a second, larger leg. You won’t know until the trendline breaks and you see what happens next.
Homework: On yesterday’s chart, where did the leg count only make sense after a trendline break? Where did what looked like “two legs” in a channel turn out to be just the first leg of something bigger?
When it fails: The V-reversal. Sometimes the channel breaks sharply in the opposite direction without ever getting that larger second leg. This is more common when the channel runs into a strong opposing force (major S/R level, end-of-day profit-taking, news event). When a channel reverses violently, stop expecting a second leg and assess the reversal on its own terms.
Trade review:
- Did you exit a trade after two legs in a channel, assuming the move was done?
- What if you had waited for the actual trendline break before making that decision?
How to Use This Framework
This is a lot of concepts in one post, so here’s how I’d approach it practically:
- Pick one instrument. Set a timer and just focus on 1 of 9 above. Give each one a full burst of focused attention.
- Use TradingView replay. Load up yesterday’s chart and step through it bar by bar. When you see the pattern, pause. Label it. Write down what you see.
- Keep a log. For each scenario, note how many times it appeared, how many times it worked, and how many times it failed. After 20 days of this, you’ll have genuine data on how reliable each pattern is.
- Connect it to your own trading. My favourite. Look at your prior trades. Focus on each of the 9 above. The trade review questions in each section are the most important part. They’re designed to make you confront the gap between what you know and what you actually do.
The goal isn’t to memorise these nine scenarios. It’s to build an intuition for how the market tries things twice. Once that intuition is solid, you won’t need the list anymore — you’ll just see it.
Conclusion
High probability trading means everything gets a second leg. Breakouts, pullbacks, reversals, counter-trend moves — all of them. The market is a two-attempt machine. It tries, it pauses, it tries again. Your job is to wait for that second attempt and then act on the outcome.
This entire framework comes from Dr. Al Brooks’ work on counting legs. I’d encourage you to read Chapter 16 of Trading Price Action Trading Ranges if you haven’t already. What I’ve done here is break it into drillable scenarios with homework you can actually run on live charts.
Does it always work? No. But the principle is sound, and the more charts you study with this lens, the more natural it becomes. It is the foundation of how I enter and manage trades, so even though it might appear simple, it is the highest value trading principle I know!
Do the drills!
Happy trading!
Tim
Zen Trading Tech


Leave a comment