- Introduction
- High 2 Failed but No Test? Measured Move Down
- Failure of a Failure: 3 More Trades
- Cost Averages – level 1 and 2
- If is a Trading Range Day – Draw Lines, Come Back Later
- Open of the Day? Test Yesterday’s Failures.
- Failed? Wait for 3 More Legs Before Scaling in
- Failed Hard. What does it look like?
- Reversal Trades 1 of 2: Scalp to Midpoint
- Reversal Trades 2 of 2: Swing to 1st Entry
Introduction
- This is Part 2 of the “Failure of a Failure” series. If you haven’t read Part 1, start there — it covers the foundation: what happens when high probability trades like the H2, L2, and bear microchannel fade fail, and how each failure creates a test target.
- In this post, we go deeper. What happens when the test doesn’t come? What happens when it does come but fails again? How do you manage your risk when failures start stacking? And most importantly — how do you turn all of this into actual trades?
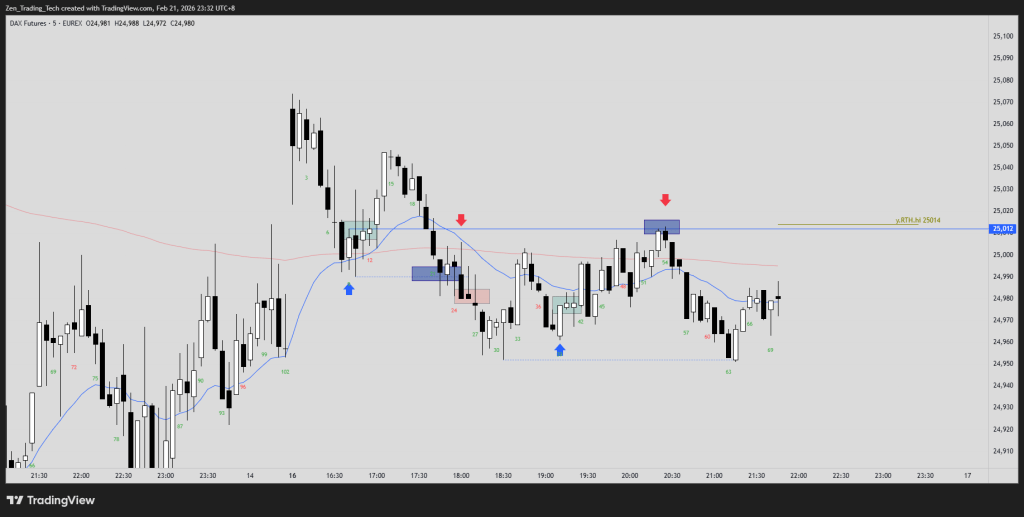
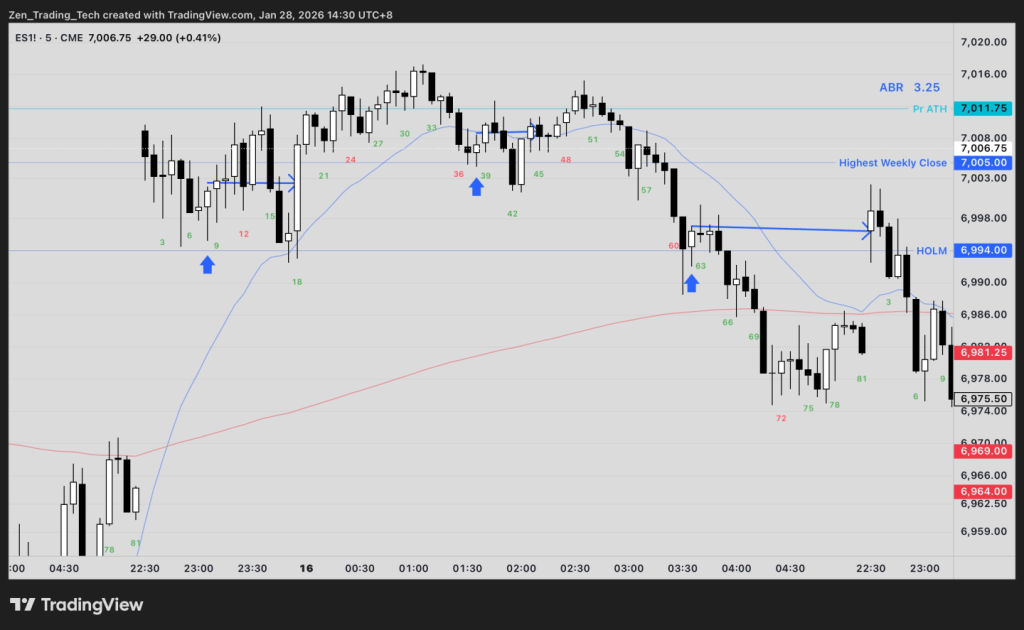
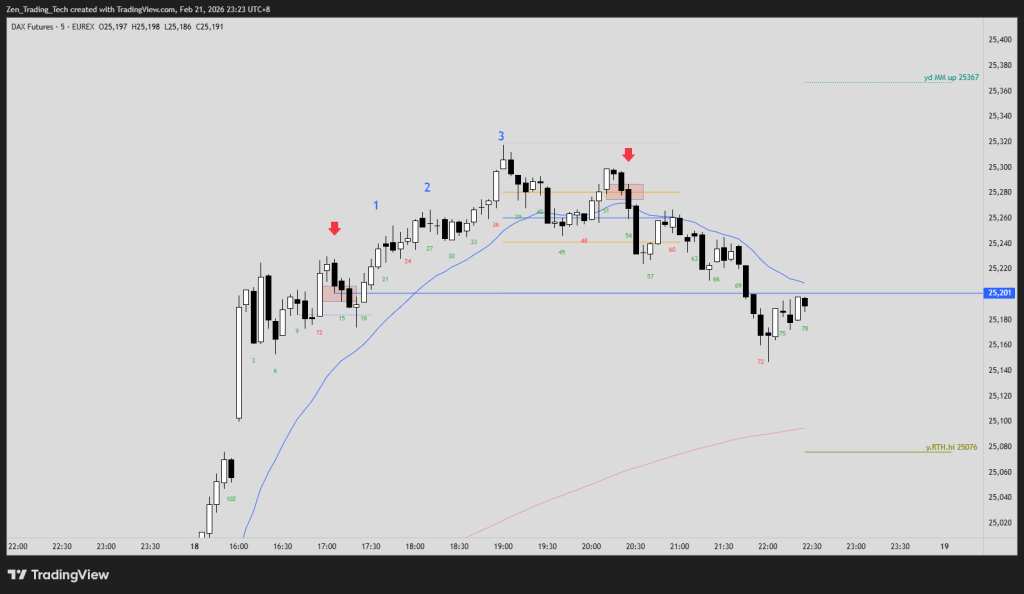
High 2 Failed but No Test? Measured Move Down
Sometimes the H2 fails and the test never comes. The market just keeps going. This is the scenario most traders dread — you took the loss and there’s no recovery trade waiting for you.
But even here, the failure gives you information. A failed H2 that doesn’t get tested is telling you something important: the bears are in control and they’re not giving anything back. In this context, the measured move down becomes the framework. Measure the leg that broke the H2 and project it downward. That’s your next reference point.
The key lesson is that not every failure creates an immediate test. Some failures confirm a trend. Recognising the difference — does this failure create a test target, or does it confirm the move? — is what separates scalpers from traders who keep fighting the trend.
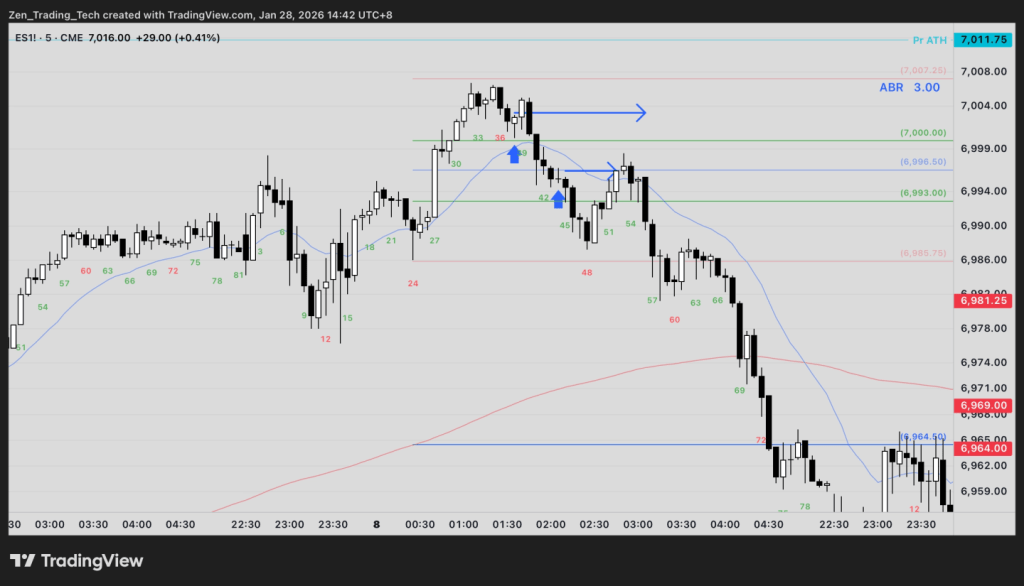
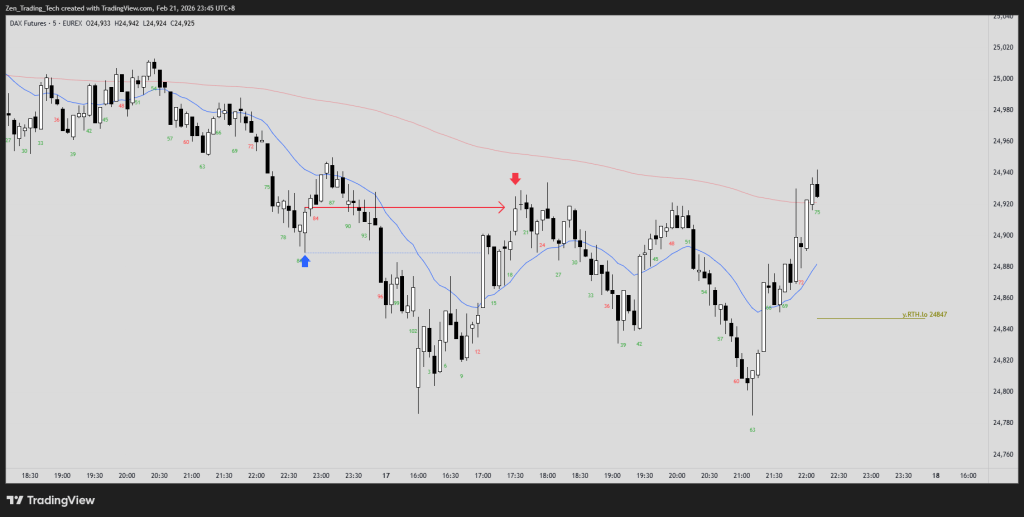
Failure of a Failure: 3 More Trades
Here’s the core concept of this entire series. A high probability trade failed. The test of that failure also failed. Now what?
The answer: three more trades. When a failure of a failure occurs, Al Brooks teaches that there are typically three more trade opportunities that develop from it. The market doesn’t just reverse and run — it works through a process. Each attempt to resolve the failed failure creates another entry opportunity.
This is where patience matters. You don’t need to catch the first one. You need to recognise the pattern is unfolding and be ready for the second or third opportunity, which often comes with better context and a clearer signal bar.
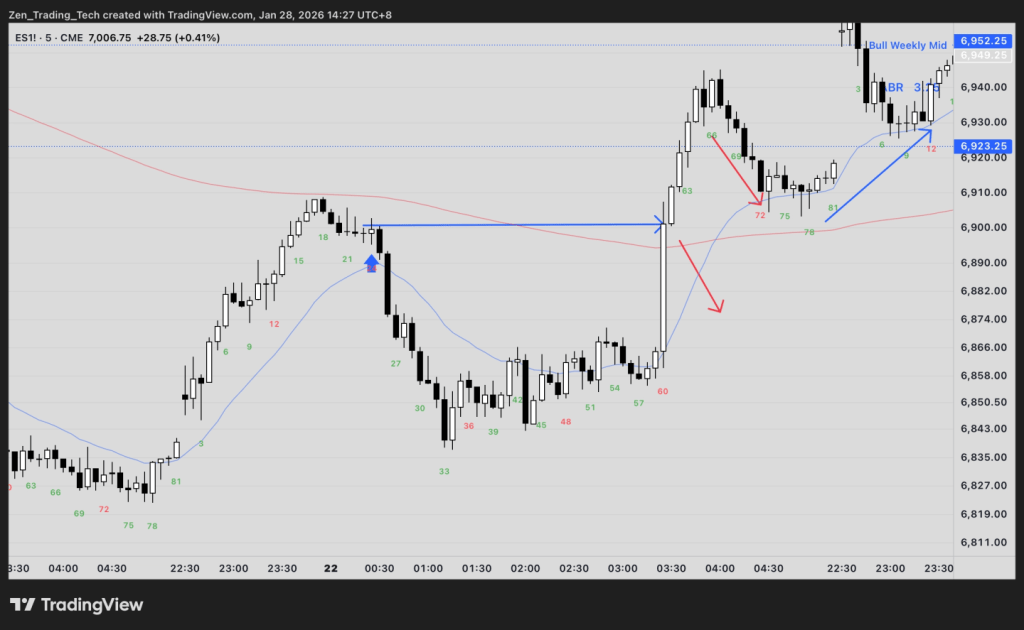
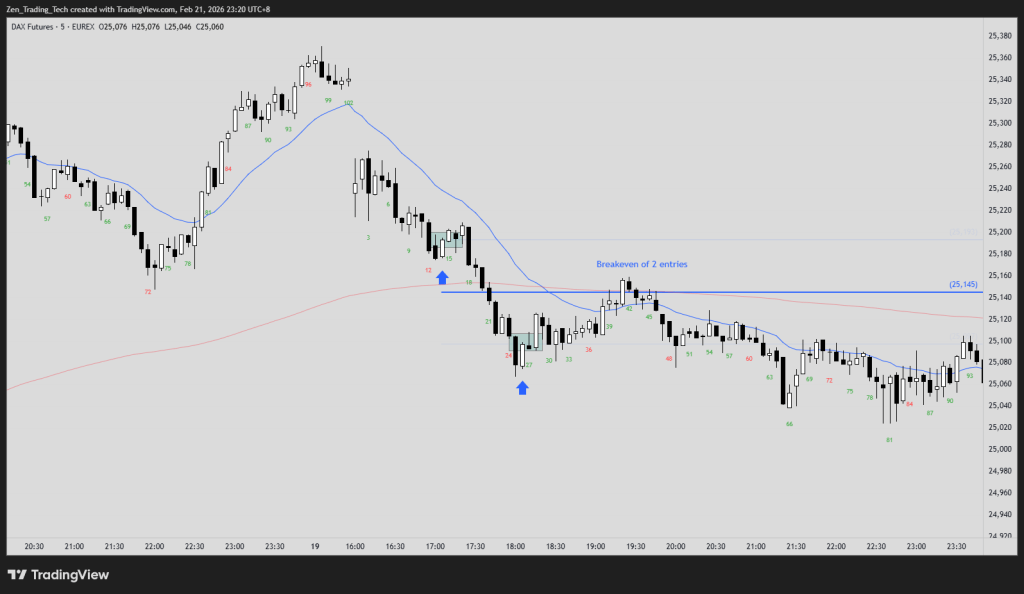
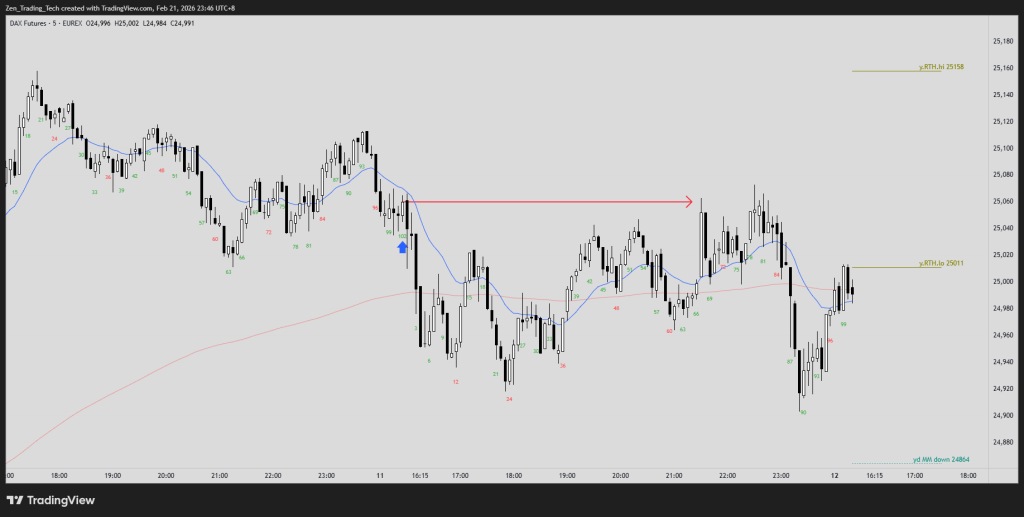
Cost Averages – level 1 and 2
Cost averaging gets a bad reputation, and for good reason — most traders do it wrong. They add to losers hoping for a bailout. But in the context of failures and tests, cost averaging is a structured decision with defined risk.
Level 1 is the straightforward version. Your first entry fails, the market moves against you, and you add at a predetermined level where the probability of at least a partial recovery is high. Your average entry price improves, and you only need a smaller move back to break even or profit.
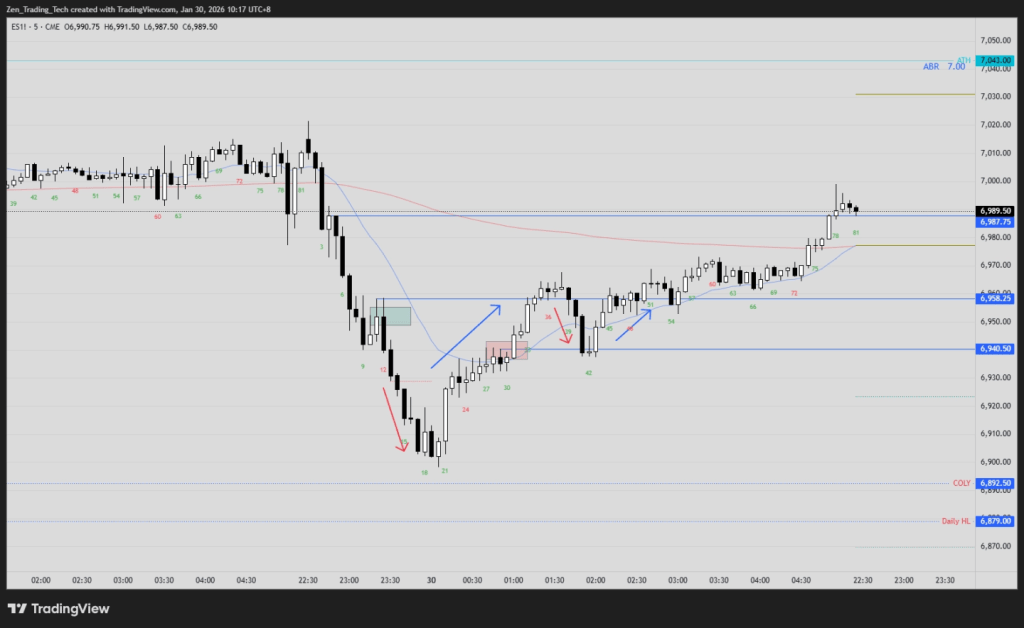
Level 2 is more aggressive. You’re adding a third time, which means your original read has failed twice. This only makes sense if the broader context still supports your direction — for example, if you’re buying in what you believe is a trading range and price is near the bottom of that range. The risk is defined, and the reward is that your average price is now deep enough that even a modest bounce gets you out.
The critical rule: you must define your maximum risk before the first entry. Cost averaging without a plan is just denial with extra steps.
Level 1
Level 2
If is a Trading Range Day – Draw Lines, Come Back Later
This is one of the most practical pieces of advice in all of Brooks PA. If failures are stacking up on both sides — bulls failing, bears failing, tests failing — the market is probably in a trading range. And trading ranges punish traders who keep trying to force a directional trade.
The right response is to stop trading, draw your lines, and come back later. Mark the high probability failure levels, the test targets, the measured move targets. Let the range develop. Eventually one side will win — a breakout will hold, or a failure of a failure will resolve — and that’s when you trade.
This is hard to do. It feels like giving up. But the traders who recognise a trading range day early and stop forcing trades are the ones who still have capital left when the real move happens.
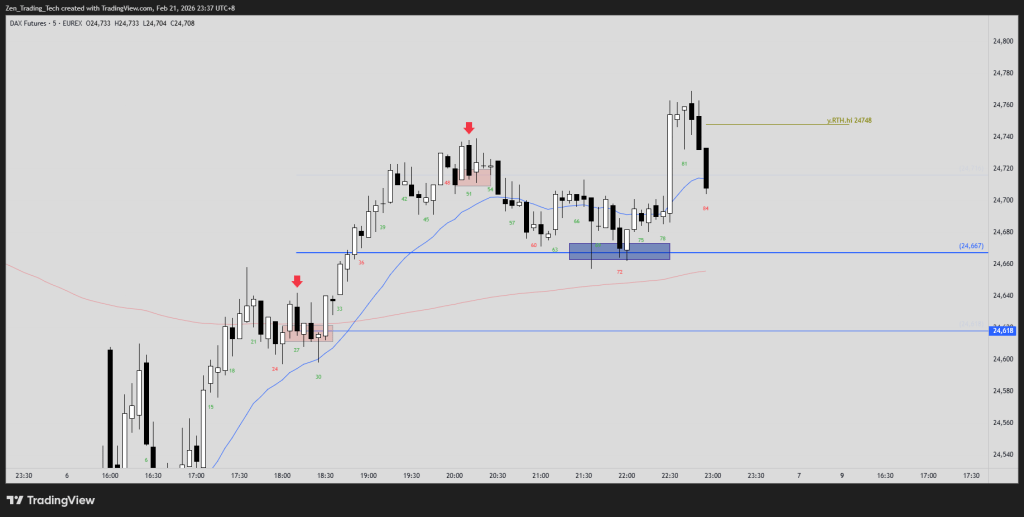
Open of the Day? Test Yesterday’s Failures.
This is where the framework extends beyond a single session. If a high probability trade failed yesterday and never got tested, that test target carries forward into today. The market has memory.
Watch the open. If the market opens near yesterday’s failed trade level, the probability of a test is high. This gives you a pre-planned trade before the session even begins — you already know the level, you already know the logic, you just need the signal bar.
This is one of the most underrated edges in day trading: doing your homework the night before by identifying yesterday’s unresolved failures, then watching for tests at the open. It turns the most chaotic part of the day — the first 30 minutes — into something you’ve already prepared for.
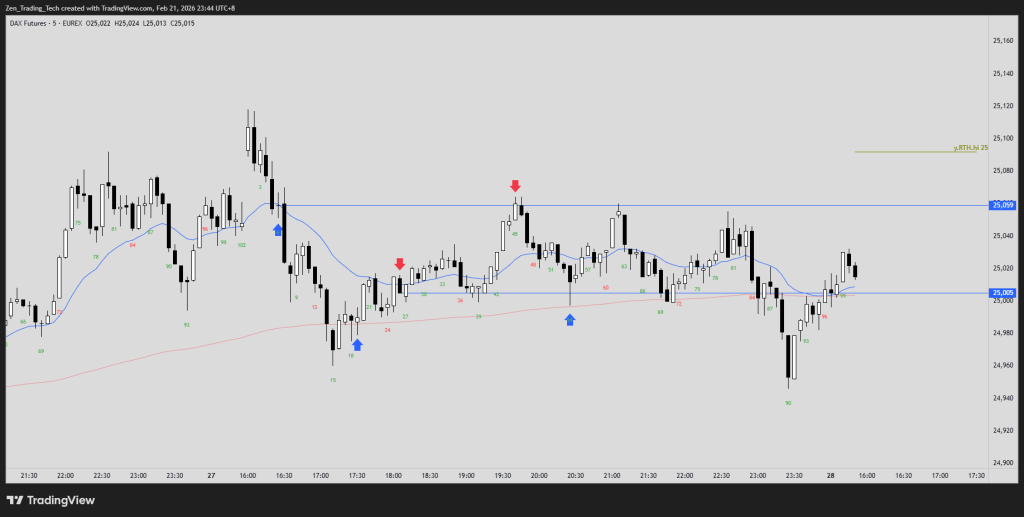
Failed? Wait for 3 More Legs Before Scaling in
When a test fails, the temptation is to immediately try again. Don’t. The three-leg rule is your protection against overtrading a failed thesis.
After a failure, wait for three more legs (pushes) in the direction against you before considering another entry. Three legs means the market has had three separate attempts to continue against your position. Each leg weakens the move — momentum fades, bars get smaller, tails appear. By the third leg, the probability of a reversal or at least a pause is significantly higher.
This isn’t about predicting the exact turn. It’s about waiting until the probability shifts back in your favour before committing more capital. Three legs is the minimum patience required.
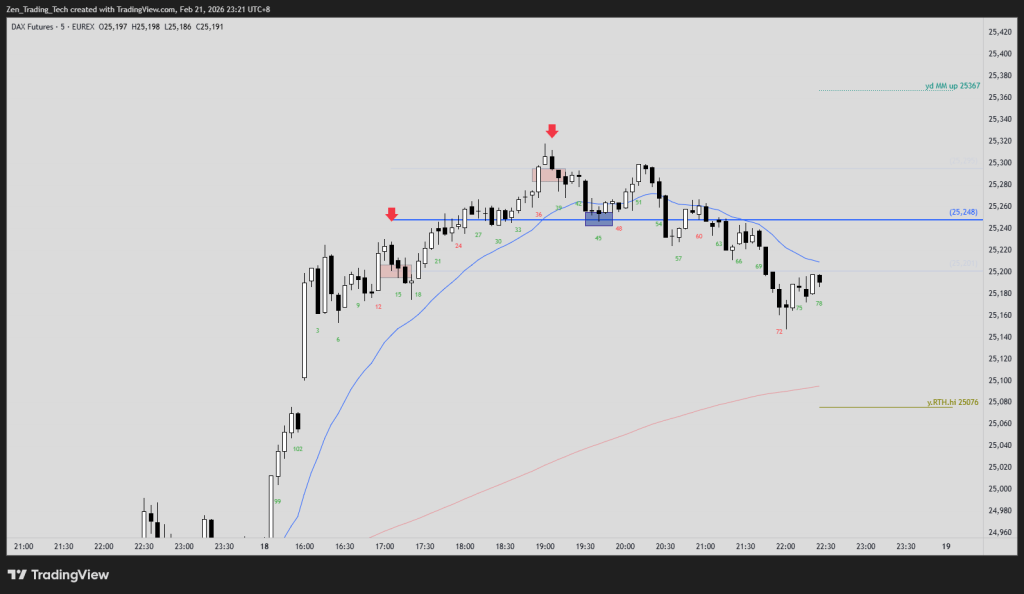
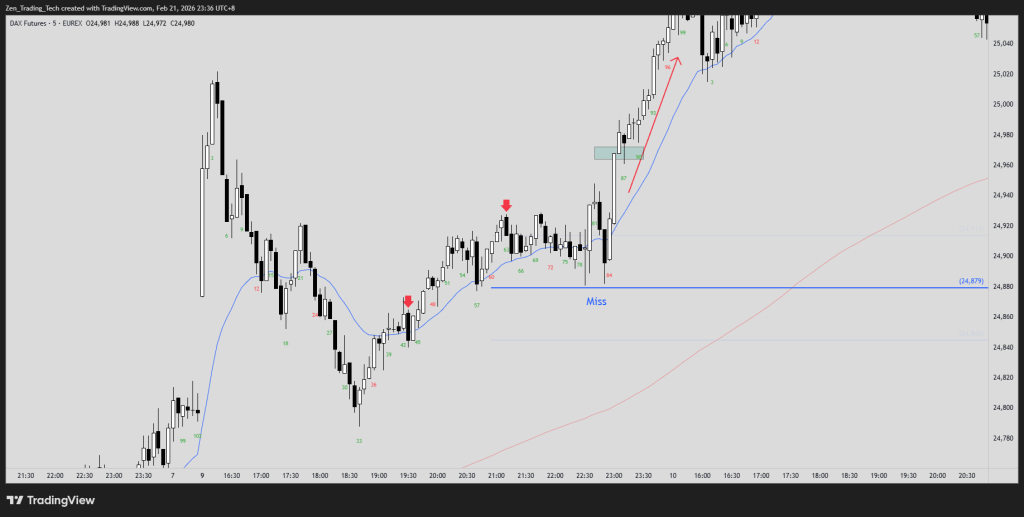
Failed Hard. What does it look like?
Not all failures are equal. A trade that barely fails — stops you out by a tick, then reverses — is very different from a trade that fails hard. You need to know the difference because your response should be different.
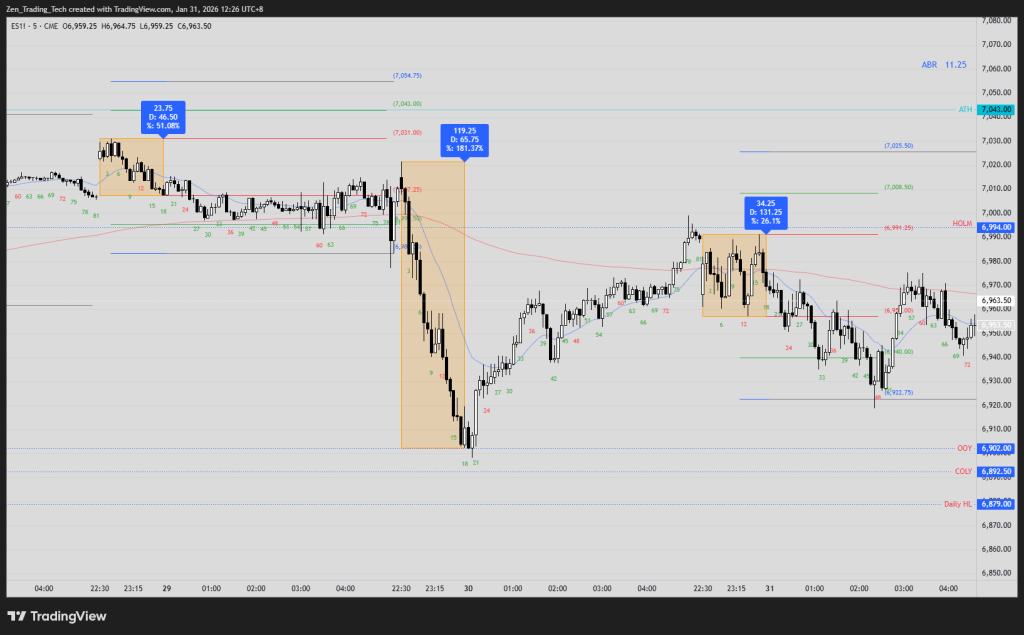
A hard failure looks like consecutive big bars against your position, often with no tails, closing on their extremes. There’s no ambiguity. The market isn’t just testing — it’s moving. When you see a hard failure, the test target framework still applies, but the timeline extends. The test might not come for 20 or 30 bars, or it might not come at all within the session.
Recognising a hard failure early saves you from adding to a loser in a situation where the market has clearly chosen a direction. Sometimes the right read is: this failed hard, the test isn’t coming today, move on.
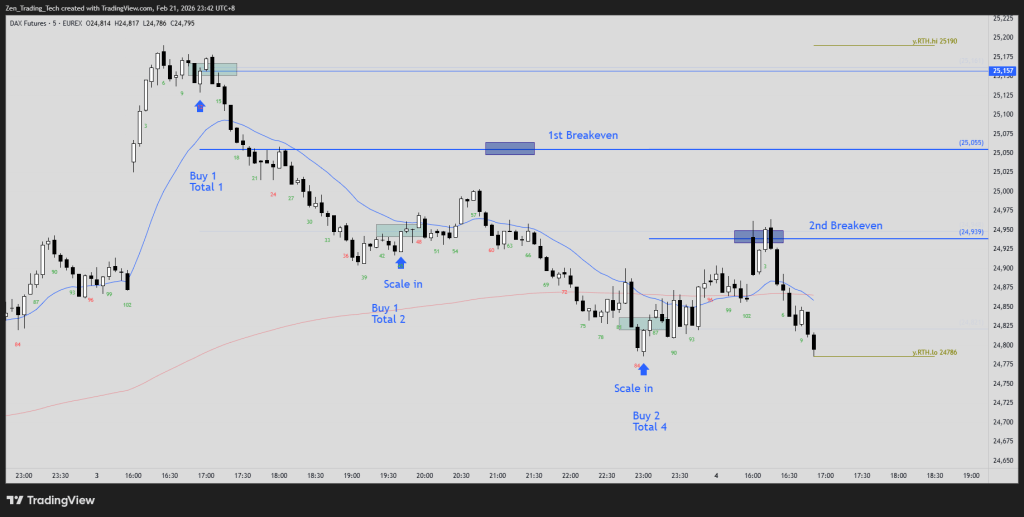
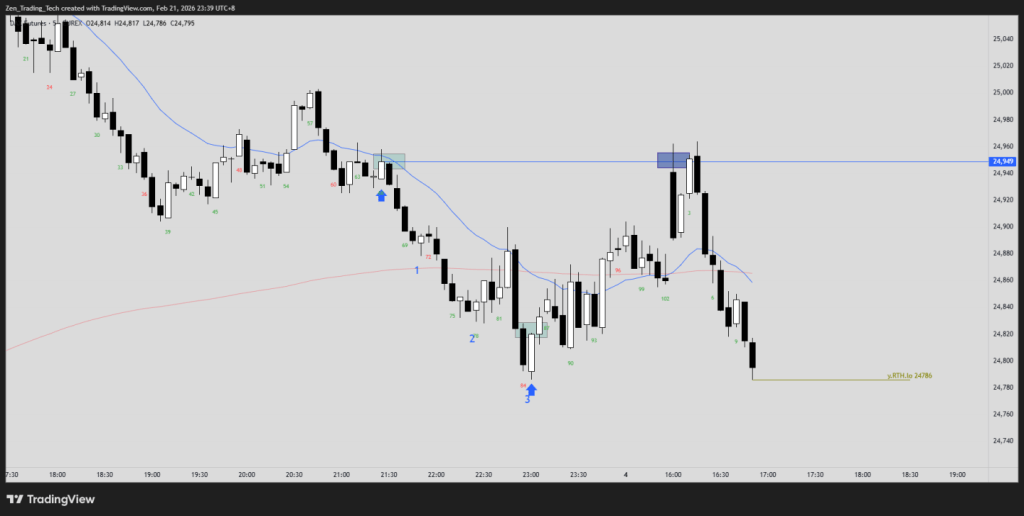
Reversal Trades 1 of 2: Scalp to Midpoint
When the failure of a failure finally resolves — when the market does reverse from a failed test — you have two trade management options. The first is the scalp: target the midpoint of the range that developed during all the failing and testing.
The midpoint is a natural target because it represents the “fair price” of the range. Both sides have traded there, both sides have positions there. Price tends to return to the midpoint before deciding on the next move.
This is the conservative play. You get out with a profit, you don’t try to be a hero. For scalpers, this is the bread and butter — take the midpoint, move on, look for the next setup.
Reversal Trades 2 of 2: Swing to 1st Entry
The second option is more ambitious: swing the trade all the way back to your original first entry price. This means holding through the noise, through potential pullbacks, through the market working its way back to where the entire sequence began.
This works when the context supports a bigger move — a trend reversal, a breakout from a trading range, or a strong failure of a failure with follow-through. The 1st entry price is your target because that’s where the original trapped traders entered. When price reaches that level, those traders will exit (creating resistance if they were long, support if they were short), and the move often stalls.
The swing approach requires wider stops and more patience, but the reward-to-risk is significantly better than the scalp. The ideal scenario is to take partial profits at the midpoint (Trade 1) and swing the rest to the 1st entry (Trade 2).


Leave a comment