Intro
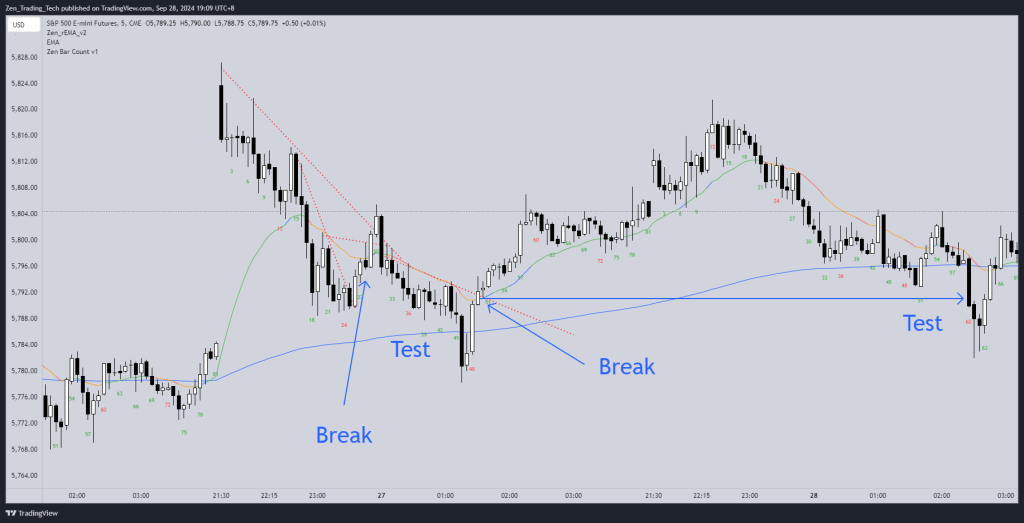
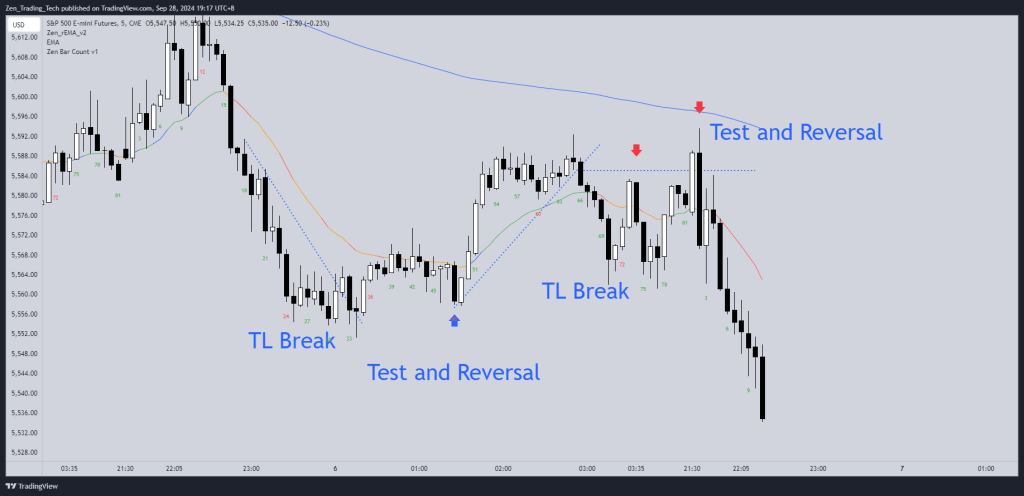
- Trendline breaks are often are followed by a test of the H or L and then a reversal.
- Many traders will lose money on that failed breakout
- So this drill is to help reduce those losses
Video
- I made a video on this here:
- Intro
- Video
- Drill 1: Trendlines – Break- Test or not?
- Drill 2: Trendline Break, New High, Reversal
- Drill 3: Trendline Break on the Open
- Drill 4: Moving Average Break
- Conclusion
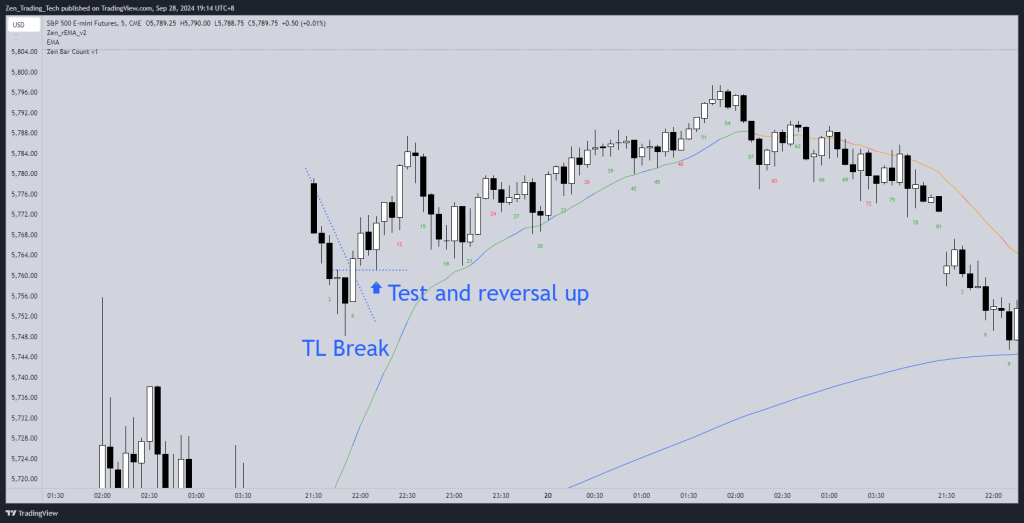
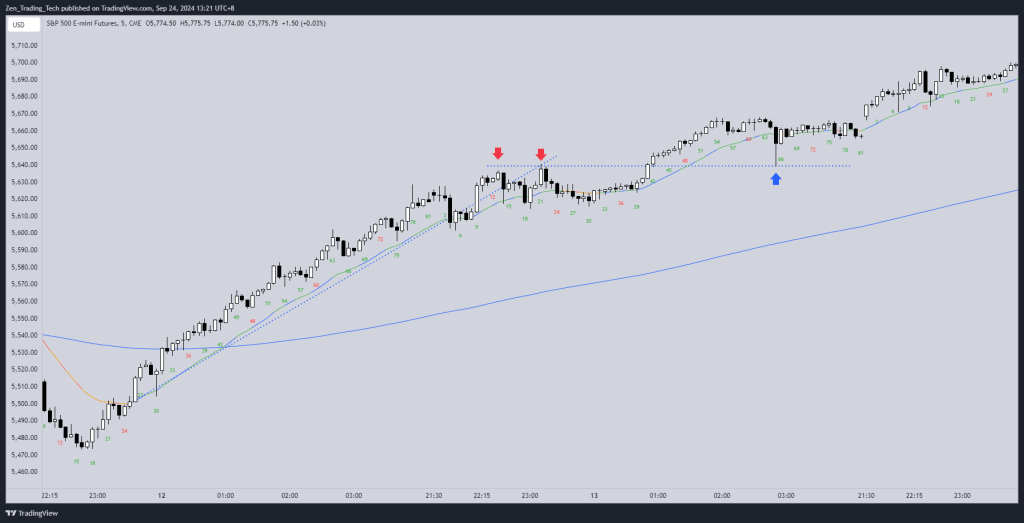
Drill 1: Trendlines – Break- Test or not?
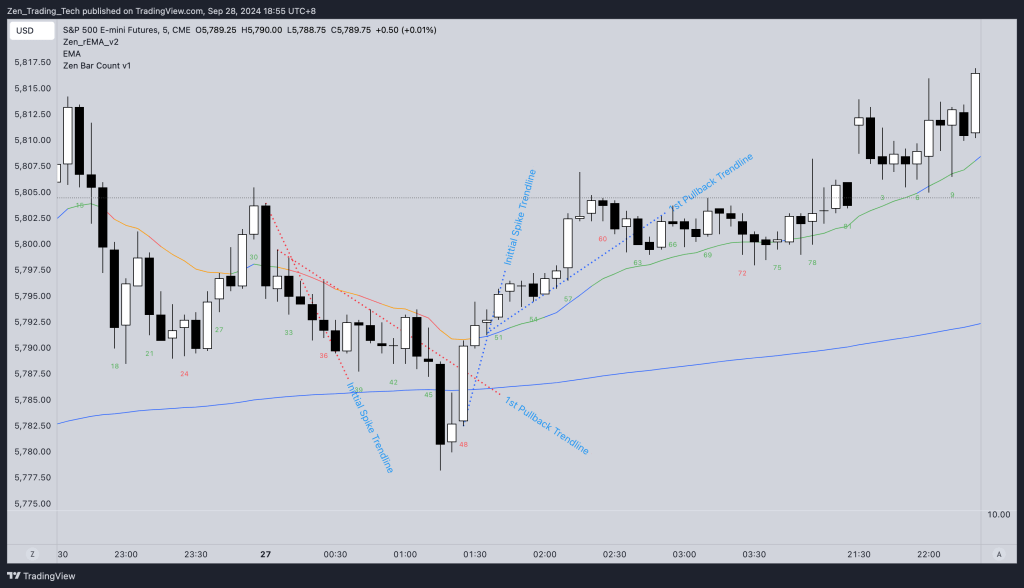
Instructions
- Bear trendline is ABOVE
- Bull trendline is BELOW
- You can draw the whole move – but you often have to re-draw them.
- This is because the line from the initial spike will be different if you connect the trendline from the first pullback
- See examples below
- It works better if you take it from the 1st pullback
- Did we test it or not after?
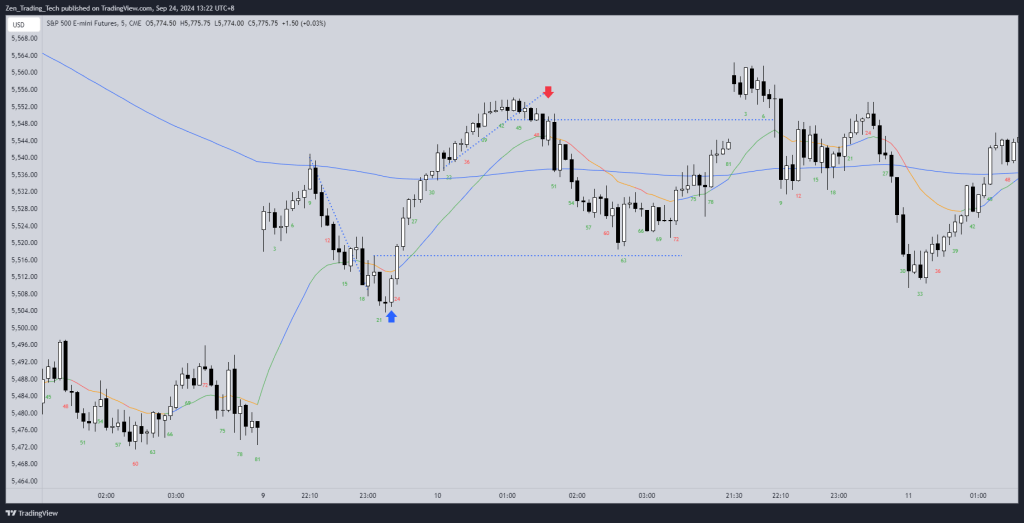
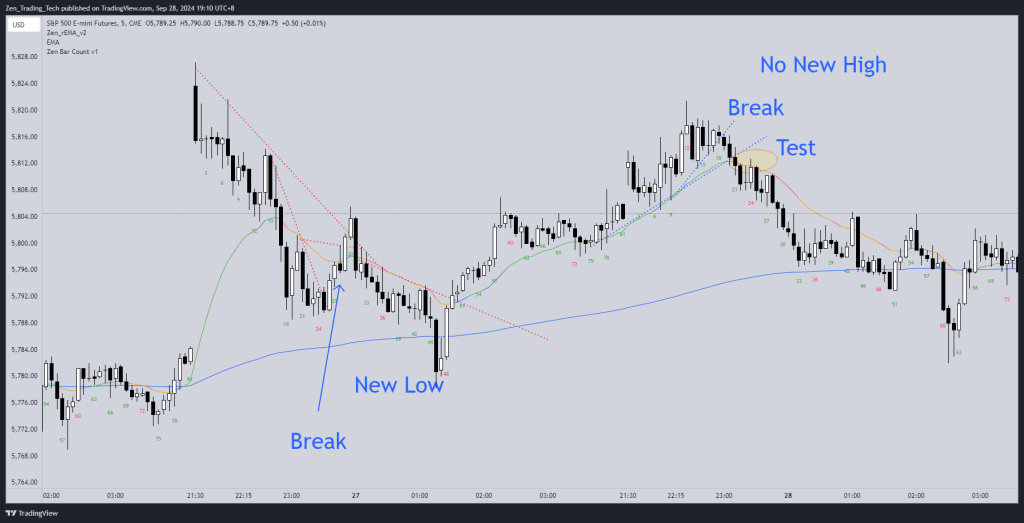
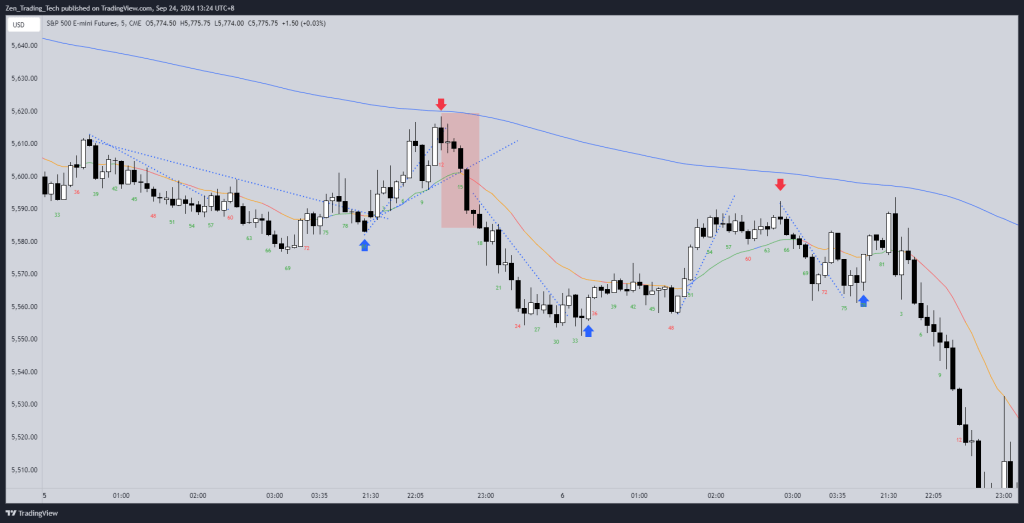
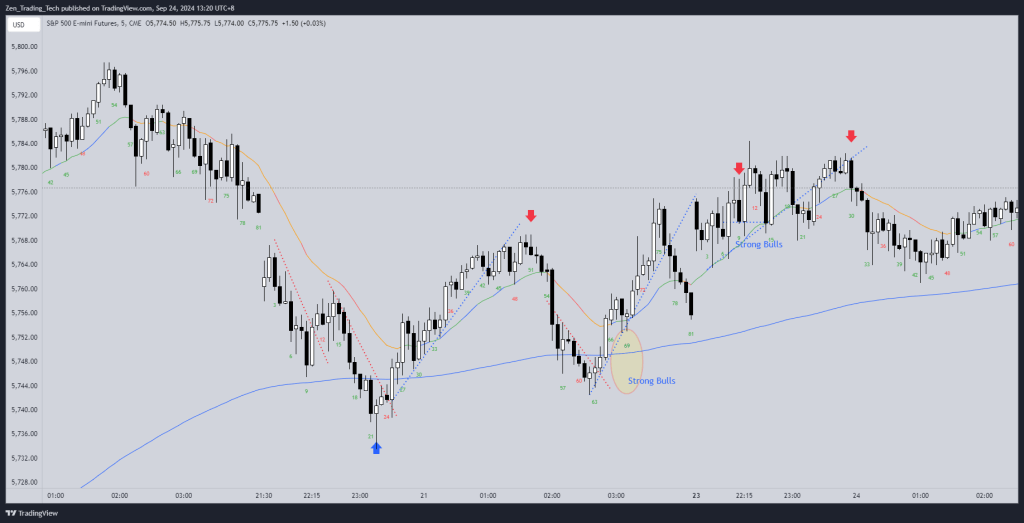
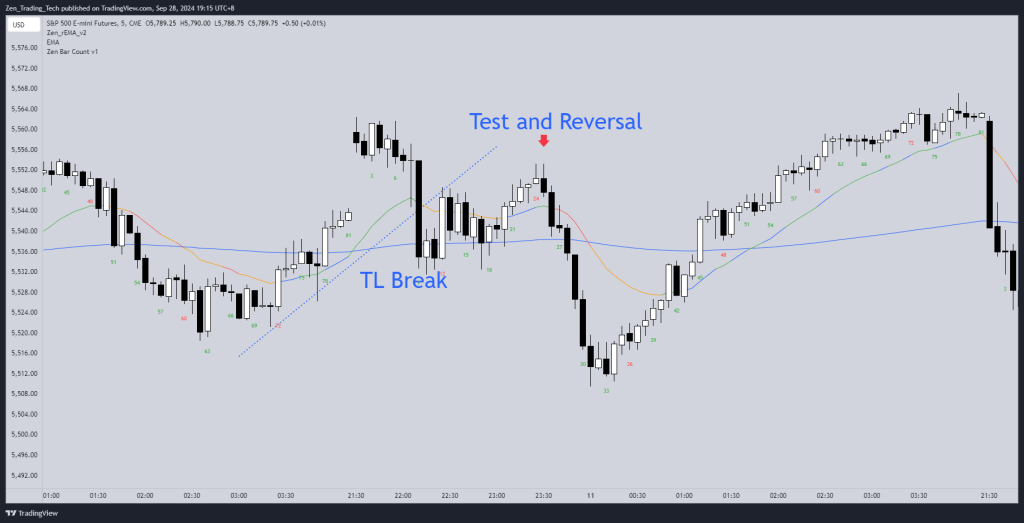
Drill 2: Trendline Break, New High, Reversal
Instructions
- This traps traders into a fake breakout
- These appear as higher-higher double tops and lower-low double bottoms
- It is very common on the open
- When channel is too tight:
- Avoid Trading Countertrend When No Trendline Break
- Stay In Swing When No Trendline Break
- Test does not have to get to new high or low – reversal strong
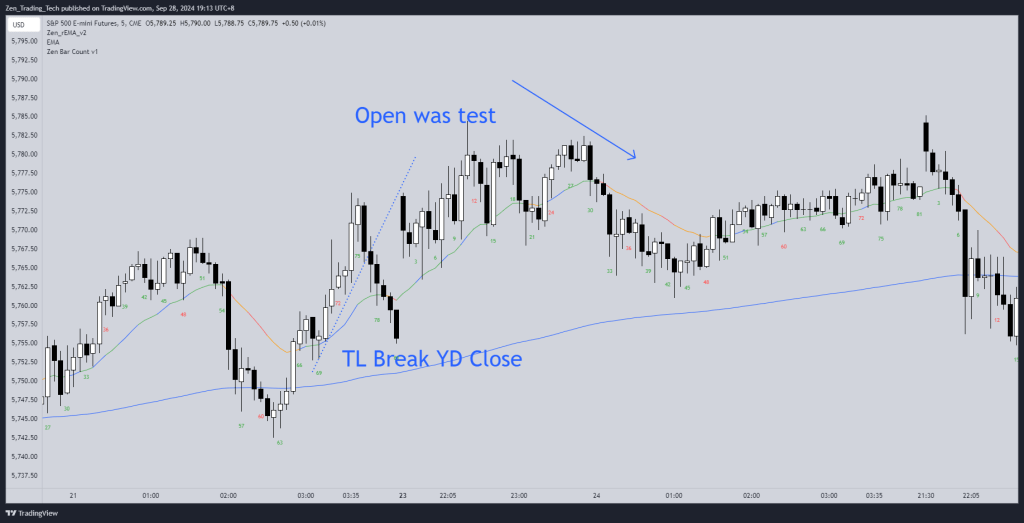
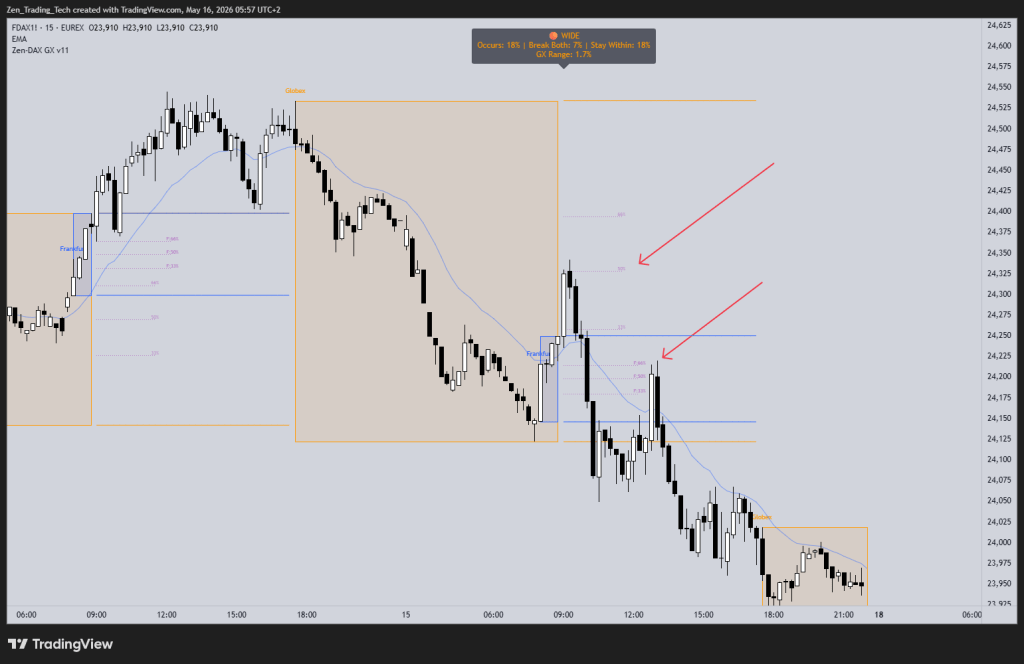
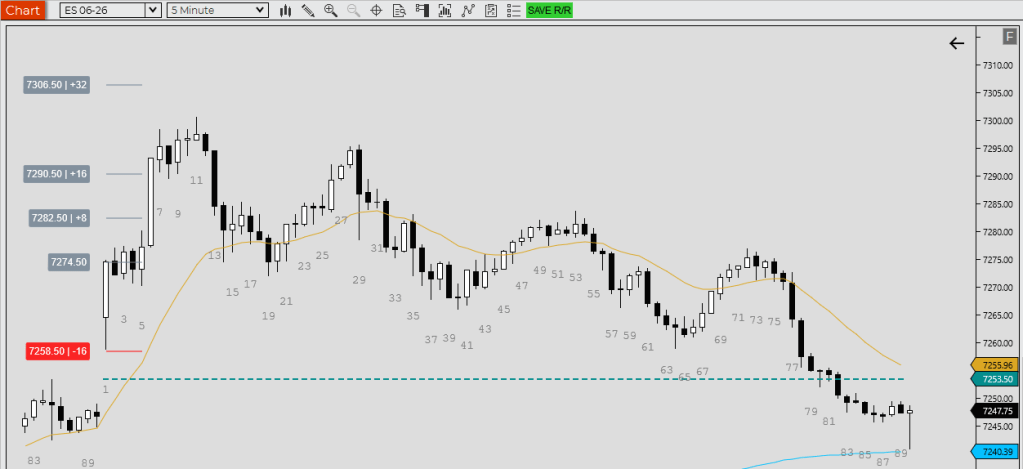
Drill 3: Trendline Break on the Open
Instructions
- Go and review 20 opens with gaps and see how common this pattern appears
- Sometimes the break was YD close, other times it is a new break on the open
- How could you use it in your trading?
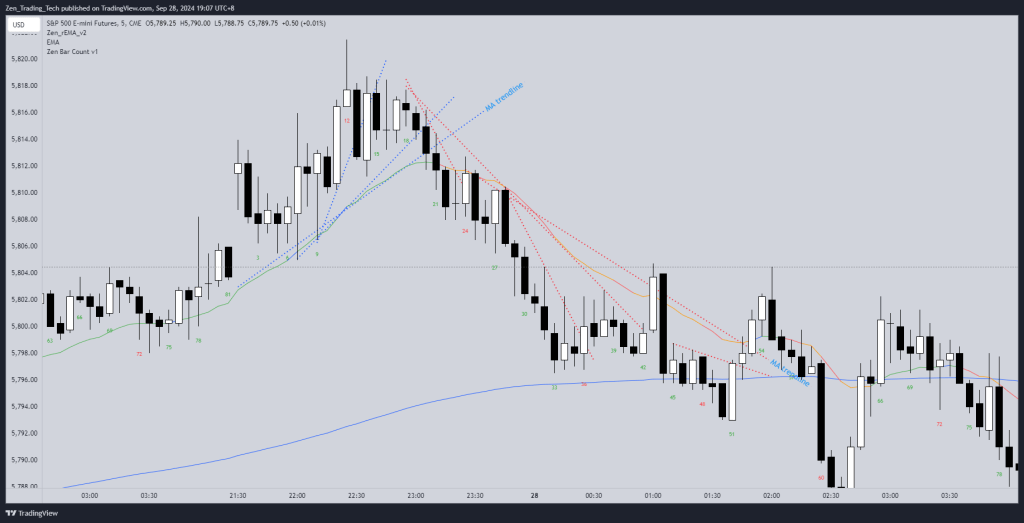
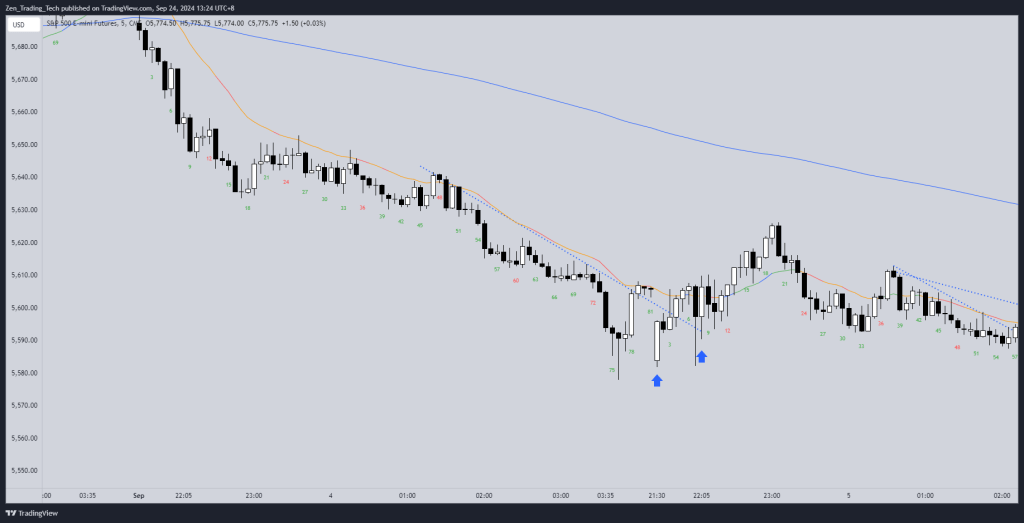
Drill 4: Moving Average Break
Instructions
- Here a break / cross of the moving average which doesn’t come back – often comes back later.
- Sometimes the next day on the open
Conclusion
- This is a really great drill to avoid losses taken at the end of a move and position yourself flat ready to trade the new direction


Leave a comment