Video
I made a video here:
- Video
- Indicator
- Spikes
- 1. Mark Up 3 Consecutive Bars
- 2. How Often do they have 2nd legs?
- 3. What happens at failure points?
- 4. The 3rd or 4th Spike Fail often
- More Examples
Indicator
Click here to find it
Spikes
3 CSC bars indicator
- First train 3
- Then practice 2
- Then look for one big bar
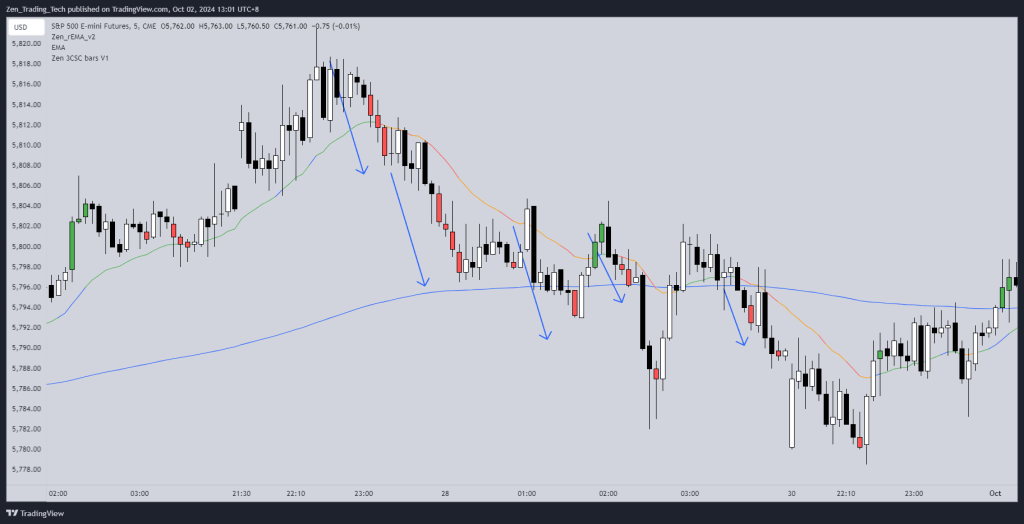
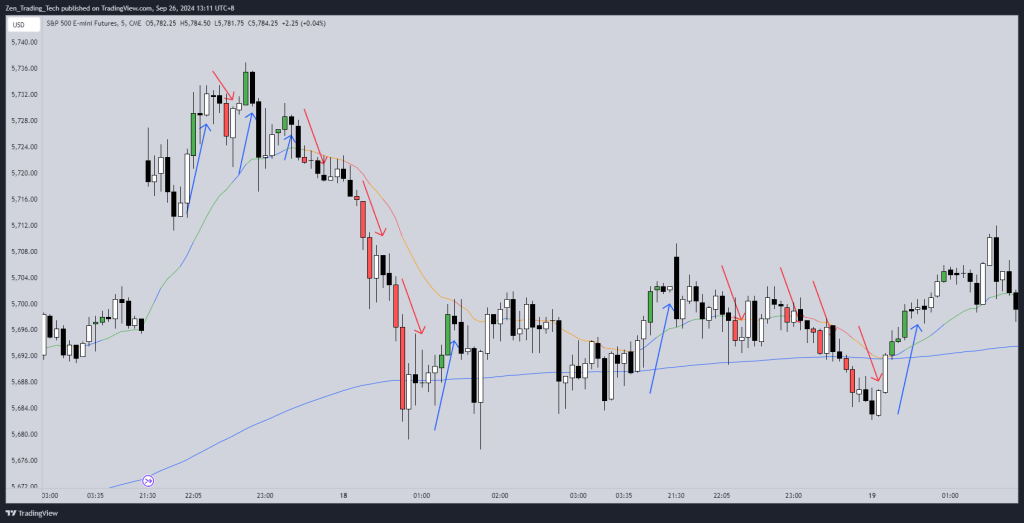
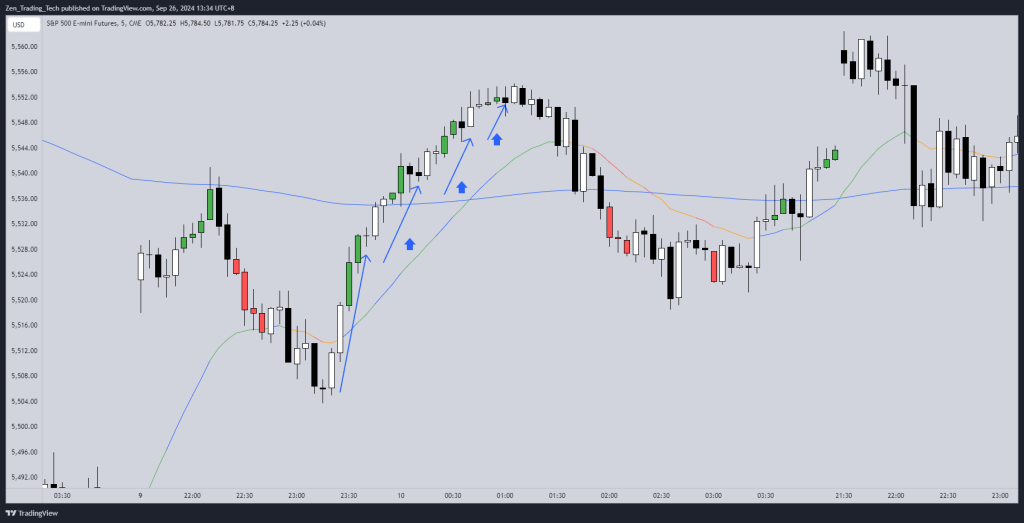
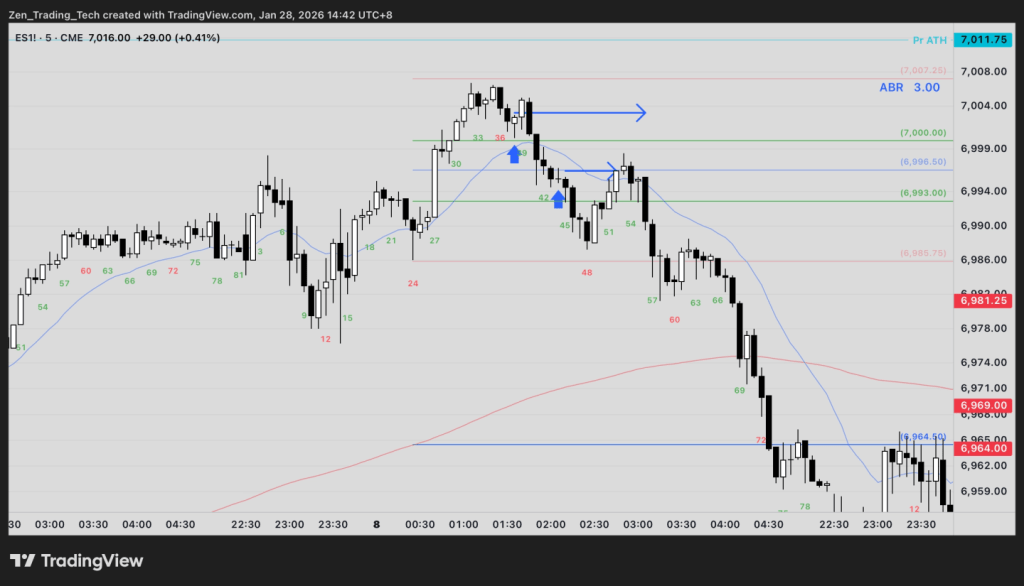
1. Mark Up 3 Consecutive Bars
- Use the indicator or draw arrows for all
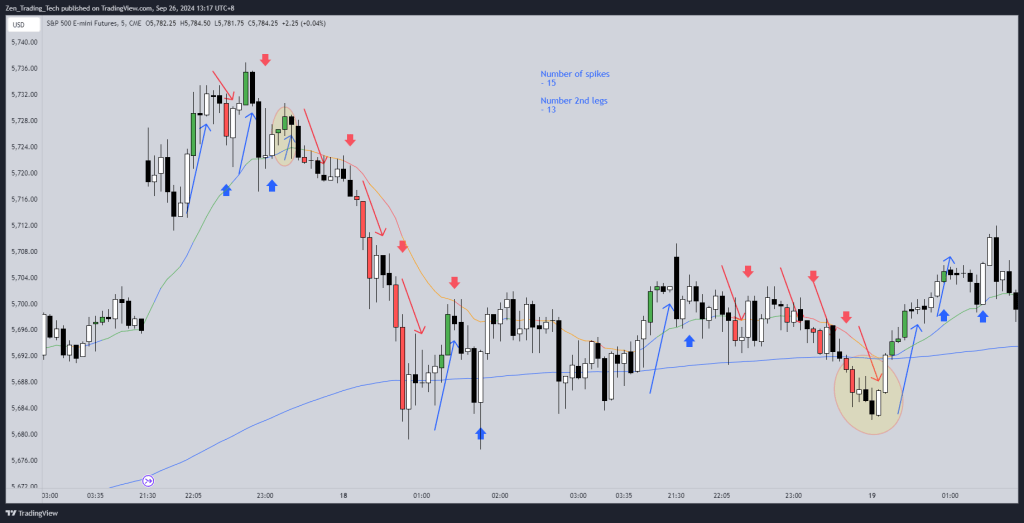
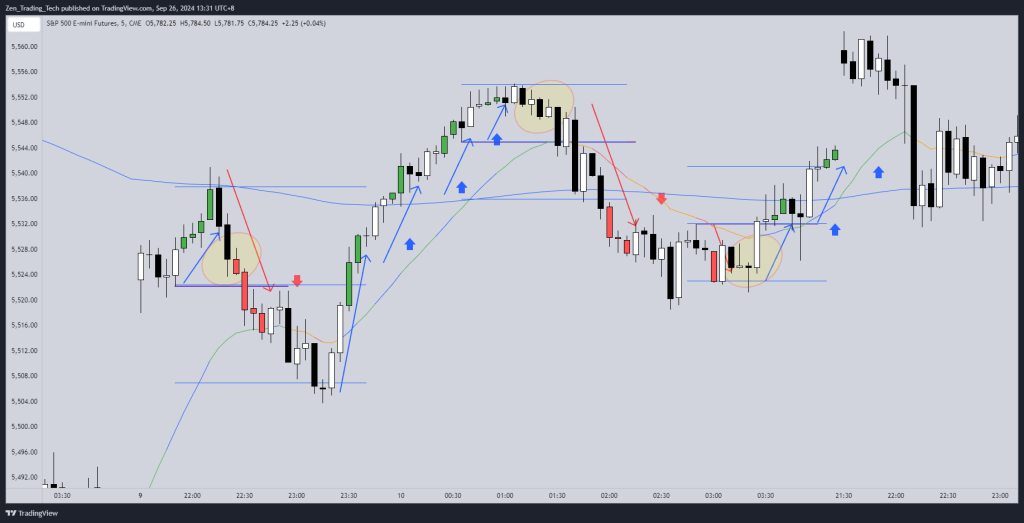
2. How Often do they have 2nd legs?
- Mark up whether there was a 2nd leg of any shape – here I used a smaller arrow
- Where there was a failure put a circle
- 13 / 15 is crazy high hit rate!
So now you can see how good important it is to trade in the direction of the spike
The follow on advice is then NOT to scale in if the other side HAS A SPIKE!
I will immediately exit, get back to flat and look to trade in the new spike direction.
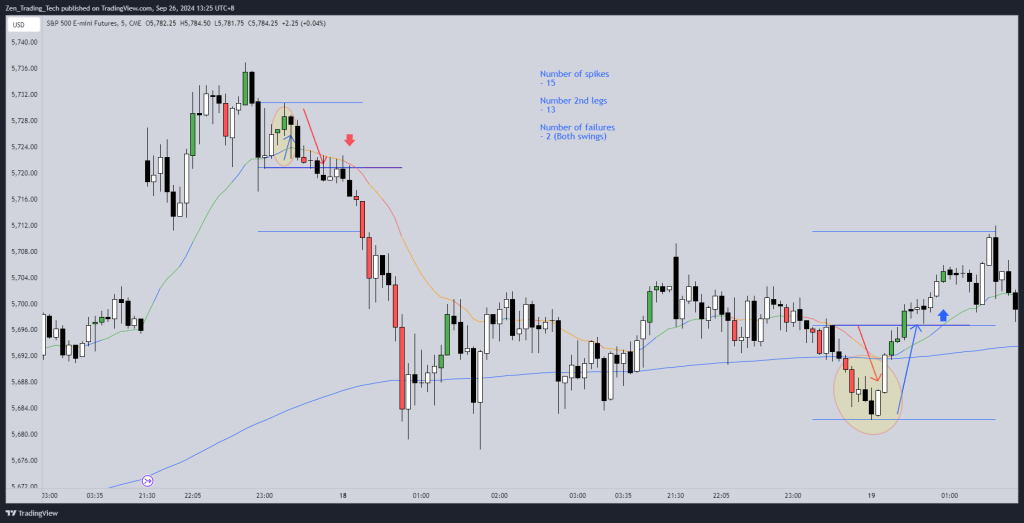
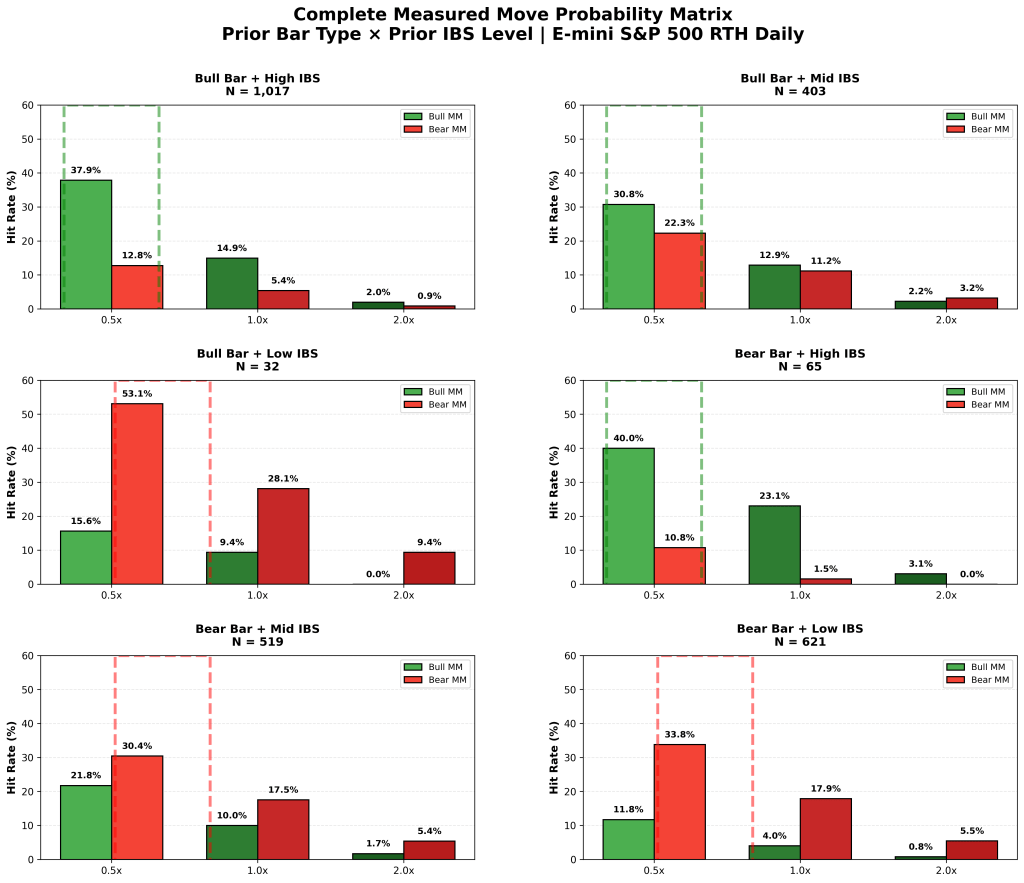
3. What happens at failure points?
- Notice how when they fail they form inflection points for a new move
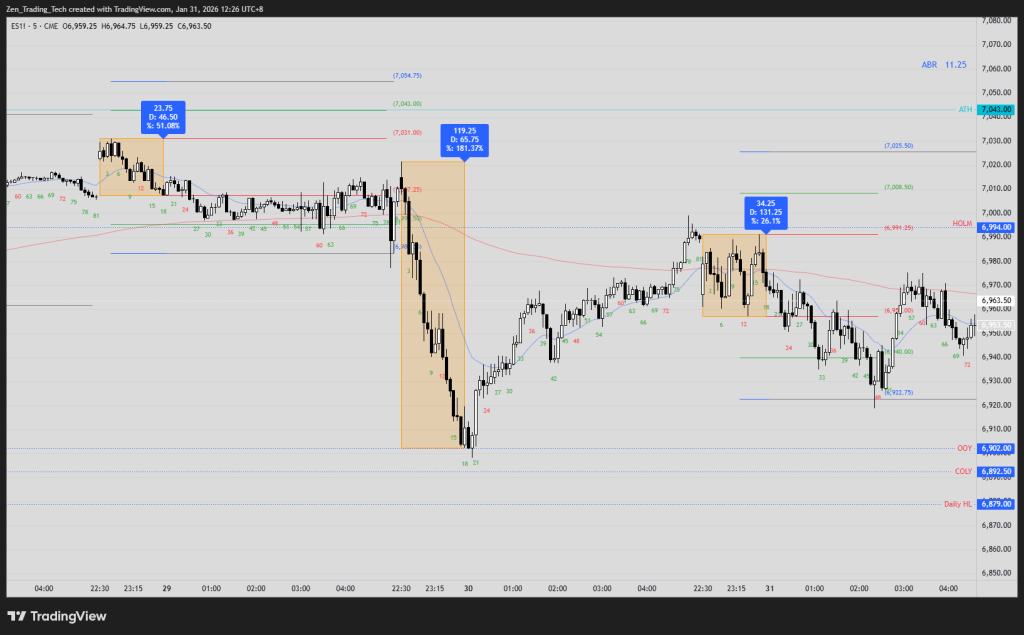
- Mark the HIGH or LOW of the Spike
- Put a measured move target there
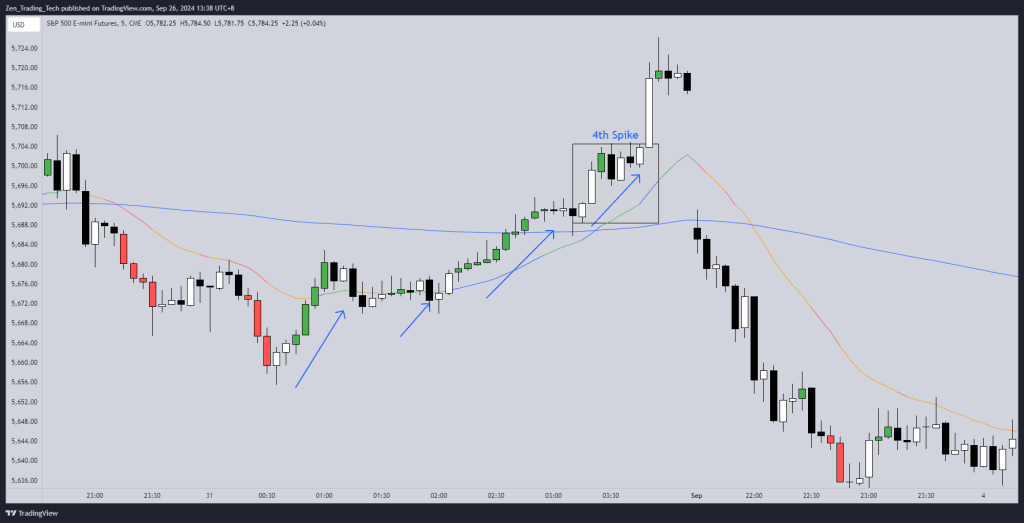
4. The 3rd or 4th Spike Fail often
- Notice how often the 3rd or 4th spike fails
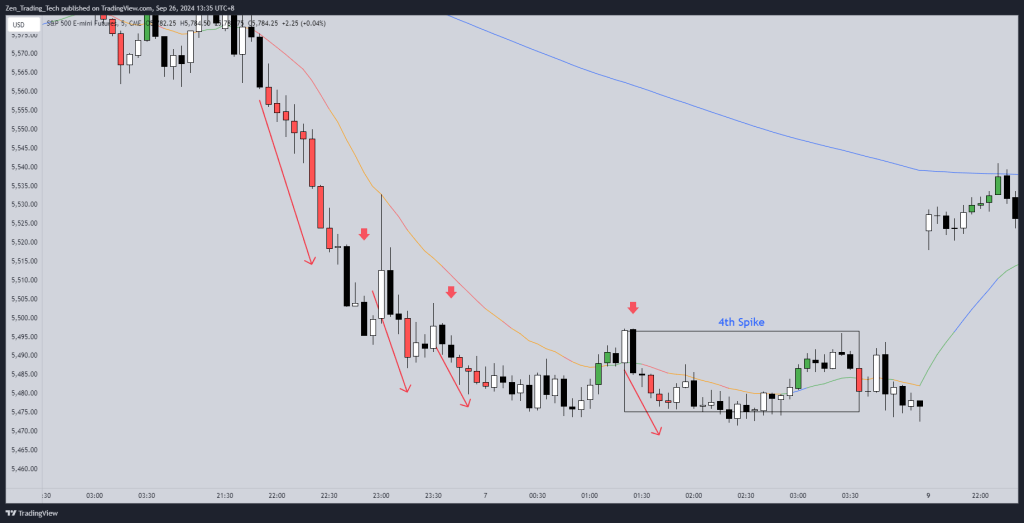
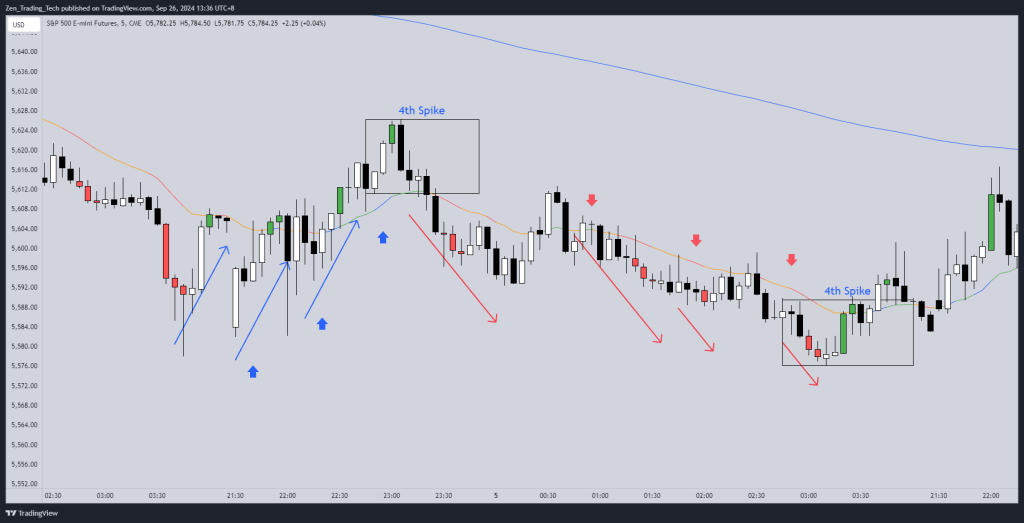
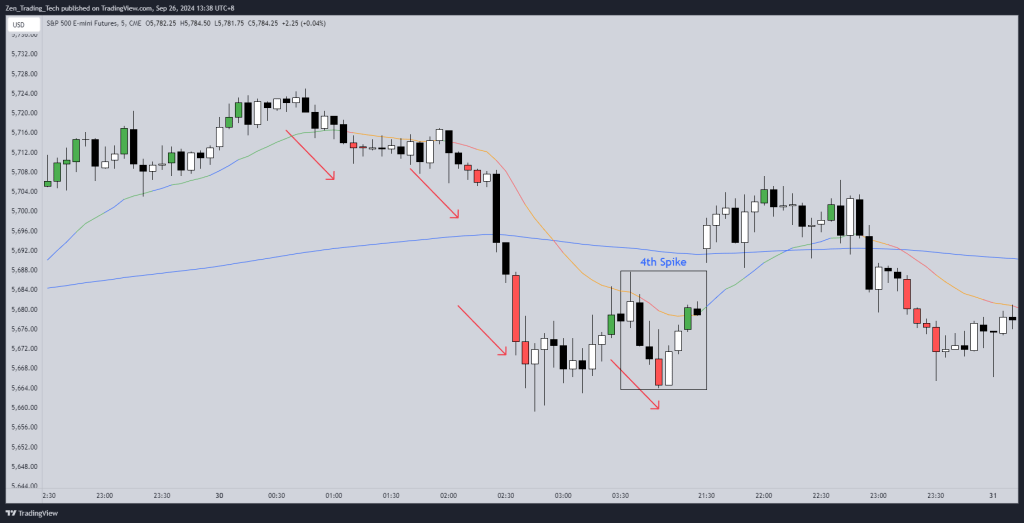
- Can work
More Examples


Leave a reply to Essential Trading Skills: Using Spikes and Stop-Order Entries – Zen Trading Tech Cancel reply