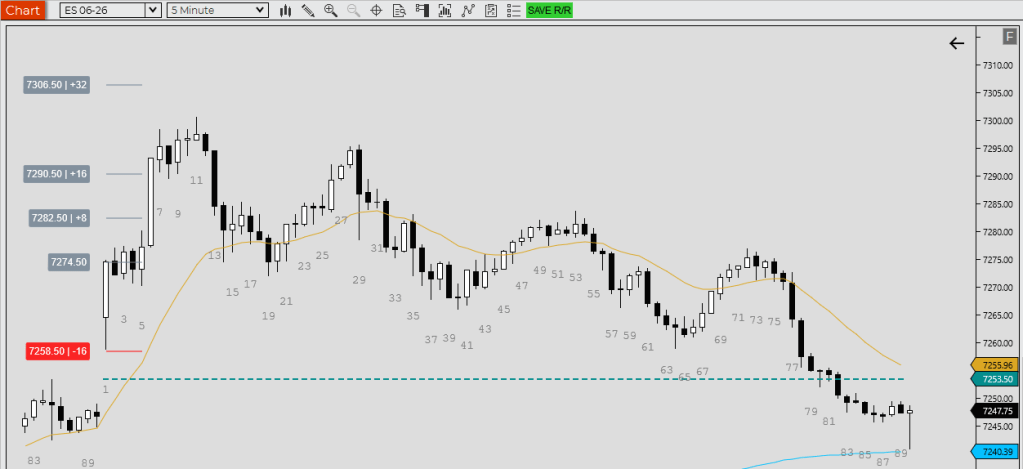
When you’re trading intraday, not all bars are created equal.
Some are narrow and quiet — a sign of hesitation.
Others are wide and explosive — often signalling strong conviction or emotional capitulation.
Being able to classify and study these different kinds of bars can give you a deeper understanding of market structure, volatility cycles, and the context behind price action.
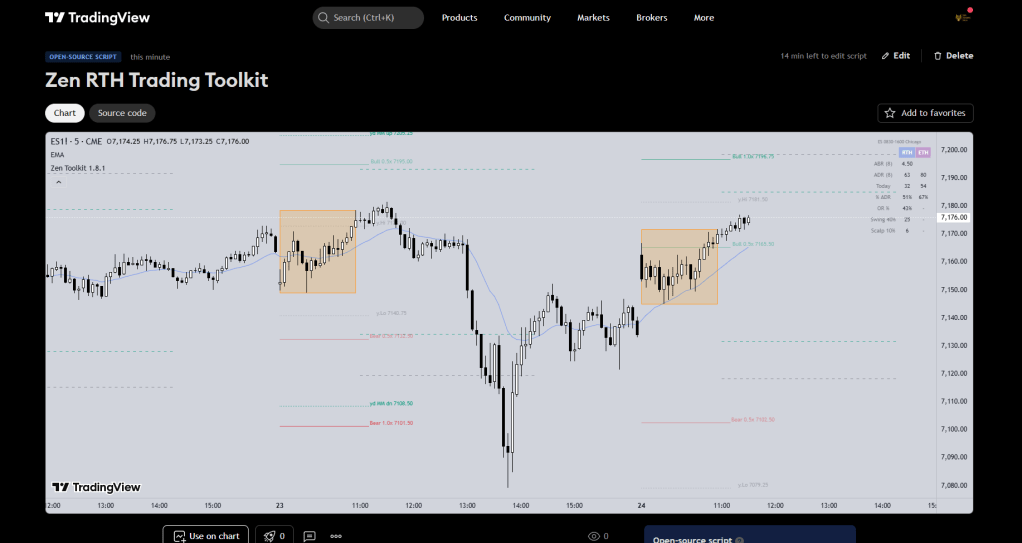
That’s why we built the Zen Bar Range Category v1 indicator.
🔍 What It Does

The tool measures the high-to-low range of each bar and compares it to a simple average of the last 8 bars (customisable). It then assigns each bar into one of four categories:
| Category | Range Compared to Avg | Default Color |
|---|---|---|
| Small | < 80% of average | 🟡 Yellow |
| Normal | ±20% of average | 🔴 Red |
| Large | 1.2×–2.2× average | 🔵 Blue |
| X-Large | > 2.2× average | 🟢 Lime Green |
These thresholds are adjustable, so you can fine-tune them to your market, timeframe, or strategy.
📊 How to Use It

- Study volatility expansion: When large and extra-large bars cluster, it often signals a breakout, news event, or capitulation phase.
- Spot compression: A run of small bars could mean a breakout is building.
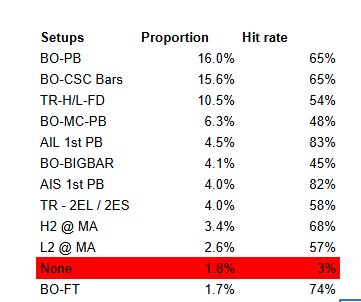
- Enhance strategy testing: Want to know how often a setup occurs during high-volatility bars vs. low-volatility ones? This tool gives you the count and the percentage breakdown at a glance.
- Refine entry timing: Avoid fading strong bars. Enter during pauses. Context is everything.
The visual table updates automatically, giving you a breakdown of how many bars fit into each category over a set lookback window (default: last 1000 bars).
⚙️ Fully Customizable
You can:
- Set your own average range lookback
- Adjust the thresholds for each category
- Turn each bar colour on or off individually
- Change the table’s colour scheme to suit your theme
The idea is to give you control, so you can make it your own research companion.
🧠 Designed for Research, Not Signals
This isn’t a signal generator. It won’t tell you when to buy or sell. But it will help you build an intuition for how bar size evolves, and how volatility behaves before, during, and after key moves.
If you’re building a discretionary or systematic approach, these kinds of tools are what help you go from guessing to understanding.


Leave a reply to Tim Fairweather Cancel reply