These are useful stats for day traders (Both scalp and swing traders.)
I built a database of charts for the past 5+ years of ES RTH 5 minute data as part of a broader research project.
But I have found they work on the other index futures instruments I trade.
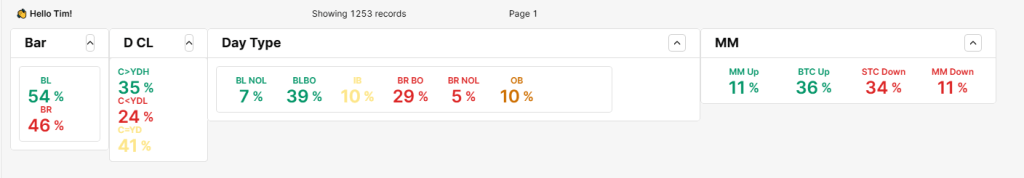
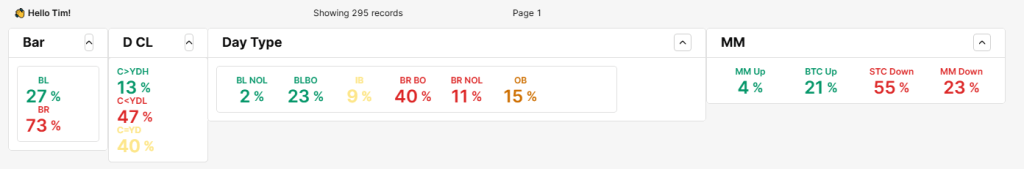
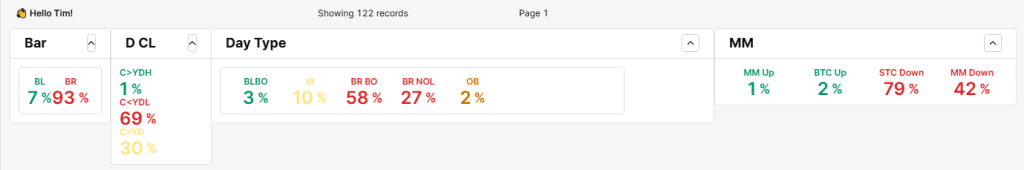
Legend:
- BL NOL (Bull No Overlap) = Bull day, todays LOW is ABOVE yesterday’s HIGH
- BR NOL (Bear No Overlap) = Bear day, today’s HIGH is BELOW yesterday’s LOW
- BTC / STC = Buy the close / Sell the close 1R
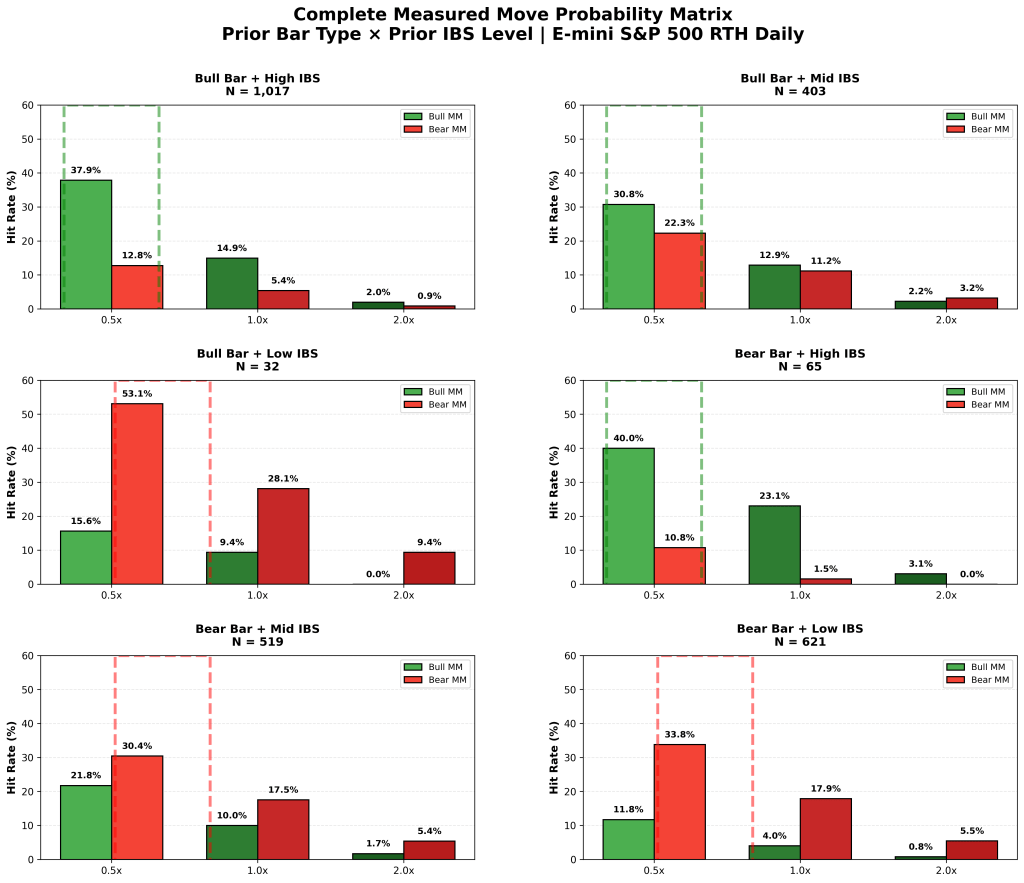
- MM Up/Down = Measured Move of YD range
- YDH/YDL = Yesterday’s High/Low
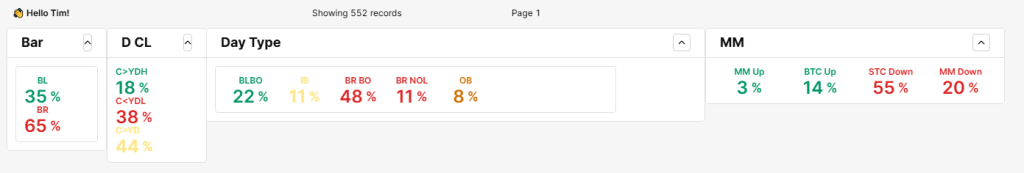
Overall Day Distribution
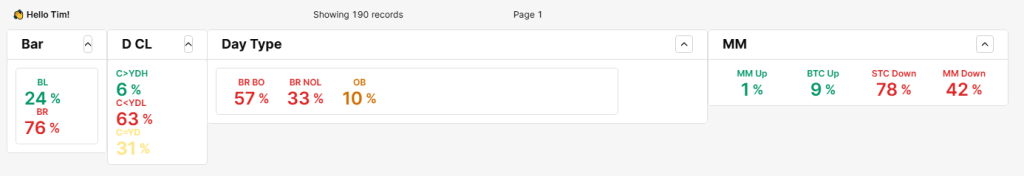
Gap Up – Open Above YD High
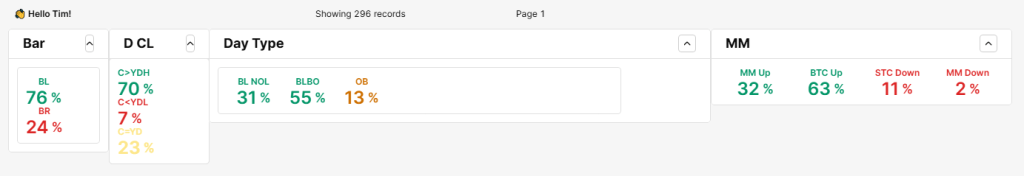
All Gap Up
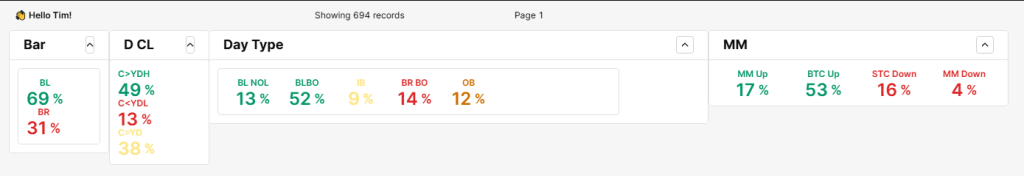
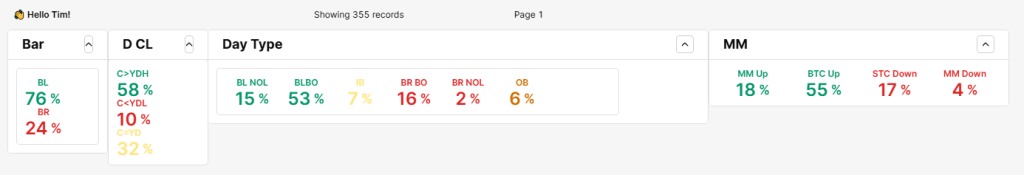
Open in YD Range
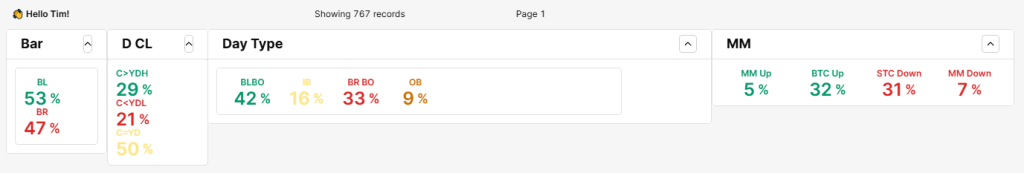
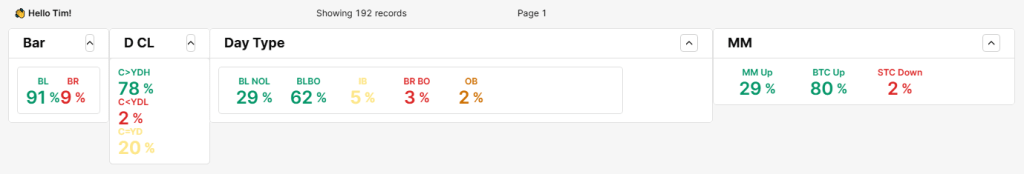
All Gap Down
Gap Down – Open Below YD Low
Consecutive 60m Bull Bars on Open
Gap Up + Consecutive 60m Bull Bars on Open
Consecutive 60m Bear Bars on Open
Gap Down + Consecutive 60m Bear Bars on Open


Leave a comment