Most of the time, when traders look at bars, the question is: “Is this a signal to get in?”
But there’s another way to use them. A relief bar is not a signal to enter — it’s a signal to exit.
Instead of thinking “BTC/STC” (buy the close / sell the close), relief bars shift the focus to XTC: Exit the close.
Instead of looking for buy stops above or sell stops below, you think in terms of XHL: Exit at the high or low.
You can also treat other chart features the same way — trendlines, measured moves, higher timeframe OHLC magnets.
How to Use Relief Bars
Relief bars are useful for:
- Finding support and resistance: they show where traders were forced out.
- Reading the environment: are we more likely in a trend, or a trading range?
- Understanding limit order traders: many of these exits are created by trapped limit order trades.
The beauty of this approach is that you don’t have to scale in or over-complicate. You can simply mark these exits and look for the next trade back to them.
Three Drills
Drill One: XTC — Exit the Close
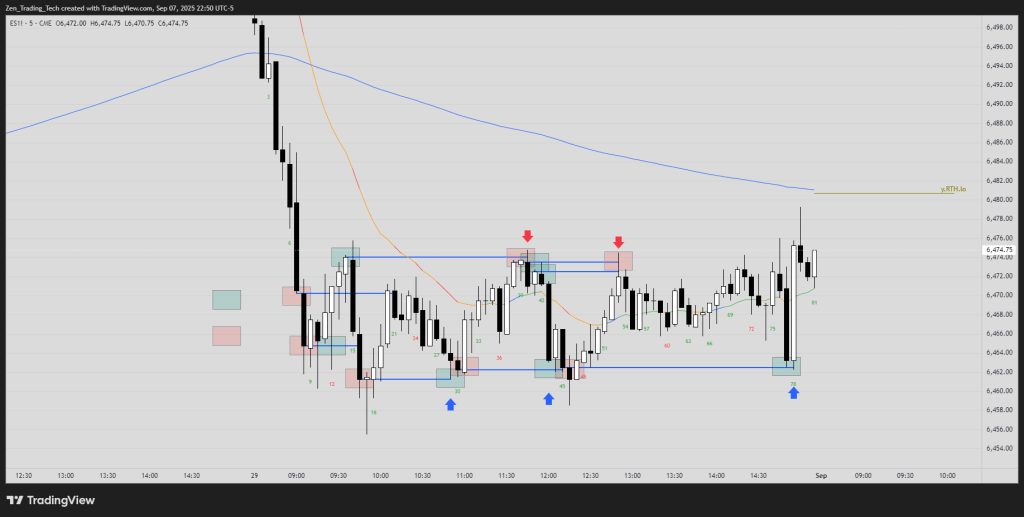
Pick a sideways day. Mark the closes of reasonable trades (good-looking entries). Now watch what happens:
- Did traders who entered there get trapped and need to exit?
- Did the market come back to let them out?
- If you were flat, was that exit actually a better place to take the other side?
This drill shows you how trading ranges often work. One trader’s entry becomes another trader’s exit.
Drill Two: XHL — Exit High/Low – FBO (Failed Breakout)
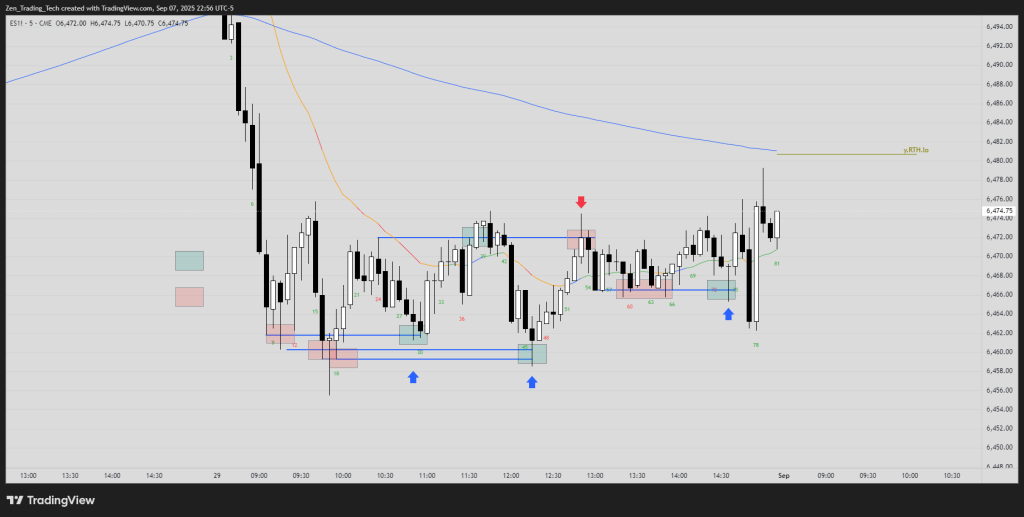
Mark obvious highs and lows where breakout traders would have entered. Extend those lines. Then ask:
- Did those breakouts fail?
- When the market came back, where did those traders exit?
Often you’ll see disappointed breakout traders getting out at breakeven. Those prices then become support or resistance for the next swing.
Drill Three: Trends
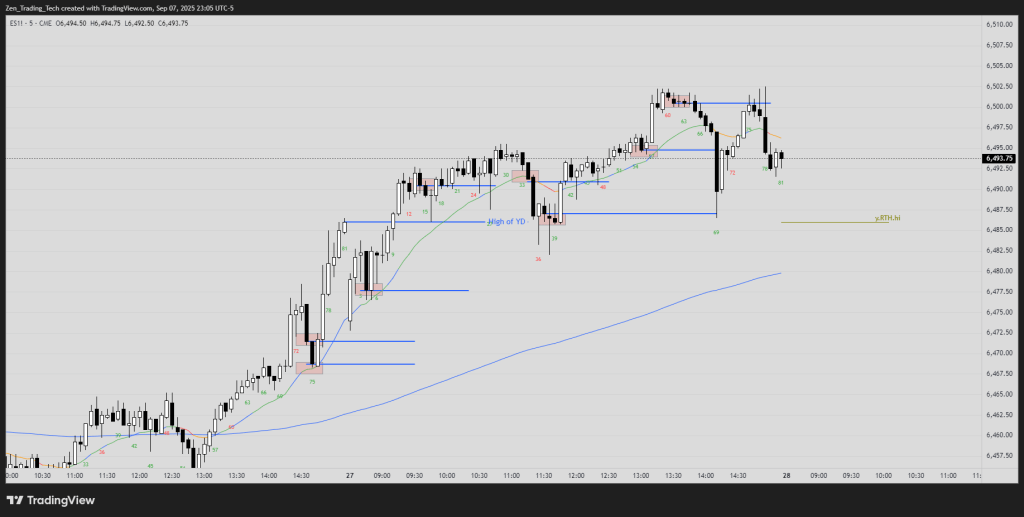
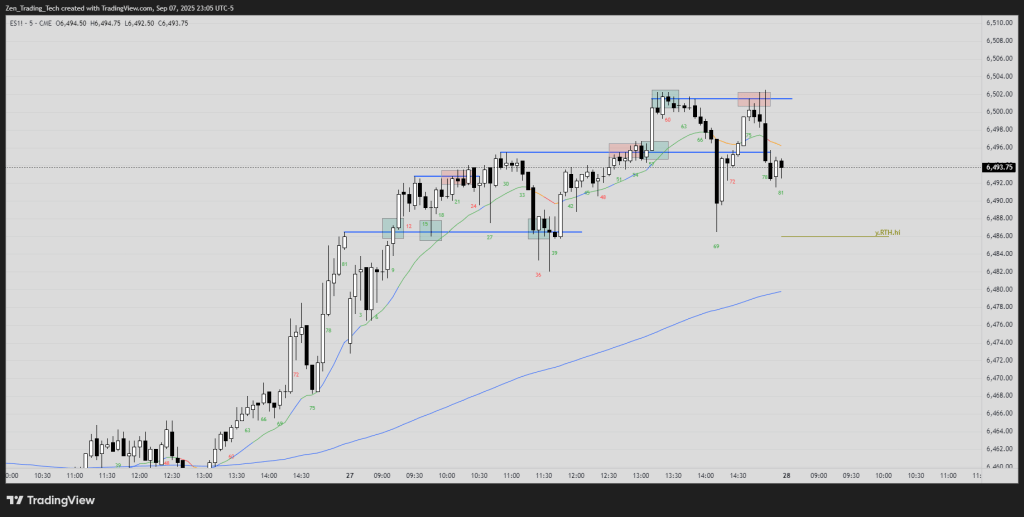
Now apply drills one and two on trending days. This is where the picture changes.
- In a trend, one side is making money while the other side can only break even (at best).
- That’s the definition of a trend: one side loses consistently, the other wins.
By marking relief bars in a trend, you’ll see when trapped traders never get rescued. That’s confirmation you’re in a trend. When they start getting rescued, the market is drifting back toward a trading range.
Why Practise These Drills
Relief bar drills teach you to see the market differently:
- Not just “Where do I enter?” but “Where are traders trapped, and where do they get out?”
- Not just trend vs range, but “Can the losing side exit? Or are they trapped?”
You can run these drills on TradingView replay, mark your charts, and build a habit of seeing these levels.
Final Thoughts
Relief bars aren’t about inventing new setups. They’re about training the eye to see what other traders are doing. Every entry is also an exit. By learning where traders get trapped and where they’re relieved, you start to understand the flow of support, resistance, and the shift between ranges and trends.
The three drills —
- XTC: Exit the Close
- XHL: Exit High/Low
- Trends: When trapped traders stop getting rescued
— will give you a framework for seeing the chart in a fresh way.


Leave a comment