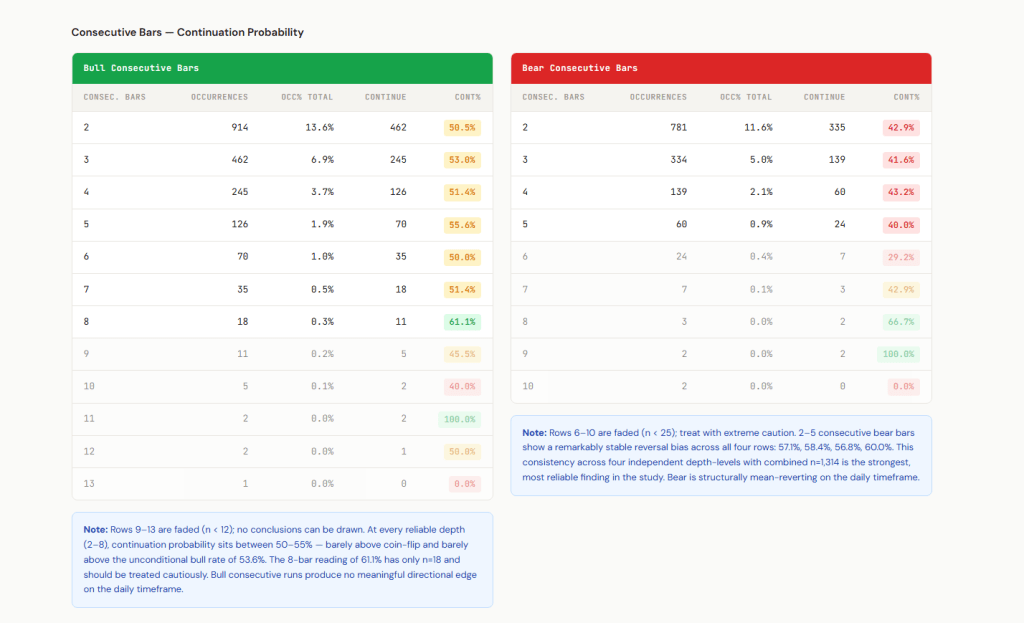
Most of the indicators on my charts used to be separate.
One for ABR measured moves. One for the 18-bar opening range. Another for ADR. Three clicks every morning just to see the numbers I actually use to size trades and plan targets.
So I merged them. The Zen Trading Toolkit v1.8.1 is three research modules in one indicator. Every feature toggles independently, so you can run the lot or just one — whatever fits the session.
It’s free. Grab the source on GitHub: github.com/Zen-Tim/zen-trading-tech-public. Paste it into the TradingView Pine Editor and you’re off. Open source always so you can AI it all weekend if ya like!
What’s in the Toolkit
Three modules. Here’s what each one does and why I use it.
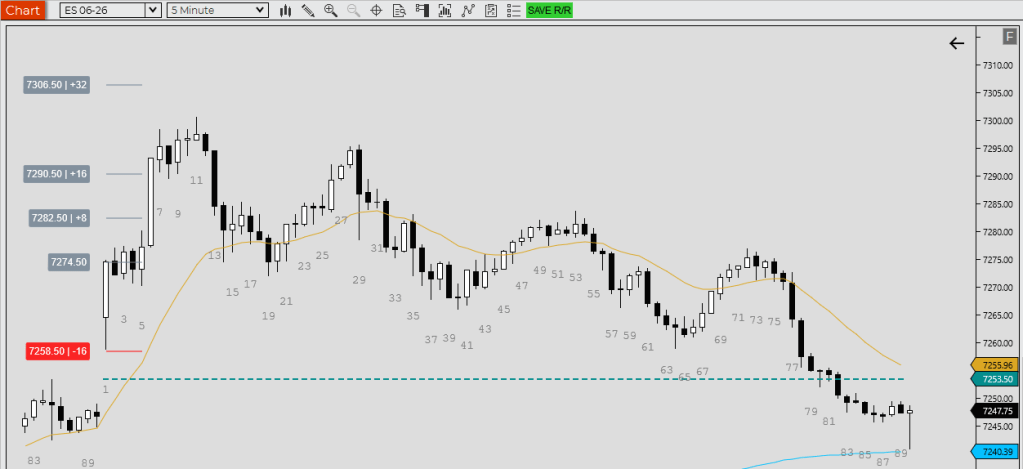
Module 1 — ABR Measured Moves
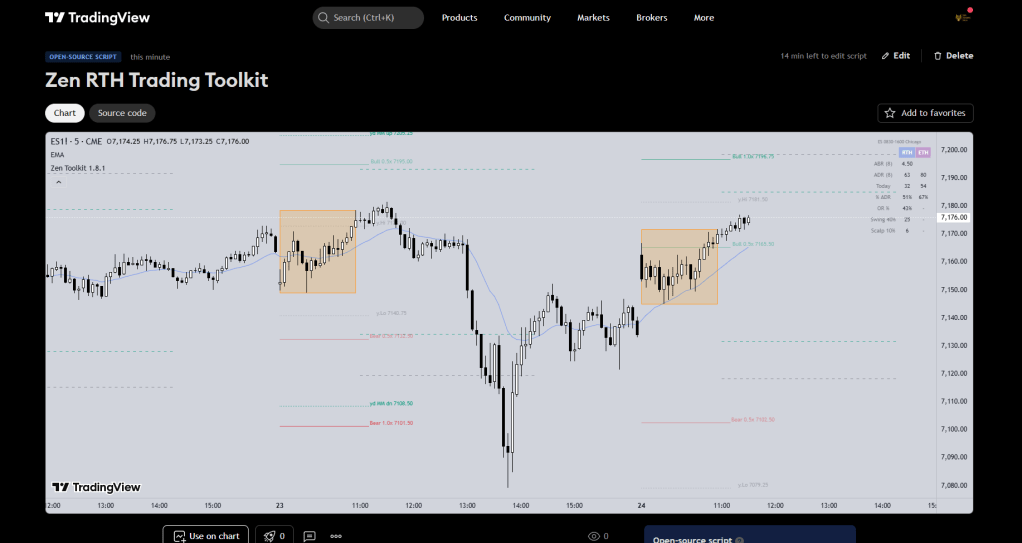
Projects 0.5x, 1x, 1.5x, and 2x ABR targets from yesterday’s RTH close. Also plots yesterday’s high/low and the original 1x measured move from yesterday’s range extremes (MM up / MM dn).
ABR is the average bar range over a rolling lookback (default 8 days). A 1x ABR move from yesterday’s close is a normal day. A 2x is rare. I keep the 0.5x and 1x on by default and flip the 1.5x / 2x on when I want to see swing targets.
[CHART: 5m ES chart with Bull/Bear 0.5x and 1.0x ABR lines drawn from y.Close, plus y.Hi/y.Lo and MM up/MM dn]
Module 2 — Opening Range
Default 18 bars (90 minutes on a 5m chart). Draws the OR box and projects breakout targets — 0.25x, 0.5x, 0.75x, 1x, 1.5x, 2x of the range. Each projection toggles on and off independently.
I’ve written before about why the 18-bar range matters for ES swing trading. Short version: it’s a clean container for the first 90 minutes, and it projects useful breakout targets once the range locks. This module draws it, no fiddling.
[CHART: 5m ES with the 18-bar OR box, 0.5x and 1x projections drawn upward and downward]
Module 3 — Volatility Stats Table
This is the part I look at most. A small table in the corner of the chart showing:
- ABR (8) — chart-timeframe average bar range, 8-bar lookback
- ADR (8) — average daily range, RTH and ETH side by side
- Today — today’s range so far, RTH and ETH
- % ADR — how much of the average daily range has already been used. Turns red at 80% so I know the day is stretched
- OR % — 18-bar opening range as a percentage of RTH ADR. Blank until the OR locks at bar 18
- Swing — a swing target in points (default 40% of RTH ADR)
- Scalp — a scalp target in points (default 10% of RTH ADR)
The Swing and Scalp percentages are configurable. If 40% isn’t your swing number, change it. The table updates instantly.
[CHART: stats table in top-right showing ABR, ADR RTH/ETH, Today, % ADR, OR %, Swing 40%, Scalp 10%]
One Dropdown, Four Instruments
The single feature I’m most pleased with: pick your instrument from a dropdown, the indicator sets the right RTH session and timezone automatically.
- ES — 0830-1600 America/Chicago
- FDAX — 0900-1730 Europe/Berlin
- HSI — 0915-1630 Asia/Hong_Kong
- Nikkei — 0845-1550 Asia/Tokyo
- Custom — set your own session and timezone
No more typing session strings. No more daylight savings mental gymnastics. Flip the dropdown, the indicator figures it out.
The Hidden Feature: Data Window Plots
This is the bit most traders miss. In v1.8 I added Data Window plots for every metric in the stats table — ABR, RTH ADR, ETH ADR, Today RTH, Today ETH, % ADR RTH, % ADR ETH, OR %, Swing, Scalp.
Why it matters: the values are always there, even if you turn the table off. TradingView’s Data Window (the little panel on the right) shows them all. Useful if you like a clean chart and want the numbers somewhere else. Useful if you’re exporting to a spreadsheet. Useful if you want to hover over a historical bar and see what the ABR was on that day.
[CHART: Data Window panel open showing all 10 metrics next to the chart]
Why Three Modules in One?
Simpler chart. Three indicators becomes one. Less to load, less to manage, one set of session settings to keep in sync across all three modules.
And every single thing in it toggles. If you only want the stats table, turn the MM lines and the OR box off. If you only want the OR, hide the table. Everything is a checkbox. I built it for myself, and I build it so I can pick what I want to see on any given day.
Get It
The Pine Script source is on my public GitHub:
github.com/Zen-Tim/zen-trading-tech-public/indicators/Zen-Trading-Toolkit
Open it, copy the code, paste into TradingView’s Pine Editor, save, and add to your chart. Pick your instrument in the settings and that’s it.
If you use another charting platform, the code is open-source — take it and adapt it, or feed it to an AI and ask it to port.
Does it replace the work? No. The indicator shows the numbers — the reads and the decisions are still yours. But it saves me five minutes every morning and keeps the chart clean, and that’s worth something.
Happy trading!
Tim
Zen Trading Tech


Leave a comment