- Intro
- The Research
- The Numbers
- What the Overnight Range Tells You
- Examples of how to trade it
- Indicator – Percentage Markers
- Get the Research Kit
Intro
In this post, I’m looking at strategies relating to a breakout of the pre-market on DAX the German Index Futures.
My intention for this post is to explain the research I did and give you access to all the materials for you to replicate the research.
There is a free GitHub repository with access to the materials that includes:
- the data I used
- the indicator I used to mark up that data
- the research process
- the reports
My hope is that this will inspire you to do trading research to inform your trading strategies.
The Research
I wanted to know how often Xetra actually breaks the pre-market ranges and whether there was some kind of trading edge I could exploit.
Firstly there are TWO pre-market ranges, because there are 3 ‘possible boundaries’ for the session – overnight, Frankfurt pre-market and Xetra.
And I found something surprising.
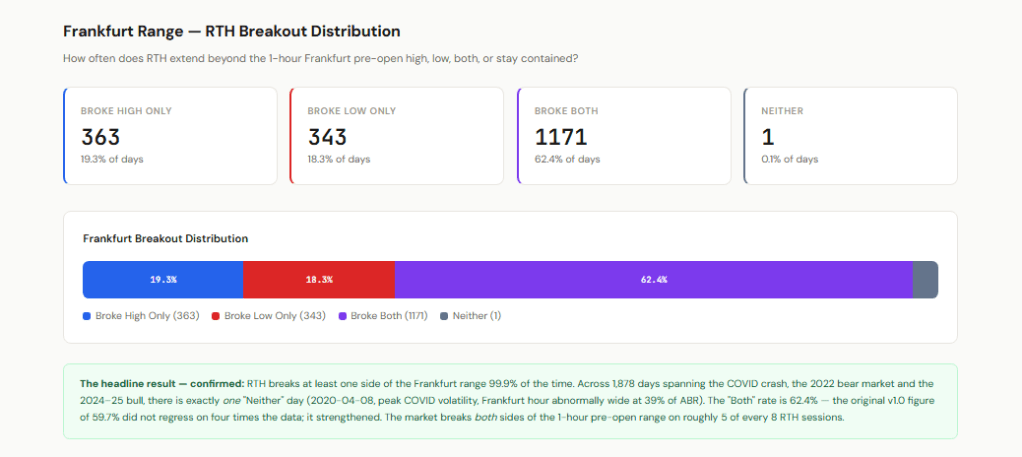
There is high probabilty we breakout of both sides of the frankfurt range – interesting right!
I ran a study on 1,878 trading days of FDAX data from December 2018 to May 2026. See the GITHUB link for how to do it and the data.
I first tried to do it manually which sucked.
Then I wrote an indicator to automatically record it.
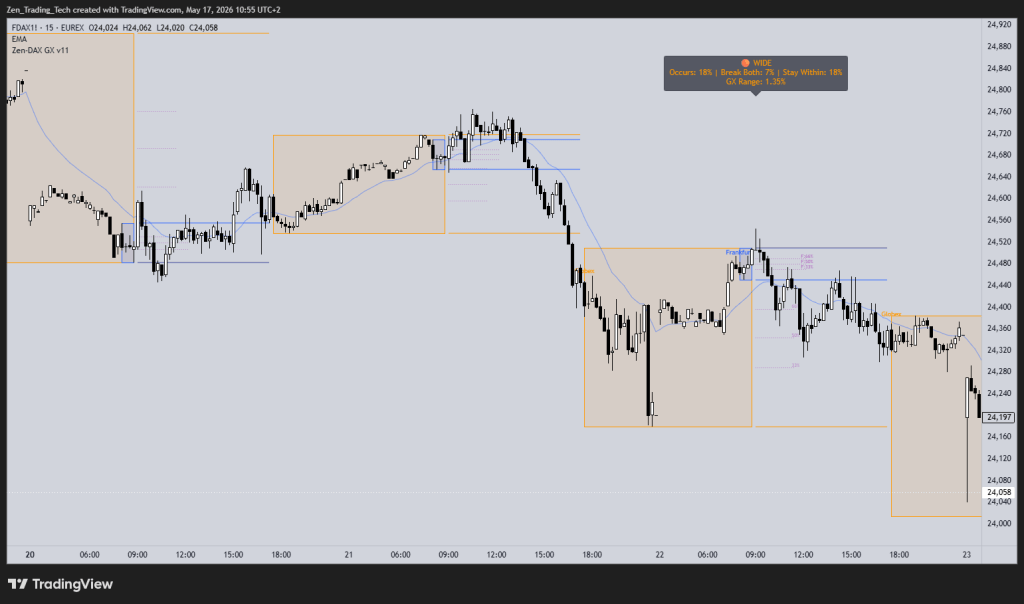
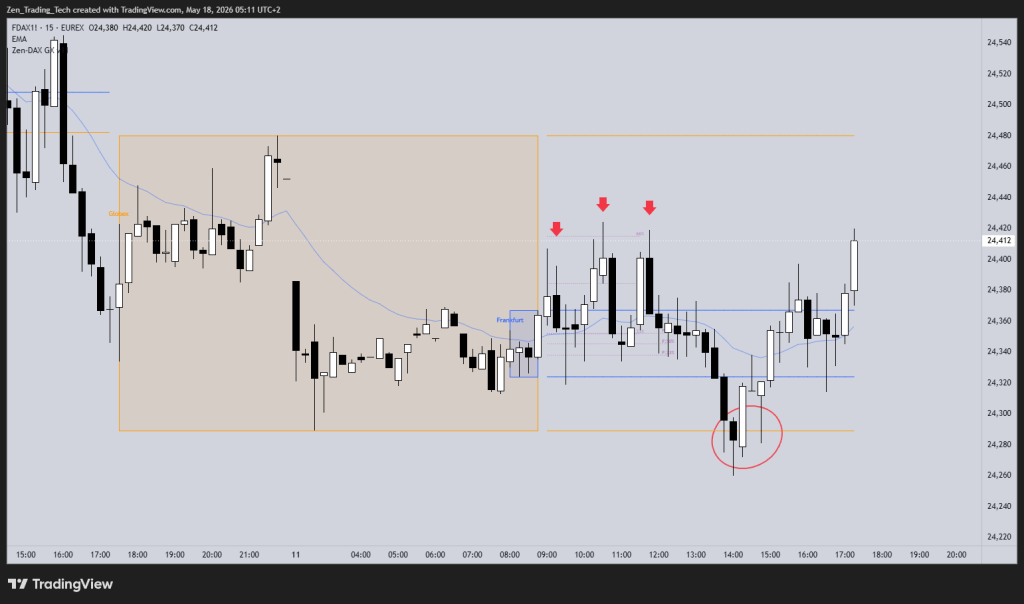
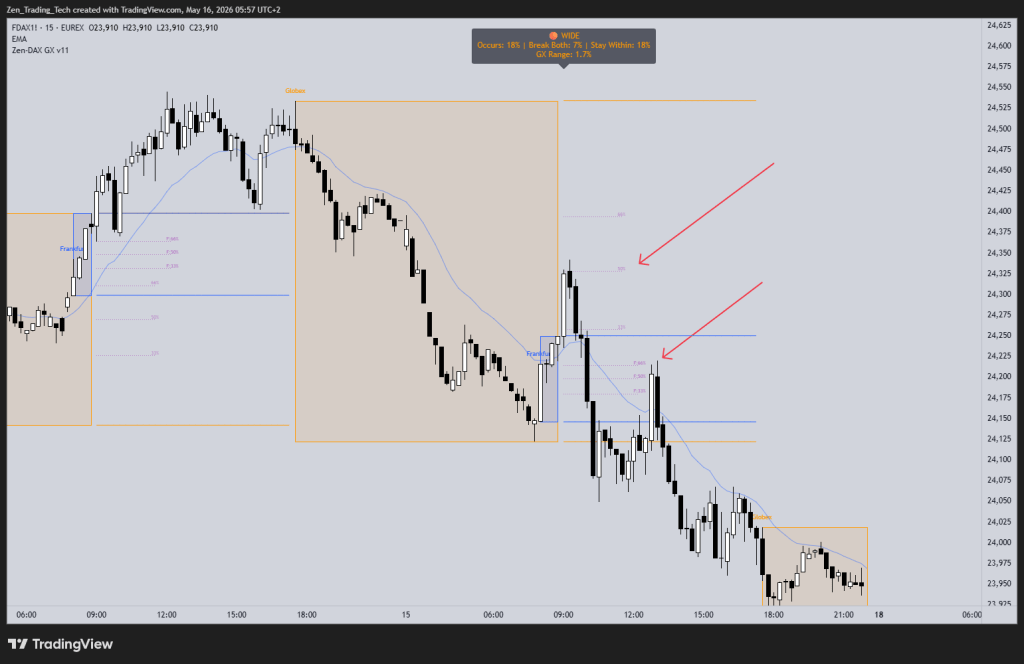
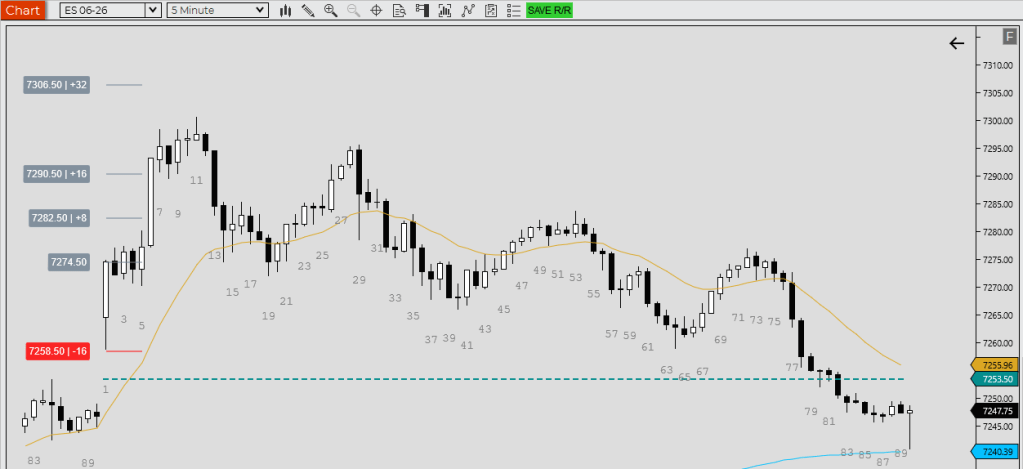
The Zen-DAX GX indicator draws those boxes on the chart and exports the session data to CSV. That’s what you can see in the chart examples above — the orange box is the Globex range, the blue box is the Frankfurt hour.
This will help you idetify ways to trade it.
Then I got AI to help me cross-check it against daily data for the same period.
I recorded the Globex overnight range (the full session from the prior Xetra close through to the 09:00 open), the Frankfurt pre-market range (the final hour, 08:00–09:00), and then checked what Xetra did.
- What was the relationship between the highs and lows and the ranges?
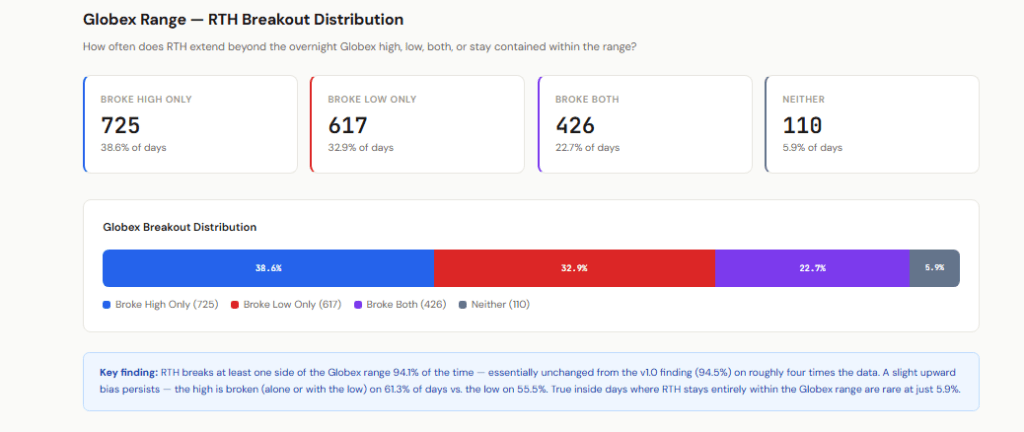
- Would it be like ES, which has a near 90% chance of breaking out of the Globex overnight range?
The Numbers
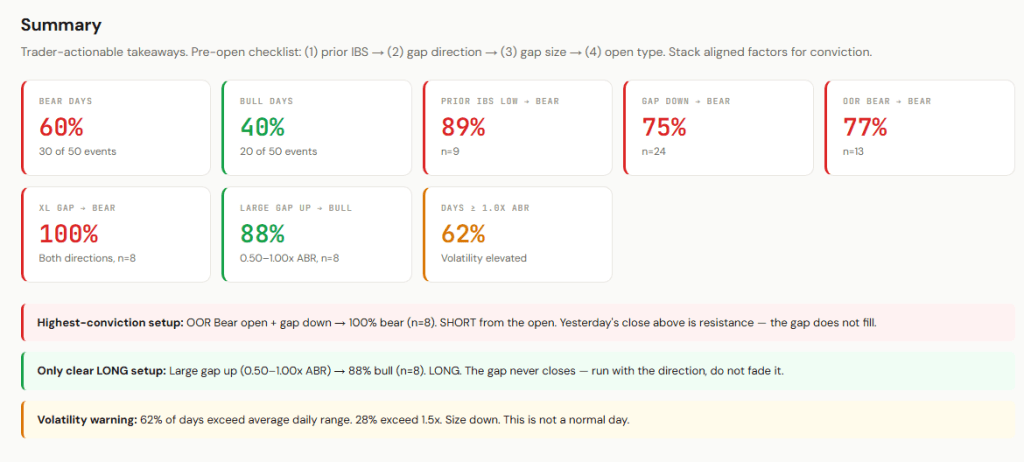
Xetra broke at least one side of the Globex overnight range on 94.1% of days. That’s 1,768 out of 1,878. Similar to ES.
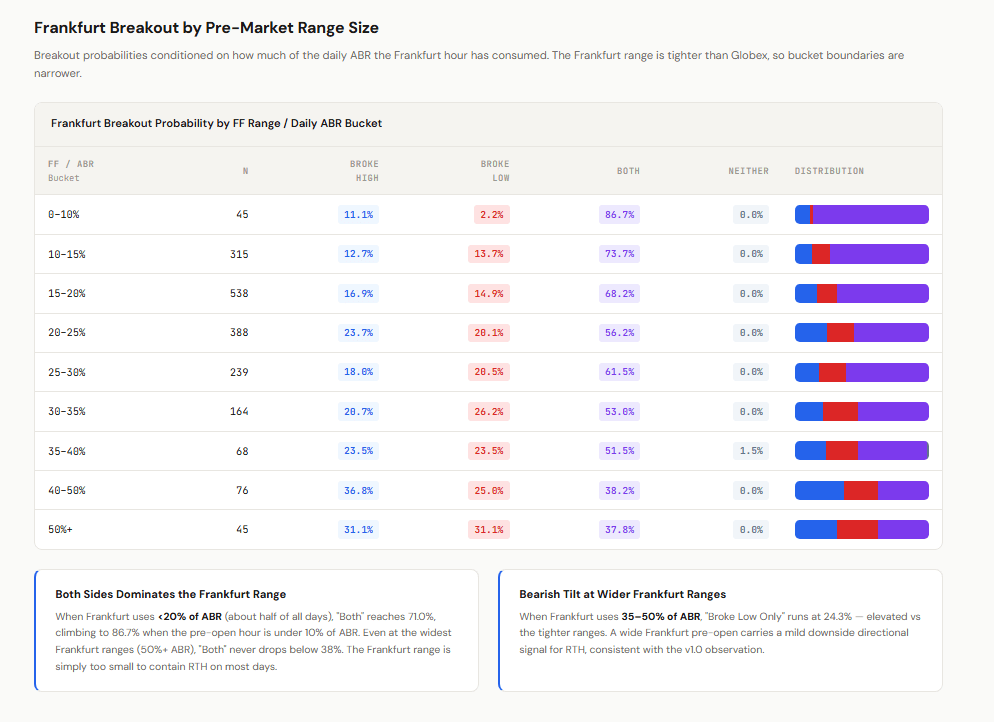
The Frankfurt number is more interesting. Xetra broke both sides of the Frankfurt pre-market range on 62.4% of days. Not just one — both. And when the Frankfurt hour was quiet (range under 10% of the average daily range), that went up to 87%.
I didn’t expect 62%. That’s the number that changed how I think about pre-market levels. They’re not ceilings and floors — they’re reference points that the market will visit from both sides.
What the Overnight Range Tells You
The overnight range size matters too.
Obviously if it’s bigger we would expect breakouts to become less frequent. Frankfurt is only one hour, so it has less room to build a large range — but what about the full overnight range?
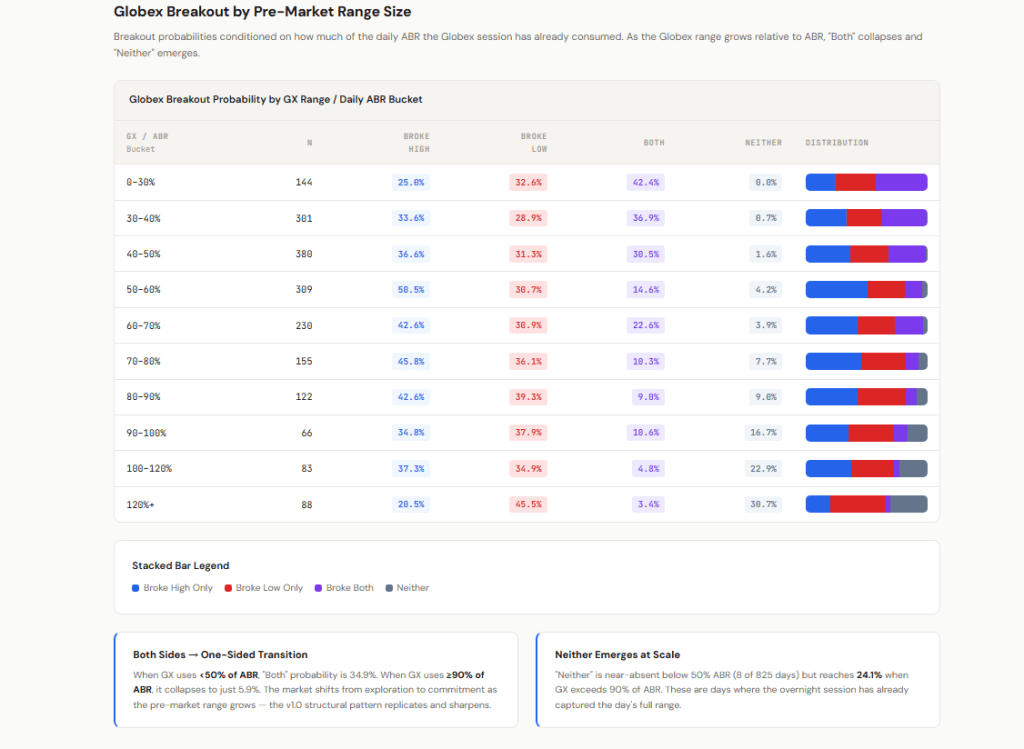
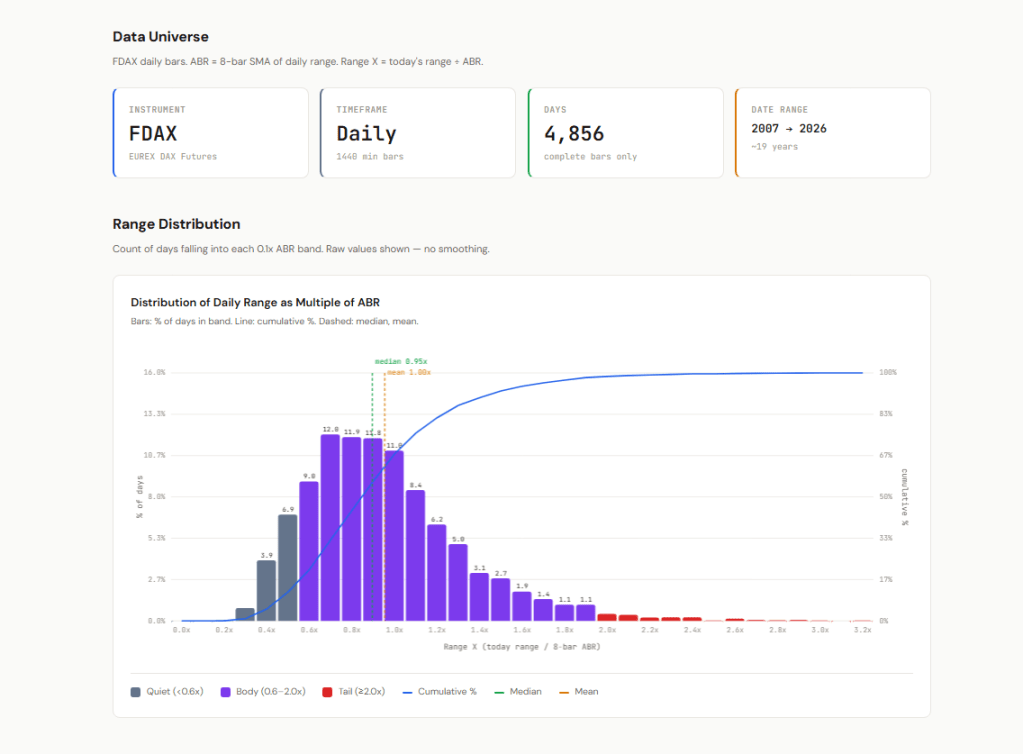
I bucketed days by the Globex range as a fraction of the 8-day average Xetra range (ABR). The pattern is consistent:
- Tight overnight range (under 30% of ABR): Xetra breaks both sides 42% of days. Plenty of room to move.
- Average overnight range (50–60% of ABR): Both drops to 15%. One directional move is more likely.
- Wide overnight range (over 120% of ABR): Both collapses to 3%. Neither rises to 31% — Xetra increasingly stays inside the overnight range entirely.
Examples of how to trade it
There are two main approaches. The first is to trade the breakout of the Globex range. The second is to trade the breakout of the Frankfurt range, or the other side of it once the first breakout has already happened.
Breakout of the Globex Range
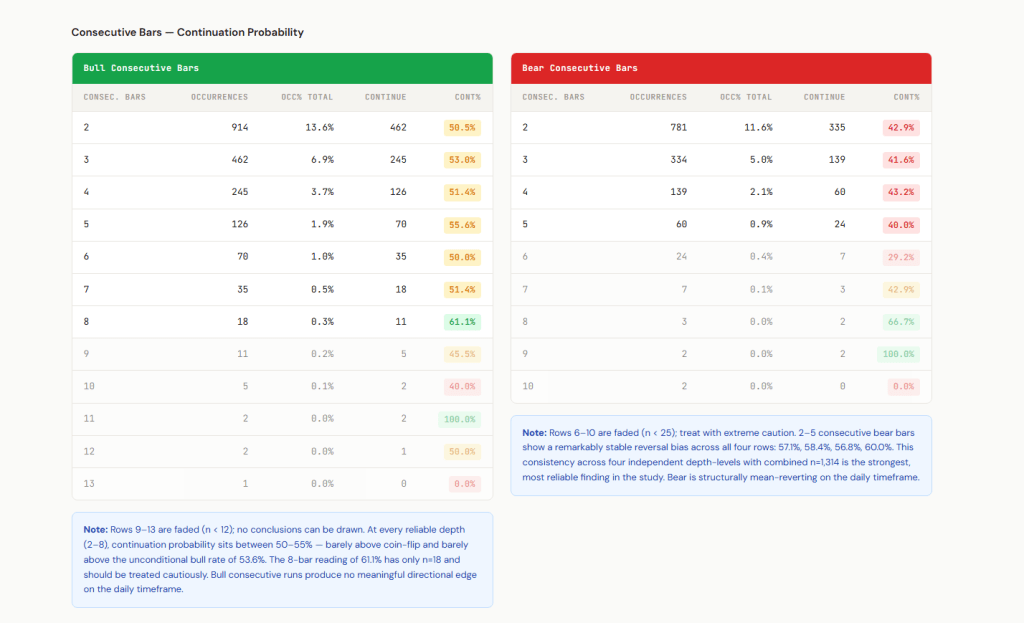
If the Globex range hasn’t been broken in the first few bars, you can use the probability table to assess the setup. The chart below shows what that looks like in practice:
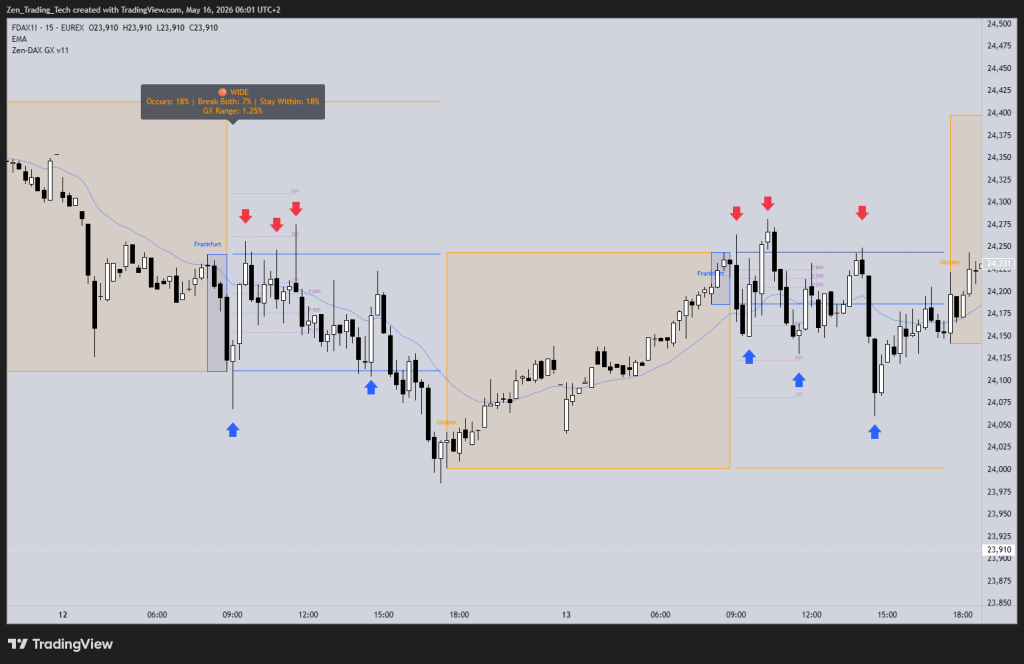
Breakout of the Frankfurt Range
The first breakout of the Frankfurt range almost always happens on the first bar of the RTH session, so in practice you’ll miss it. The open bar gaps or drives straight through the Frankfurt high or low before you can react.
But a break of the other side is still available — and that’s where the real opportunity is.
- Counter-trade to the other side of the range
- This was even better (although I wasn’t fast enough) because we had also not broken out of the Globex range
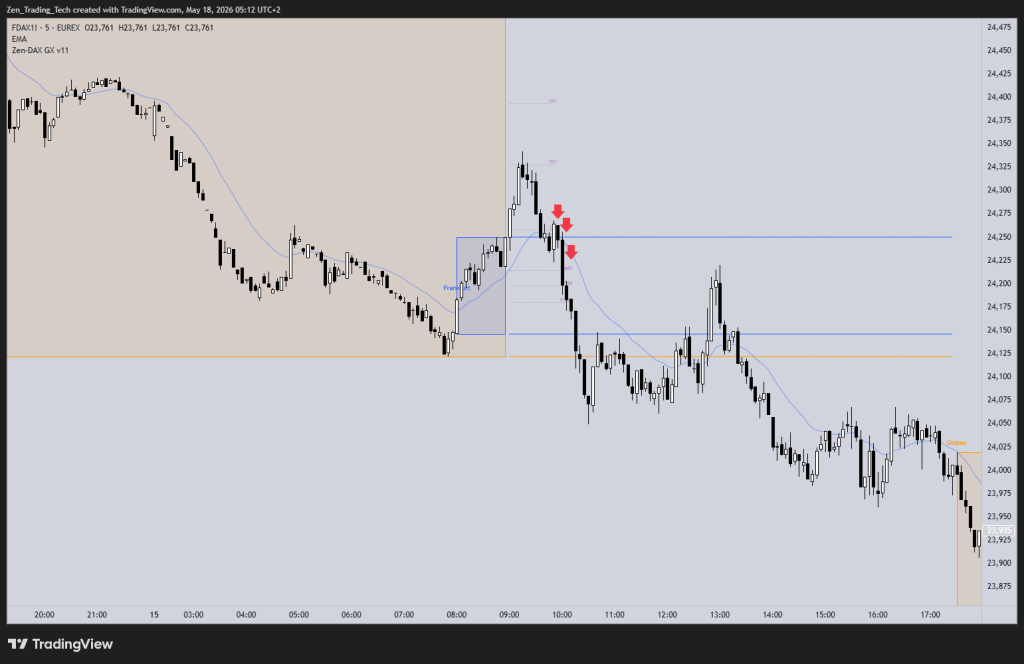
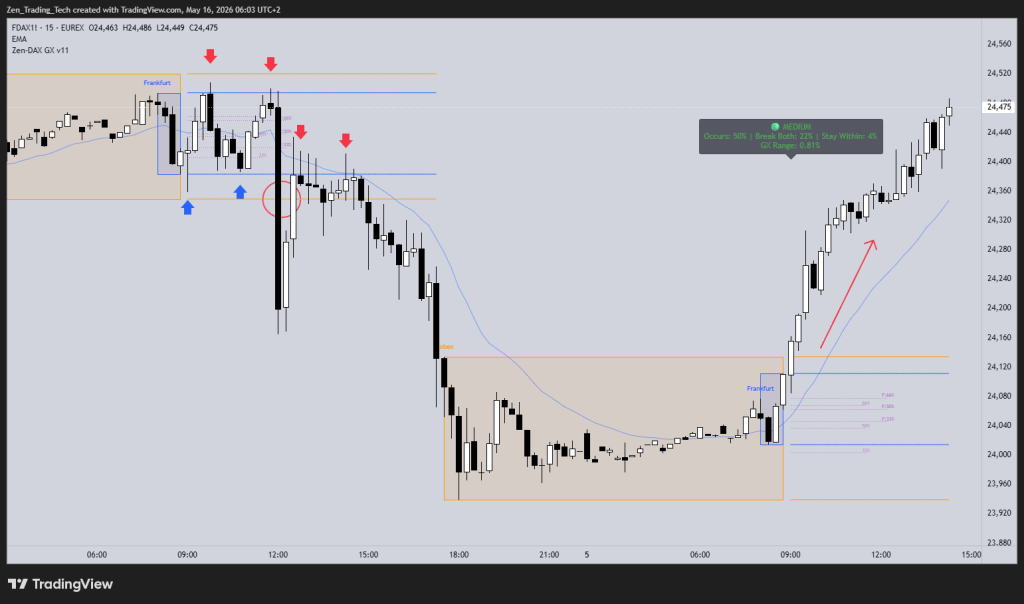
Indicator – Percentage Markers
- I added percentage markers to help with identifying swing trades
- In the example below, price pulled back exactly 50% of the Globex range — a great place to start scaling into shorts
- Price also pulled back 66% into the pre-market range for a secondary short trade
Trading range day — all the best entries and exits were at the pre-market levels.
Get the Research Kit
Everything I used to run this is on the public GitHub repo — data, indicator, report, and a ready-to-use AI prompt so you can run the same study on your own data or a different instrument.
FDAX Pre-Market Breakout Research Kit on GitHub
Happy trading!
Tim
Zen Trading Tech


Leave a comment