Here’s a question I couldn’t stop thinking about: after nine consecutive bull weeks on ES, is the tenth week more likely to continue or reverse?
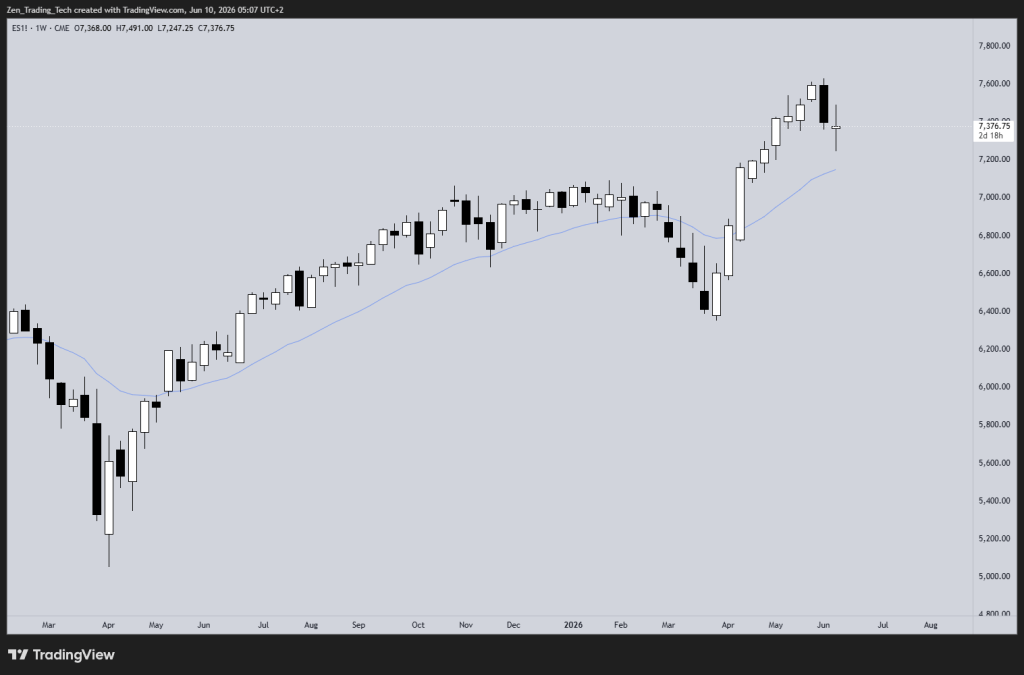
The answer is reverse, and it was high probability which you will find out below.
We were talking about it in the Brooks Price Action Trading Room live stream again last night, and Dr. Al Brooks mentioned it -> plug plug plug 🙂
I remembered I’d researched this in the past and thought it would be a good example to share so traders can start strengthening the muscle that takes an observation and turns it into research to inform and improve their trading.
So I built a free research kit — a Pine Script indicator, four ready-made CSV datasets, and the full analysis — that you can use to run this study yourself on any instrument and timeframe. The results on ES weekly data turned out to be more interesting than I expected. And the daily data tells a slightly different story. Let me show you what I found.
What’s in the Kit
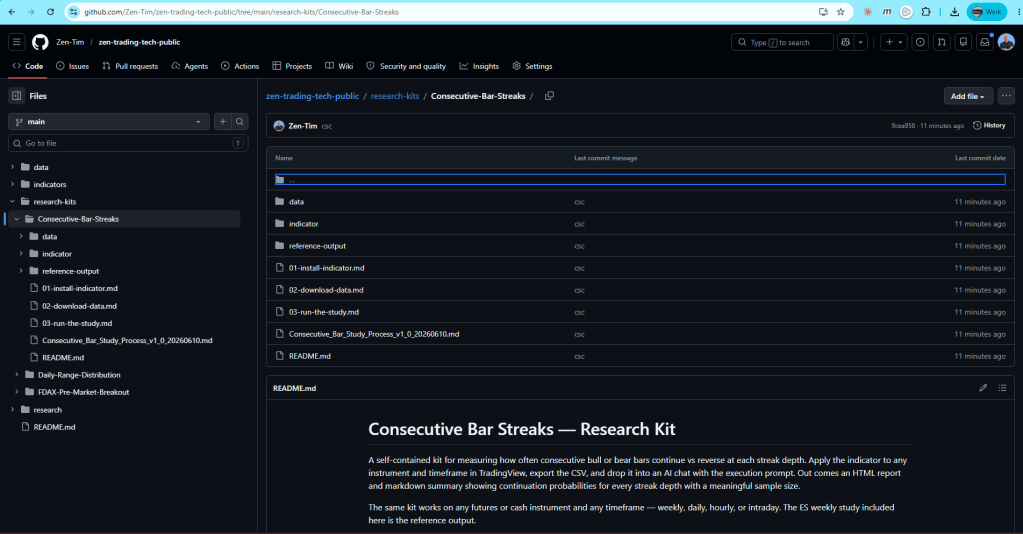
Everything is free on the Zen Trading Tech public GitHub repo under research-kits/Consecutive-Bar-Streaks/. Here’s what you’ll find:
- Zen Consecutive Bar Streak v1.0 — free Pine Script indicator for TradingView
- Four ready-made CSV exports — ES weekly (29 years), ES daily (26 years), ES hourly, and more
- Two complete research reports — ES Weekly and ES Daily with full tables and notes
- A process document — so you can run the same study on FDAX, NQ, HSI, or any instrument you trade
No subscription, no paywall. The whole thing is open.
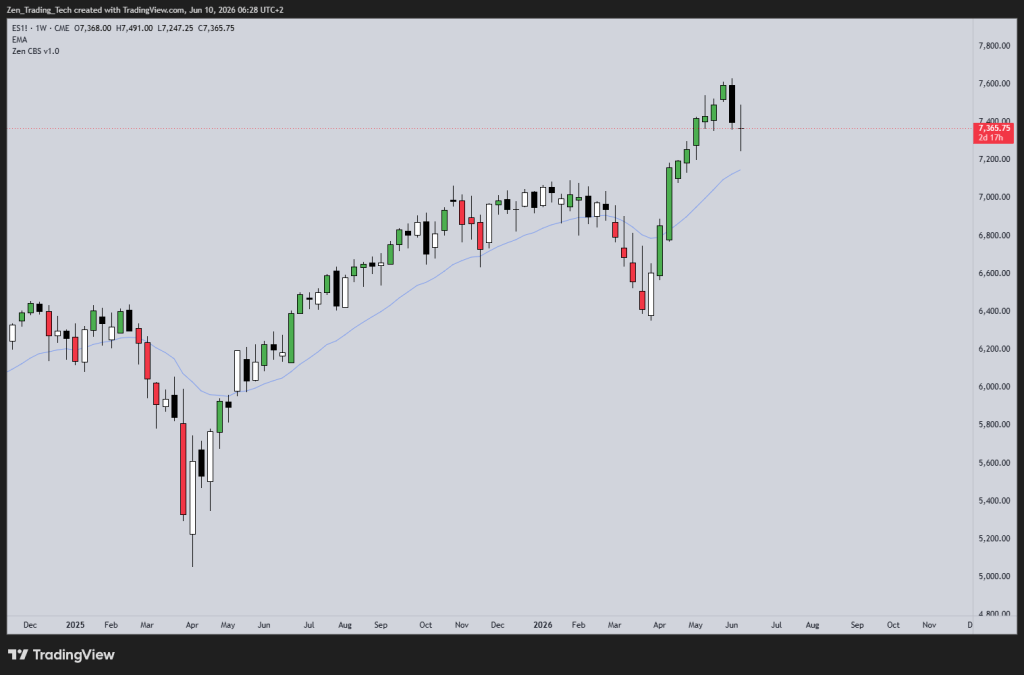
The Indicator: Zen Consecutive Bar Streak v1.0
The indicator does two things. First, it computes Bar Direction for each bar: +1 if close is above open (bull bar), -1 if close is below open (bear bar), 0 for doji. Second, it keeps a running Streak count — how many consecutive same-direction bars are currently in the run.
A streak of +3 means three consecutive bull bars. A streak of -4 means four consecutive bear bars. The count resets to 1 (or -1) on a direction change, and resets to 0 on a doji.
On the chart, it colour-codes bars green when the streak reaches +2 or higher, and red when it reaches -2 or lower. So you can see at a glance when a run is underway.
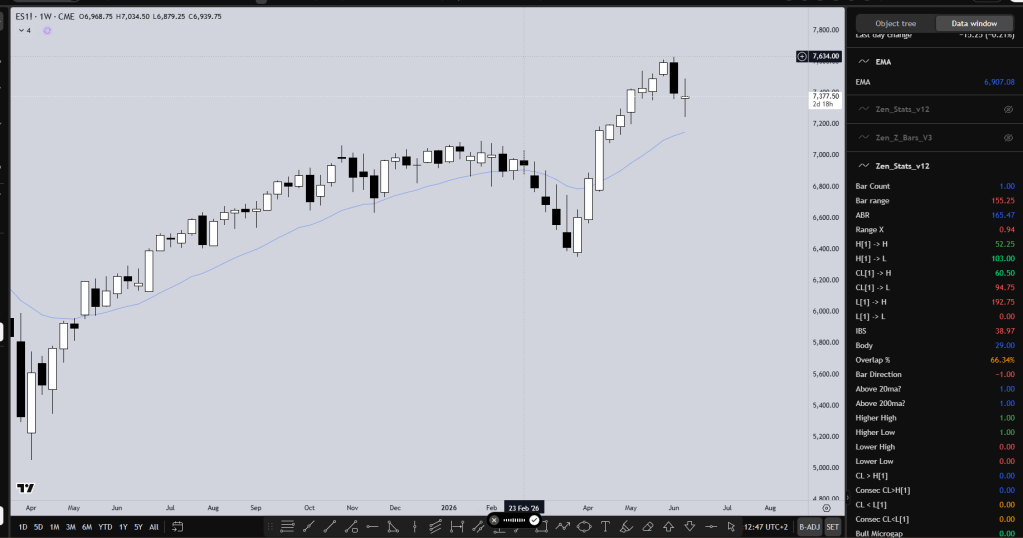
The real power is in the data export. Both columns — Bar Direction and Streak — export cleanly with your OHLC data as a CSV from TradingView. That CSV is what feeds the research.
To install: grab the Pine Script from the GitHub repo, open TradingView’s Pine Editor, paste and save. It’ll appear in your indicator list as “Zen Consecutive Bar Streak v1.0”.
Claude
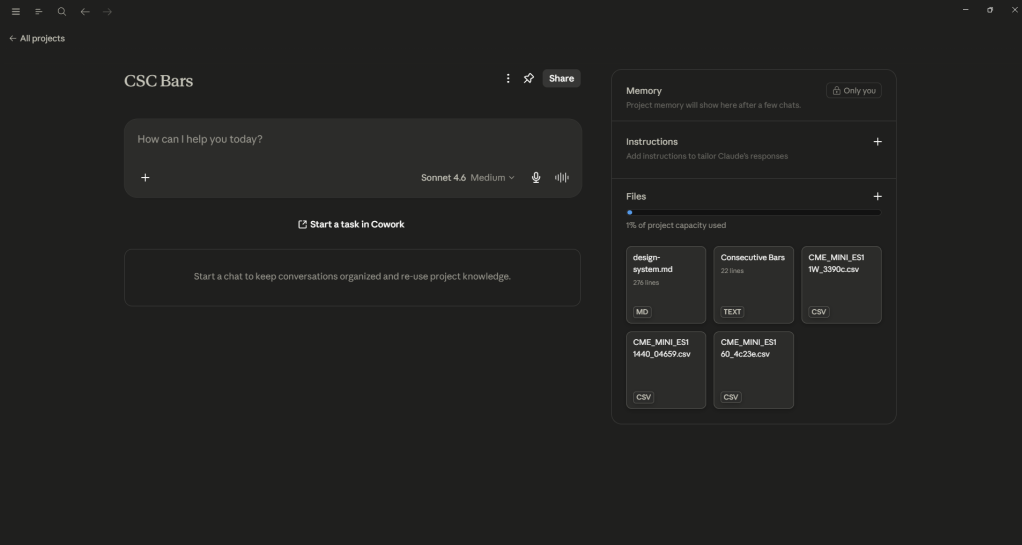
- Setup a project in Claude and add your files
- Indicator so he is smart and knows what you are talking about
- Data
- I added weekly, daily, 60m for fun
- I have a design system file I use to make my reports pretty – you can easily make one yourself based on how you like it
- I have done many research projects in Claude so I have a SKILL for research pipelines – but you can also make one yourself based on how you like to work.
- You will need to kick it off – something like this works for me:
Okay, so in this project we’re looking at the concept of consecutive bars within trading. You’ve got a few files in your project database that I want you to take a look at. We’ve got an indicator from TradingView, so you know how that works.
We’ve got some data exported through TradingView: weekly, daily, and 60-minute data in CSV.
You’ve got a design system. I’d like to do some research on consecutive bars, and I want to make sure you’ve got everything you need. You’ll also need to check you got access to the research pipeline skill. We’ve got a procedure to perform the research. Just double check you got everything you need so far.”
Markdown
- I first push all reports into Markdown rather than rendering them into some kind of HTML. It’s just faster to edit, and if you can understand something, you can then make it pretty. If you can’t understand it, HTML will drive you nuts.
- Never expect to one-shot anything with AI. Getting 80% of the way there on the first pass is a win. I had to correct its language. It was using weird words like “depth” and “streak”. A couple of edits and then we got a good report.
- Save markdown to your project
The Research Question
Simply: after N consecutive bull (or bear) bars, what is the probability the next bar continues in the same direction versus reverses?
This is a pure statistical question. No indicators, no context, no market structure. Just: given that the last N bars all closed in the same direction, what happened next across the full historical dataset?
I ran it on ES weekly data first — 1,501 weekly bars from September 1997 to June 2026, covering 29 years. Then on daily data: 6,706 daily bars from January 2000 to June 2026. The two timeframes tell different stories.
ES Weekly Findings: Bull and Bear Are Not the Same
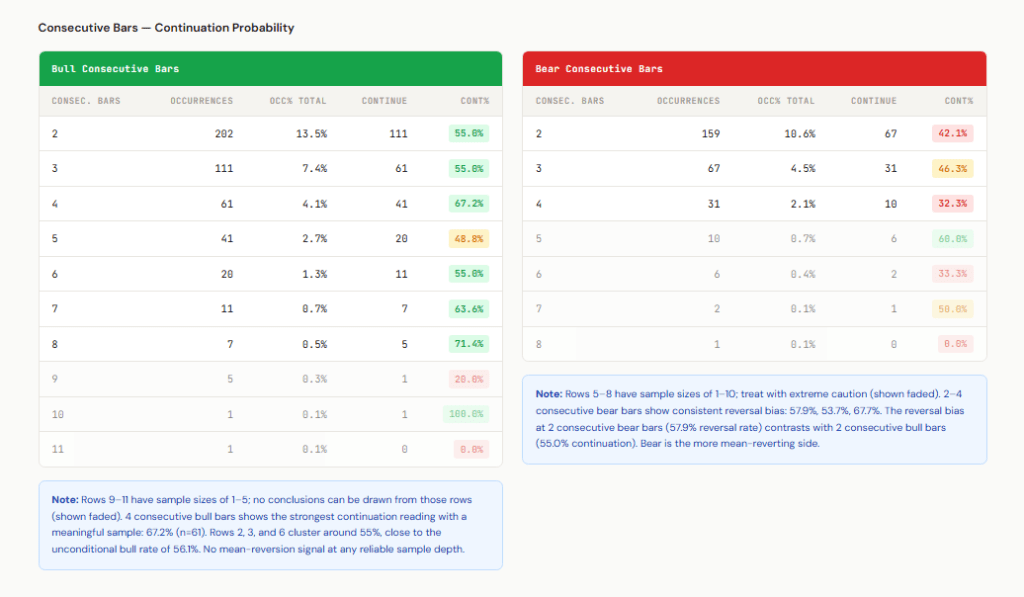
Across 29 years of weekly ES data, the baseline numbers look like this: 56.1% of weeks were bull bars, 43.6% were bear bars, and 5 doji weeks (0.3%) were excluded from the continuation analysis.
ES Daily Findings
- Remember you can run the same process on any data!
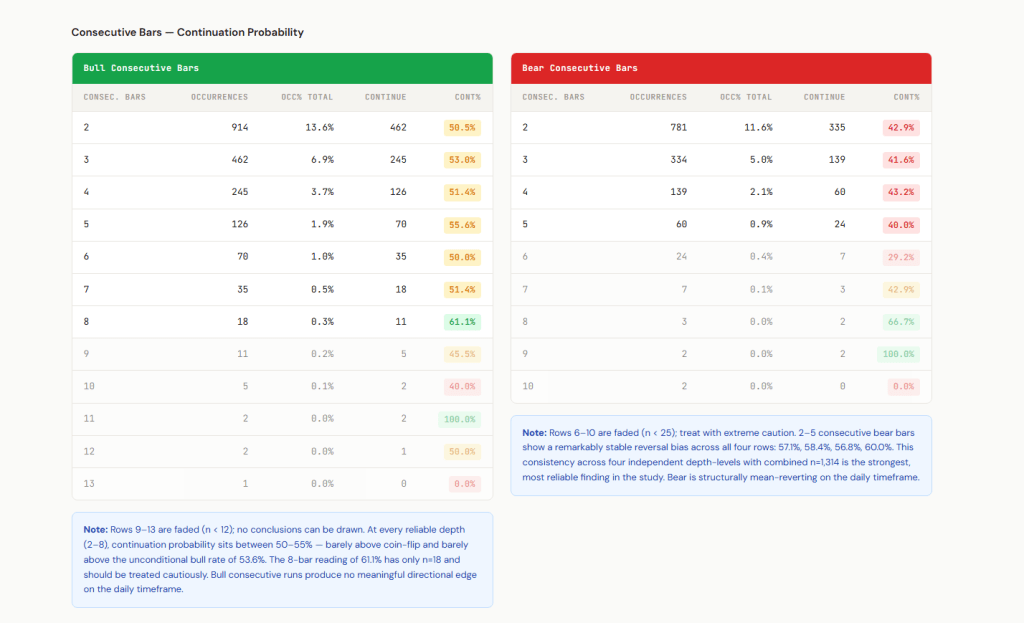
The daily data runs from January 2000 to June 2026 — 6,706 daily bars. The bull rate is 53.6%, bear is 45.6%. Slightly less bull-dominant than the weekly, but still a net upward drift market.
On the bull side, the continuation signal essentially disappears. At every reliable streak length — 2 through 7 consecutive bull days — continuation probability sits at 50–56%. That’s basically the unconditional bull rate.
Simply: on the daily timeframe, the bear reversal bias is the strongest, most reliable finding in the data. If you’ve seen 2–5 consecutive bear days on ES, the odds lean toward the next day being bull. Not a guarantee. But a consistent lean, backed by 26 years of data.
How to Run This Study Yourself
The kit is designed so you can replicate this analysis on any instrument or timeframe. Here’s the process:
- Step 1: Add the Zen Consecutive Bar Streak v1.0 indicator to your TradingView chart for whatever instrument and timeframe you want to study
- Step 2: Export the OHLC data as a CSV — TradingView will include the Bar Direction and Streak columns automatically
- Step 3: Open a new Claude session in the project (instructions in the process doc), drop in the CSV, and ask Claude to run the consecutive bar streak study following the design system
- Step 4: You get a markdown report and a formatted HTML report matching the ES research style
The process document in the repo walks through every step including naming conventions, fade thresholds (rows with n<10 are shown at reduced opacity so you don’t accidentally draw conclusions from tiny samples), and how to publish results to your own repo if you’re tracking multiple instruments.
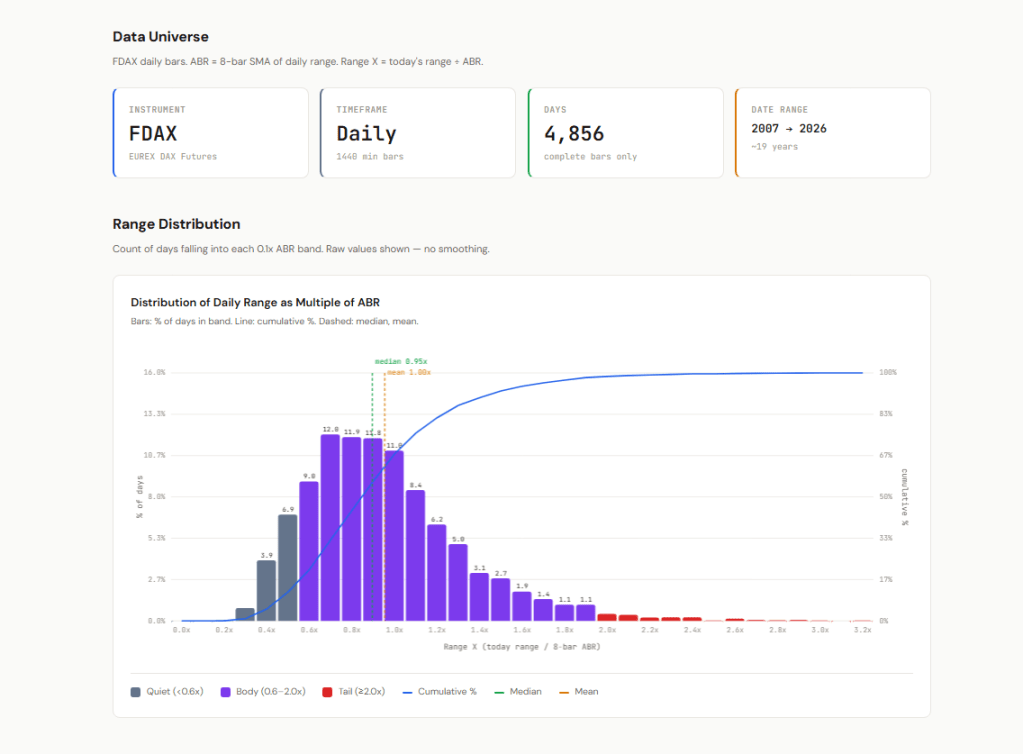
I’d be especially curious to see results on FDAX, NQ, and HSI. Do bear runs show the same reversal bias on those markets? My guess is yes.
What This Is (and What It Isn’t)
This is a pure bar-by-bar statistical study. It doesn’t know whether we’re in a bull trend or a trading range. It doesn’t look at the size of the bars, or whether a climax is forming, or where we are relative to the EMA. It’s just: given N consecutive same-direction bars, what happened next across the full dataset?
Does this mean you trade a mechanical reversal after every 4-bar bear run? Not automatically — the study needs to be combined with market context. It means you have a probabilistic lean — one more piece of evidence to weigh alongside everything else you’re seeing on the chart. That’s the point.
Data beats opinion. But data doesn’t replace judgment. Use both.
Get the Kit
Everything is free and open source at:
github.com/zentradingtech/zen-trading-tech-public
Folder: research-kits/Consecutive-Bar-Streaks/
- Pine Script indicator (Zen Consecutive Bar Streak v1.0)
- ES Weekly CSV (1,501 bars, Sep 1997–Jun 2026)
- ES Daily CSV (6,706 bars, Jan 2000–Jun 2026)
- ES Hourly CSV
- ES Weekly research report (HTML + markdown)
- ES Daily research report (HTML + markdown)
- Process document — run the study yourself on any instrument
If you run it on a new instrument and find something interesting, share it. I’d love to see results from markets outside the US.
Happy trading!
Tim
Zen Trading Tech


Leave a comment