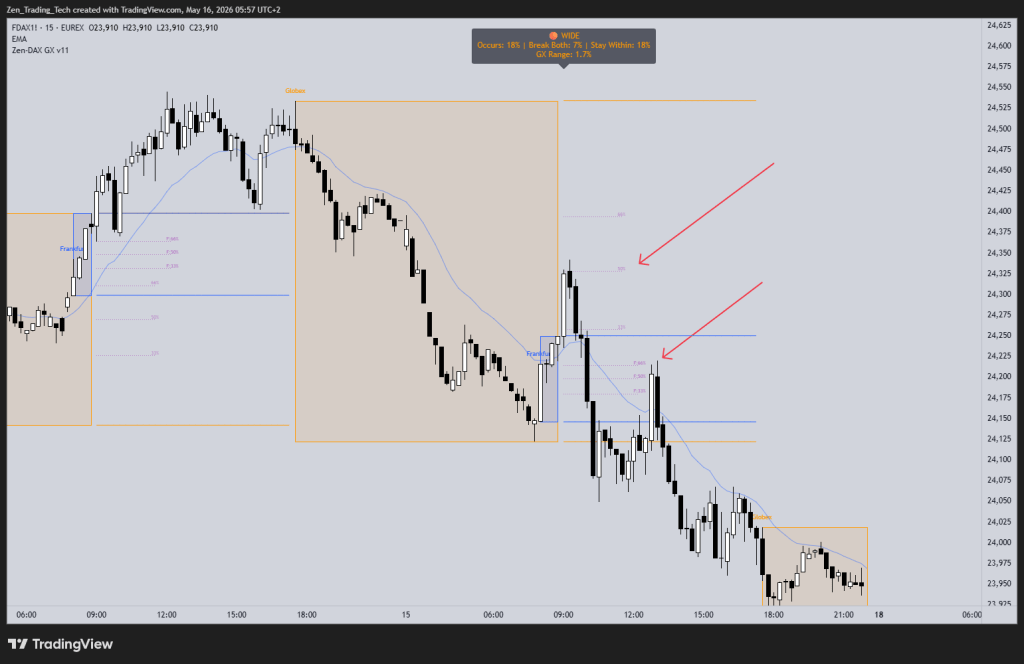
On the open, the range is often small.
You can see it on the DAX most days. First hour prints a 100-point box. Maybe a double top, maybe a double bottom, maybe just sideways. And the question every day trader asks themselves at this point is the same one:
Will today’s range expand?
Find the Video here!
The honest answer is — I don’t know for sure. But I can put a number on it. And so can you.
And this is a practical and functional way to develop patience and look for swing trades which I think be a central part of a day traders arsenal.
Why this matters more than opening range breakouts
The old way of trading the open was the opening range breakout. Form a box, wait for a break, measured move out of the range.
The principle is fine. But the more useful version is one level up — it’s the principle of volatility itself.
Markets oscillate between contraction and expansion. Sideways → trend → sideways → trend. Small bars → big bars → small bars → big bars.
If you can put a probability on whether today’s range is going to expand from where it currently is, you’ve got something more valuable than any single setup. You’ve got patience.
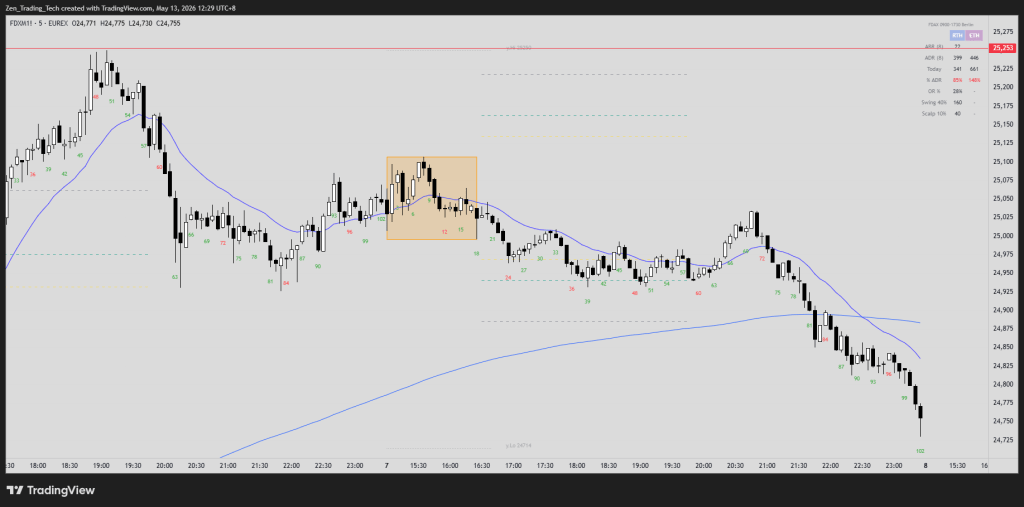
The DAX example
The average daily range on the DAX right now is about 400 points.
When I see an opening range of 100 points, I already know there’s a good chance we’re going to double or triple that range over the course of the day. That’s not a hope. That’s what 19 years of data says.
That’s not a setup. It’s not a trade entry. It’s a stance — a default posture for the session. When I see a small range in the morning, I don’t get impatient. I don’t force trades. I lean toward swing trades in the direction of expansion, because the data tells me where the day is most likely to go.
Why I’m publishing this as a research kit
I’ve been getting the same question for about 12 months: can you teach me how to do my own research?
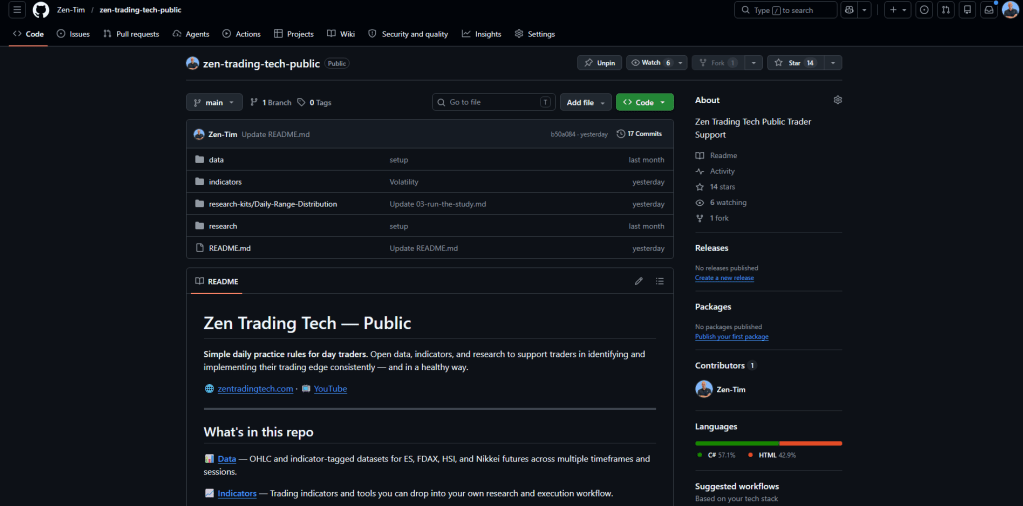
So I’m putting it on GitHub. Free. Open source. Run it yourself.
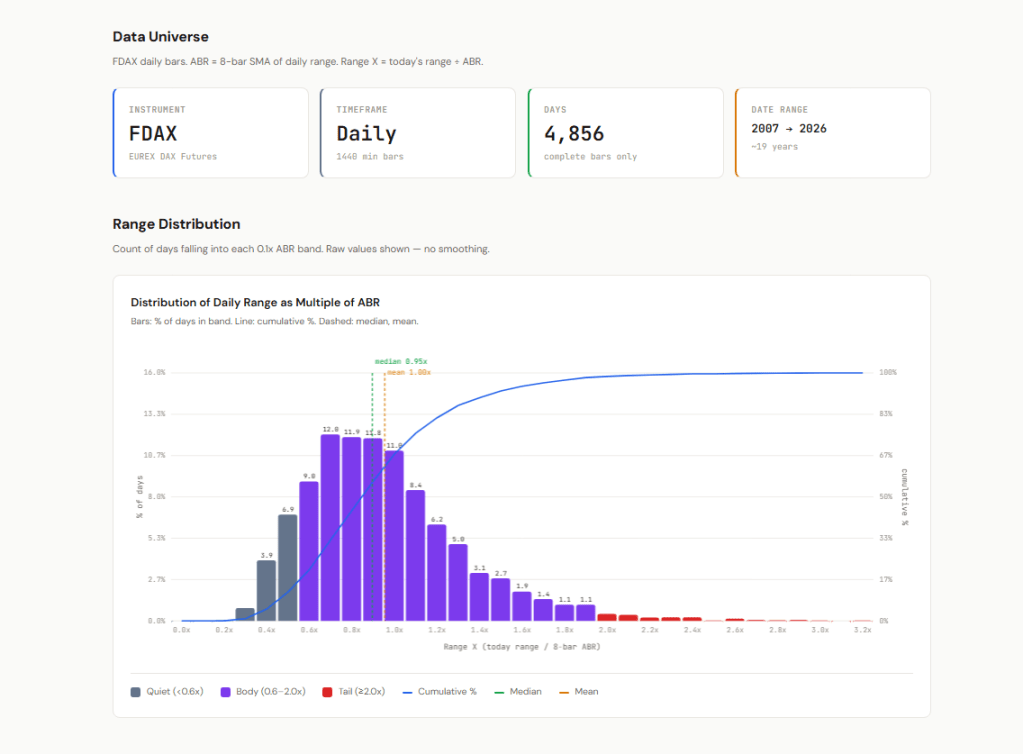
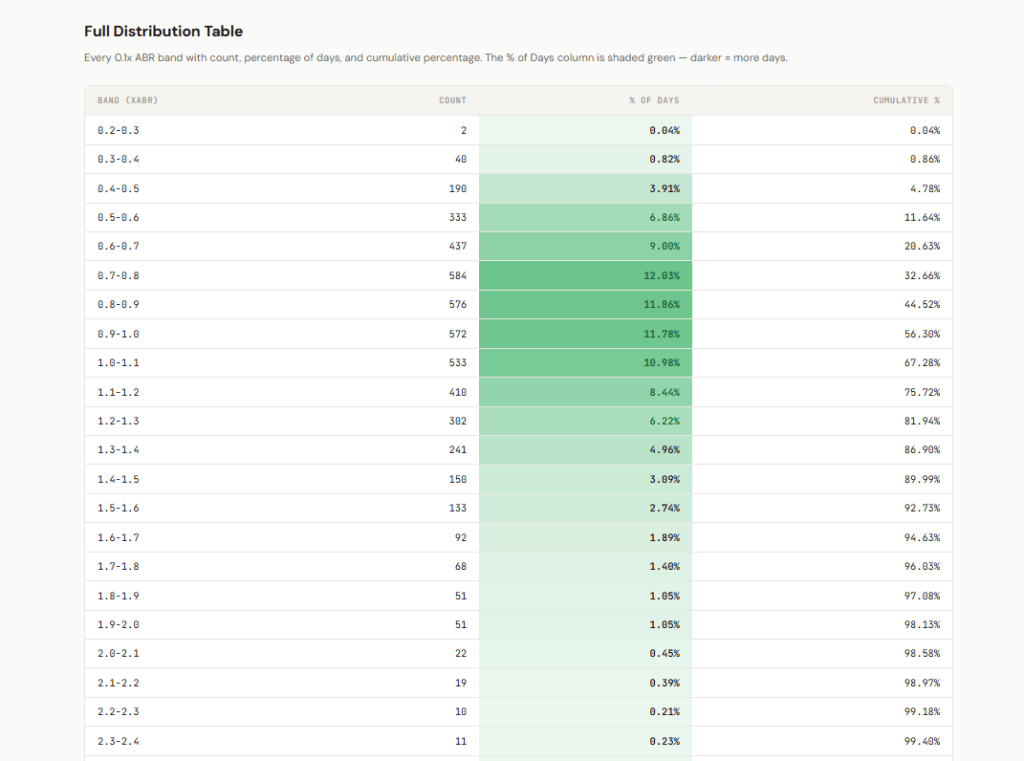
Kit #1 is the Daily Range Distribution study. The goal is simple — for the instrument you trade, build a histogram of daily ranges and a probability table that tells you, whether we have done enough range for today, or we are likely to expand!
Inside the kit:
- The TradingView indicator (free, open source — Zen Trading Toolkit v1.8.1, Volatility Stats Table module)
- Instructions for downloading the bar data
- The execution prompt to drop into Claude
- A sample HTML report on the DAX so you can see the output before you run your own
How it works
Five steps, maybe an hour from start to finish.
- Add the indicator to TradingView. The Zen RTH Trading Toolkit is free. Apply it to your instrument, switch on the Volatility Stats Table module.
- Set up the chart properly. Continuous contract, day trading hours only, your local time zone. Scroll back as far as you want data — the further you scroll, the more history Claude has to work with.
- Download the chart data. Use the TradingView “Download chart data” option. ISO time format.
- Drop the CSV into Claude. Use the execution prompt in the kit. I recommend Sonnet for this — Opus is overkill for the number crunching. Tell it to remove zero-volume / holiday days.
- Read your report. The output is an HTML report with the histogram, the probability table, and a markdown version you can feed back into Claude for follow-on research.
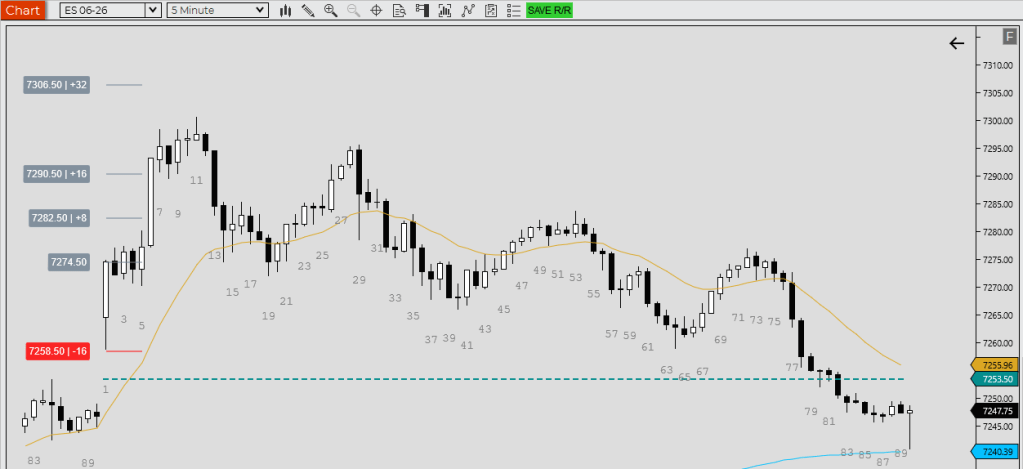
In the video I walk through a live example on the Hang Seng. Same workflow, different instrument. Works the same.
What you do with the output
Two things.
First — a baseline expectation. The histogram tells you what a “normal” day looks like for your instrument. So when you sit down at the open and see a 100-point range on the DAX, you know it’s small. You know what big looks like. You know what the tails look like.
Second — a conditional probability. The table tells you, given where the range is right now in the session, what the odds of further expansion are. This is the bit that builds patience.
You can’t trade probabilities directly — they’re not entries. But they’re the foundation everything else sits on. Setups, targets, stops, position sizing — they all calibrate against this baseline. Without it you’re guessing.
Run it on your instrument
If you trade ES, DAX, HSI, Nikkei — the data presets are built into the toolkit. If you trade something else, the indicator is open source. Open it in the Pine Editor, change the session times to your instrument, and you’re off.
The repo is here: github.com/Zen-Tim/zen-trading-tech-public
Click into the Research folder, open Kit #1, and follow the instructions. Star or fork the repo and complete the research on your own instrument. That’s the whole ask — do your own research.
If you’ve got other research kit ideas you want me to cover, drop a comment on the YouTube video or on the GitHub. More kits coming.
Tim Fairweather
Zen Trading Tech


Leave a comment