- Free Indicator to Help Get the Data
- Opening Data Population I Tested
- Does Bar 2’s Shape Matter?
- What’s the Probability the High or Low of the Day is Already in?
- Does the Size of the Move Matter?
- Does the Internal Bar Strength (IBS) of Bar 2, Impact the Trade?
- Where Does the Day Actually Close Relative to Yesterday?
- Where Does the Day Close Relative to That Bar 1+2 Range?
- Does Where We Open Matter?
- Does Breaking Yesterday’s Level Matter?
- Different Ways to Trade It
- Outcome
- Trade It Using the 5-Minute Chart
- Trading Range Day Version
- Why This Post Matters More Than the Pattern
Here’s a question I couldn’t stop thinking about: if the first two 60-minute bars of the day are the same color, how much does that actually tell you about the rest of the session?
I got here from a different chart. I trade the 5-minute, and I kept noticing how often price comes back to revisit two specific levels — the close of bar 12 and the close of bar 24.
Those are the hourly closes hiding inside the 5-minute chart. So I started tracking the 60-minute bars directly instead of inferring them, and a pattern showed up early: when the open prints two consecutive bull bars on the 60-minute chart, the day tends to finish as a bull day. Same thing in reverse for bears.
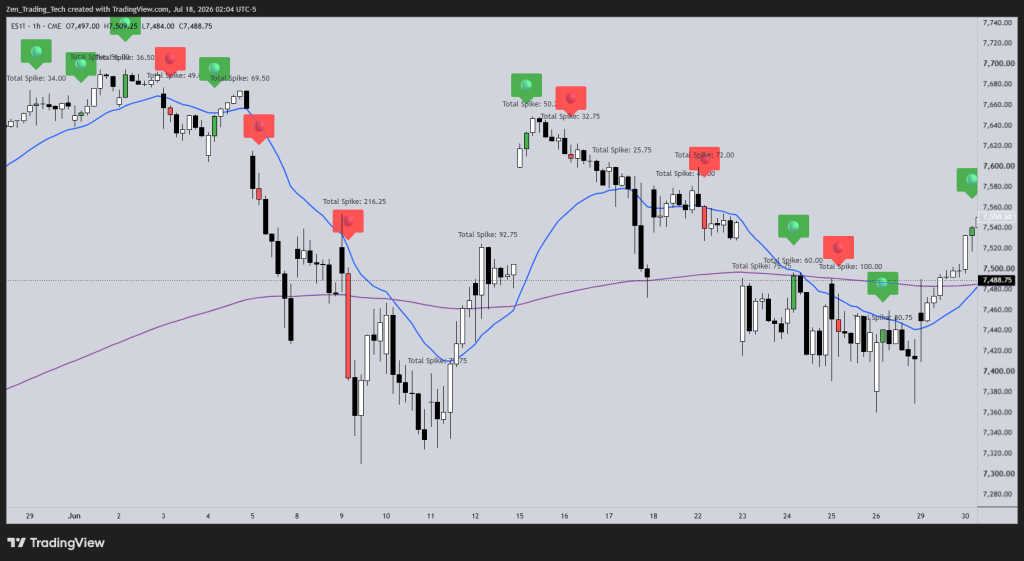
This post is the research behind that observation — how I built it, what I tested, and how far the edge holds up before it breaks. It’s also meant as a template. The pattern itself is one idea.
The process — noticing something on your homework, formalising it, testing it — is the part you can reuse on anything.
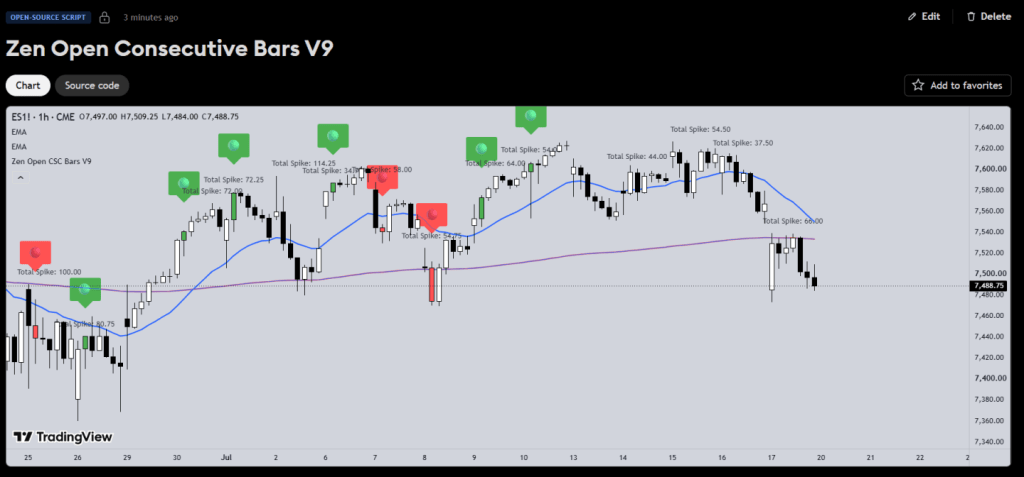
Free Indicator to Help Get the Data
Click here to find it on TradingView
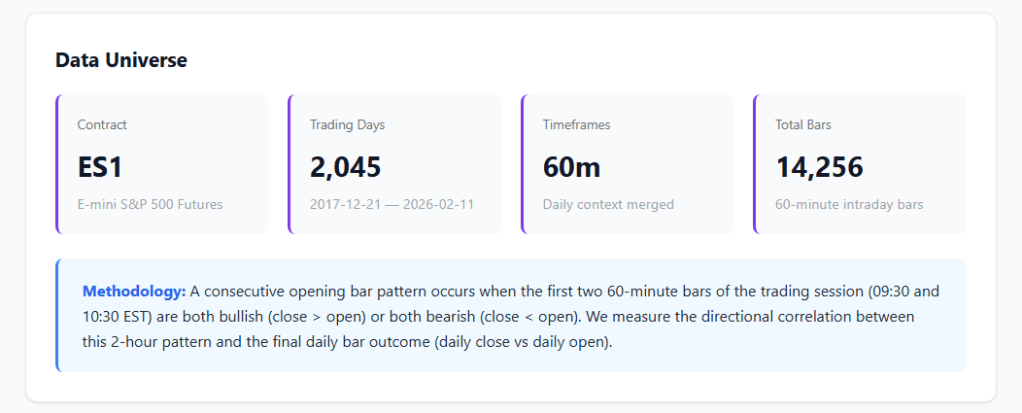
Opening Data Population I Tested
The base case, first: what happens when the first two 60-minute bars of the day are the same color?
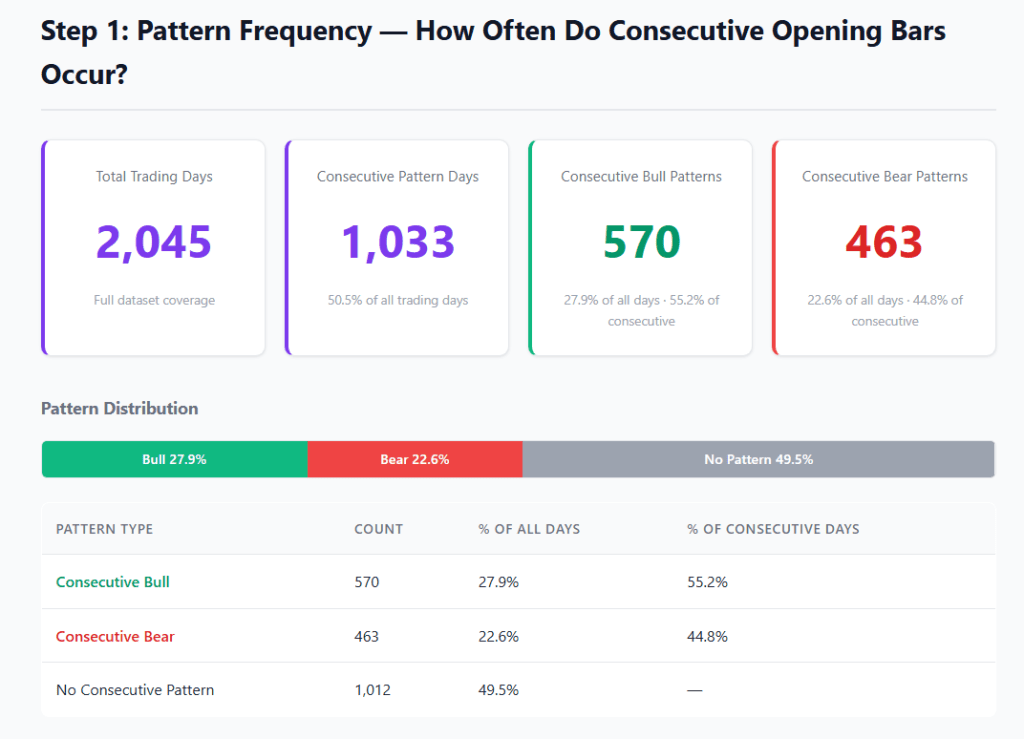
So then does it help us predict today’s outcome?
Yes.
Simply: it happens on about half your trading days, and about eight times out of ten, the day finishes in that same direction. Cool beans.
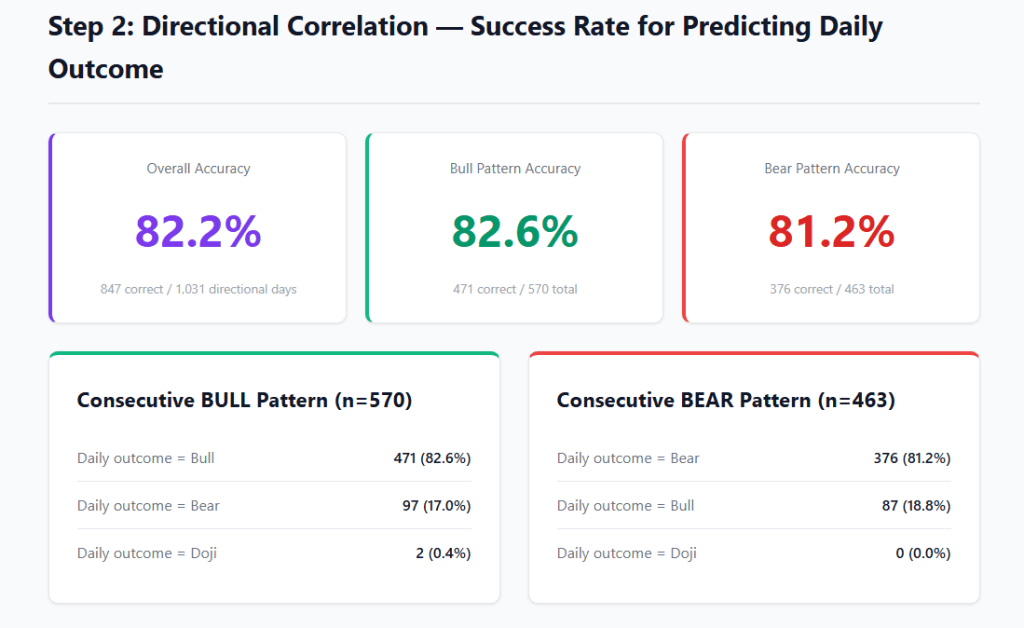
- Two consecutive bull bars on the open → ~80% of those days close as a bull day
- Two consecutive bear bars on the open → ~80% of those days close as a bear day
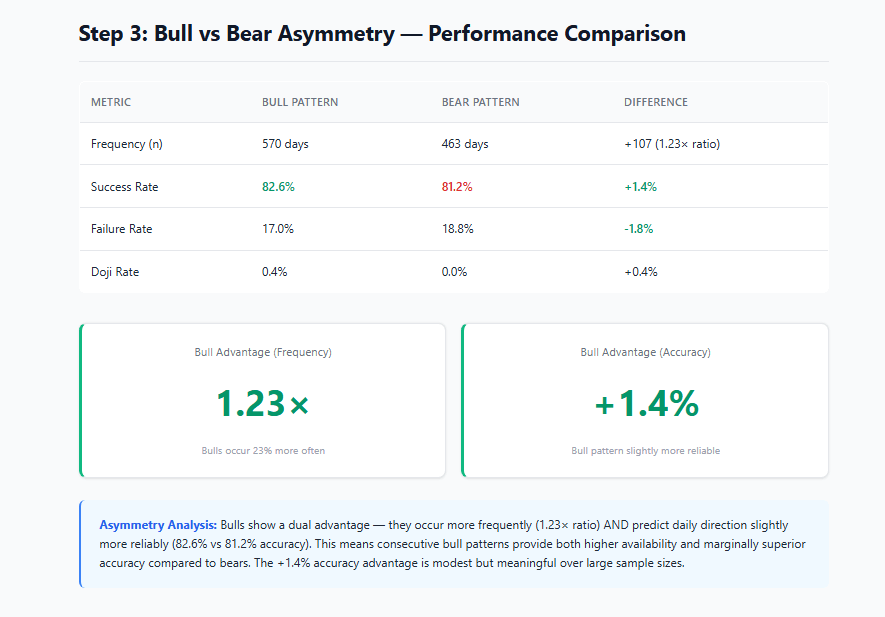
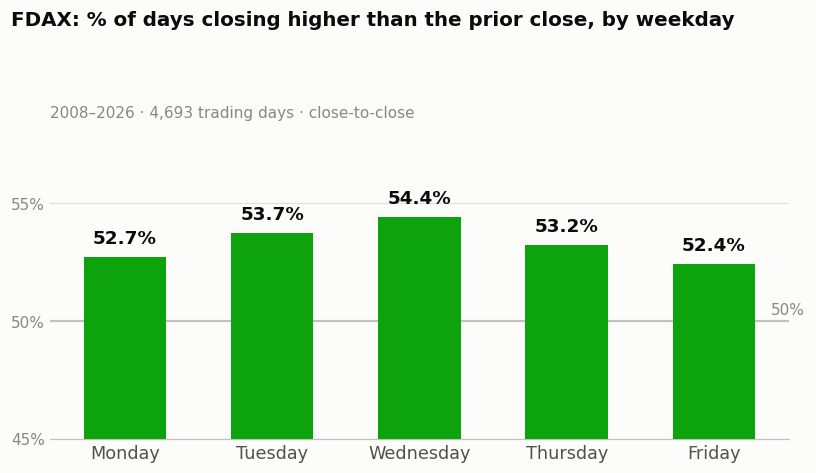
Quick check on the difference between Bull and Bear versions.
Does Bar 2’s Shape Matter?
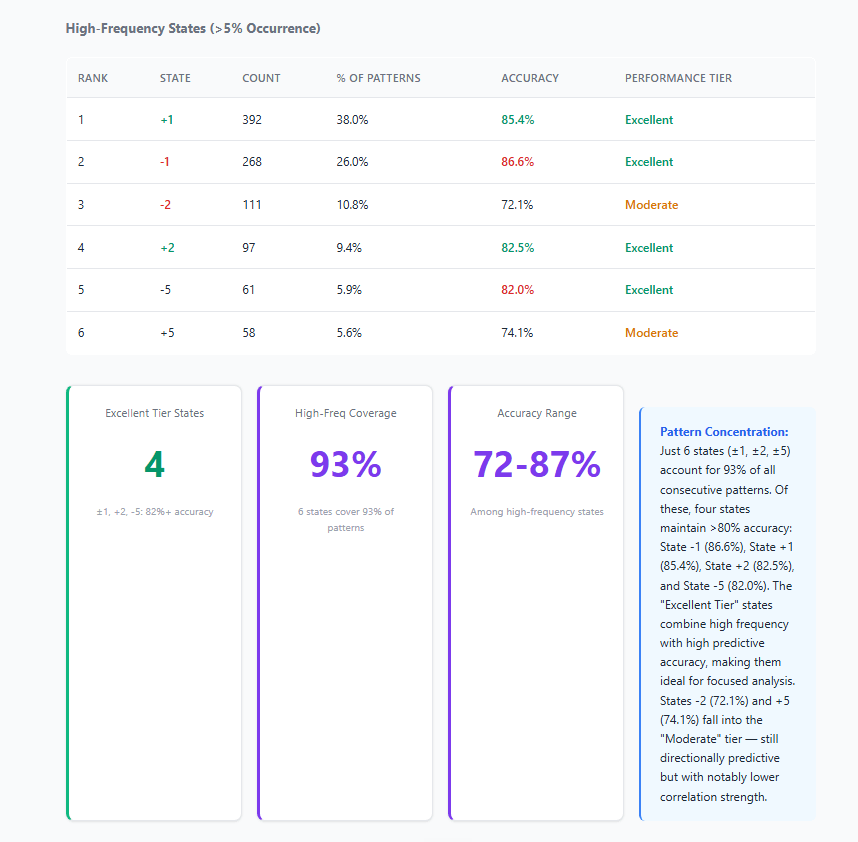
I started to ask, “Does it matter what bar 2 is?” What I came up with was what I’ve coined a 12-state bar classifier — six flavors of bull bar, six flavors of bear bar (size, close location, that kind of thing).
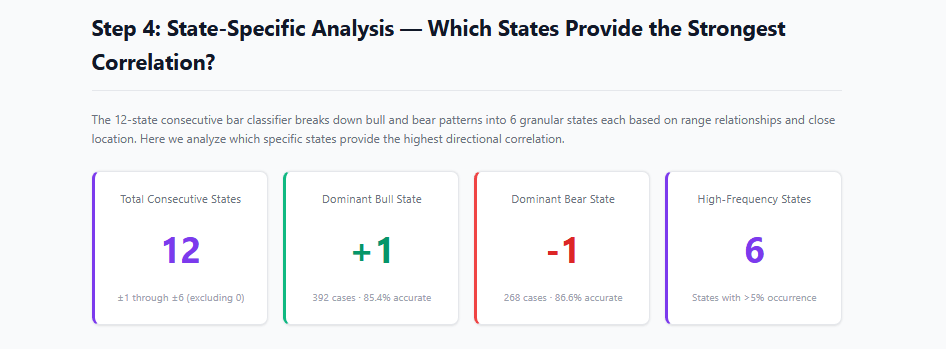
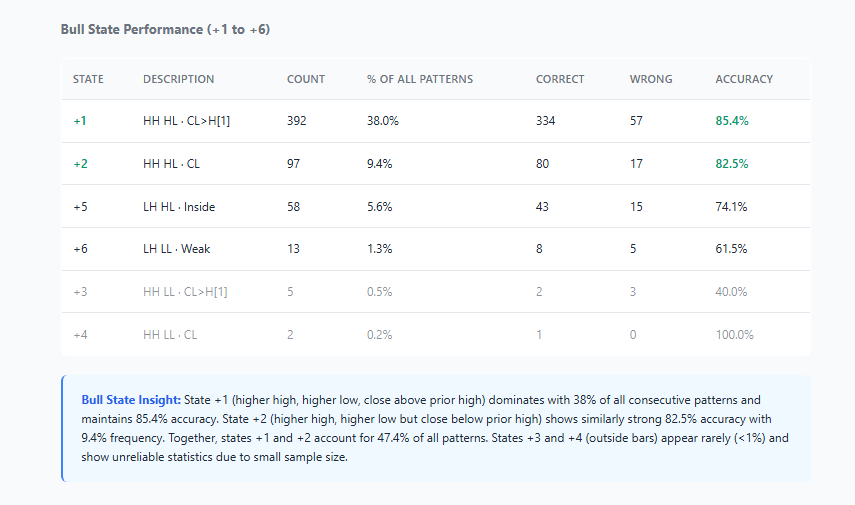
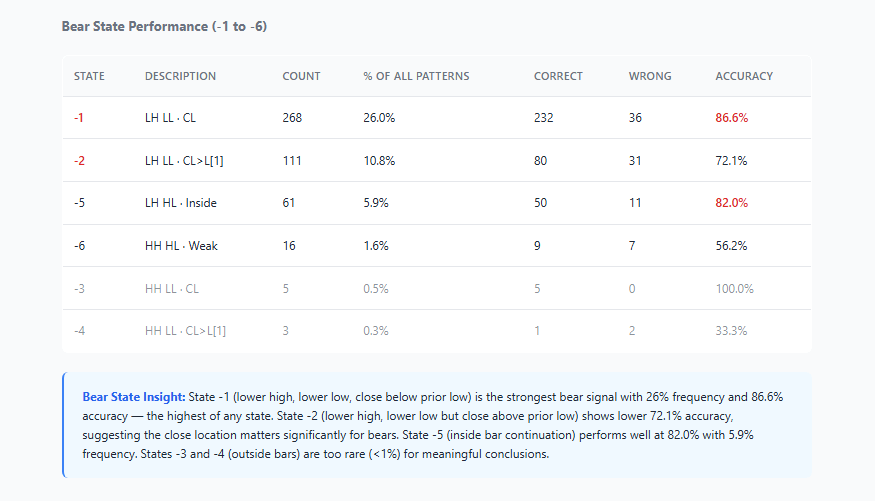
- Unsurprisingly, a stronger 2nd bar helps.
What’s the Probability the High or Low of the Day is Already in?
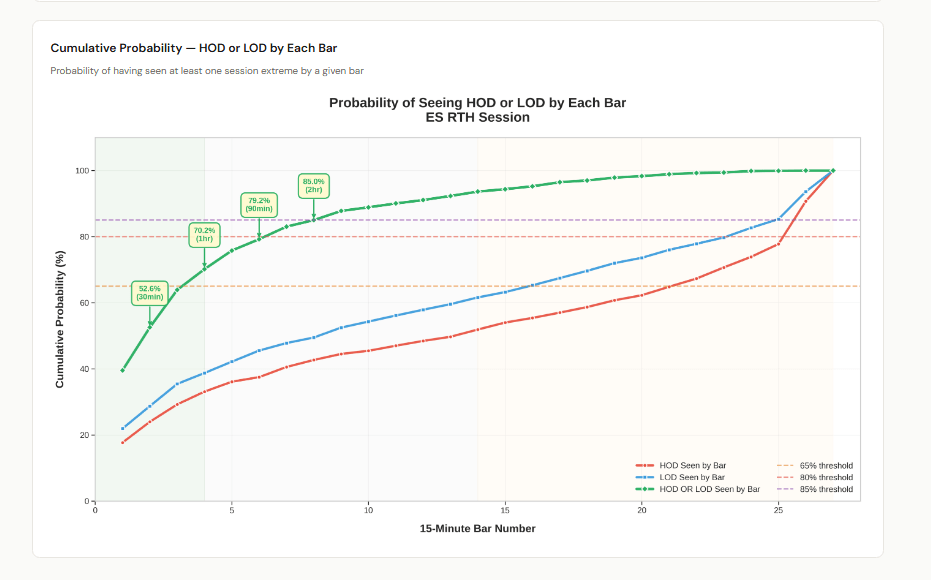
Using my prior research on ES, here’s one I prepared earlier:
So we have an 85% chance either the HOD or LOD is in.
Does the Size of the Move Matter?
OK – so we have a signal but is there anything left to trade?
So I started to think about what I call HEADROOM. Can I trade in that direction?
So I needed a relative yardstick, and I used average daily range (ADR) — same ADR calculation I use on the daily chart, 8-bar lookback.
How much of the Average Daily Range do we cover? High to low.
How much is left from the Bar 2 close.
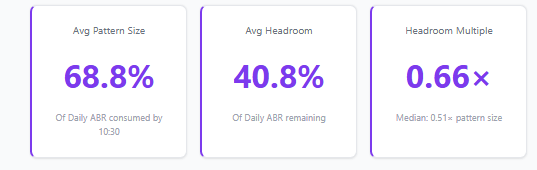
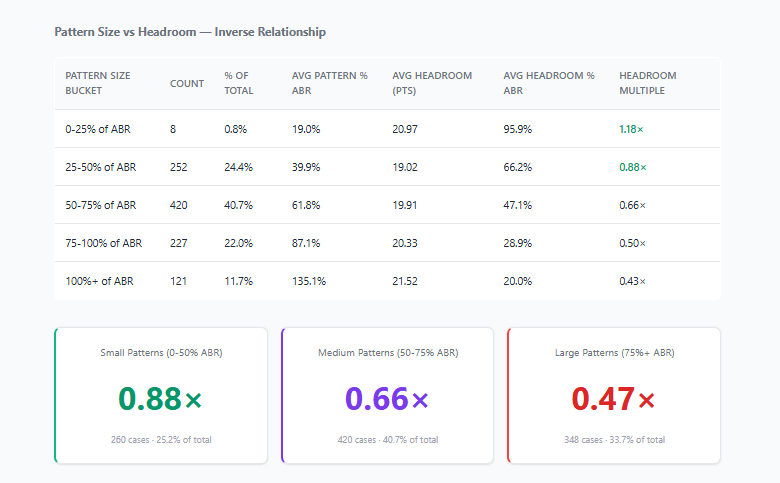
So now we are getting somewhere – we can’t just buy the close and put a stop below the low because there is not enough room left today.
Quick check bull vs bear
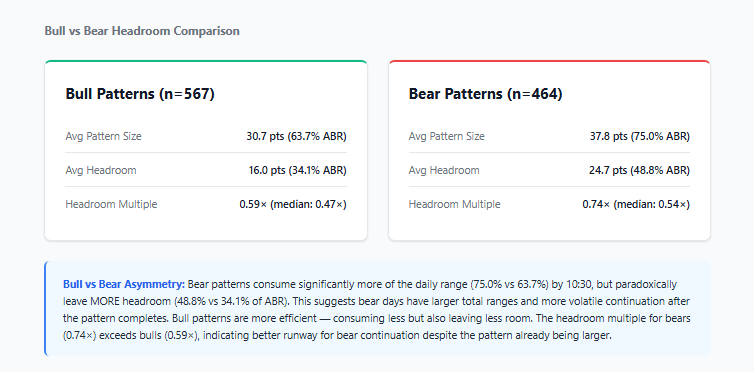
So now we are getting somewhere. We want the bars to be the same, but not huge.
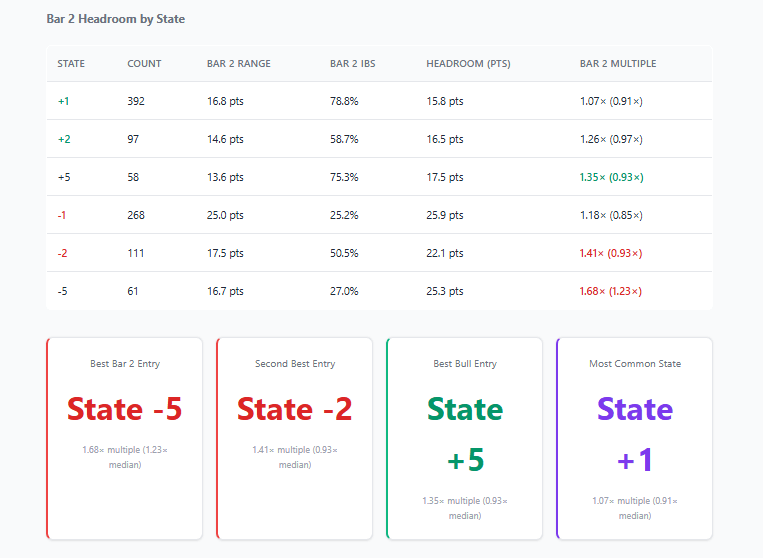
Interestingly enough, the Bar 2 Inside bar comes out better because it confirms the pattern without taking up the distance. I wouldn’t have picked that!

Overall on my Zen 12-State Bar classifier (I should get a better name for that), we have a winner here: Inside bar 2 for the win!
Does the Internal Bar Strength (IBS) of Bar 2, Impact the Trade?
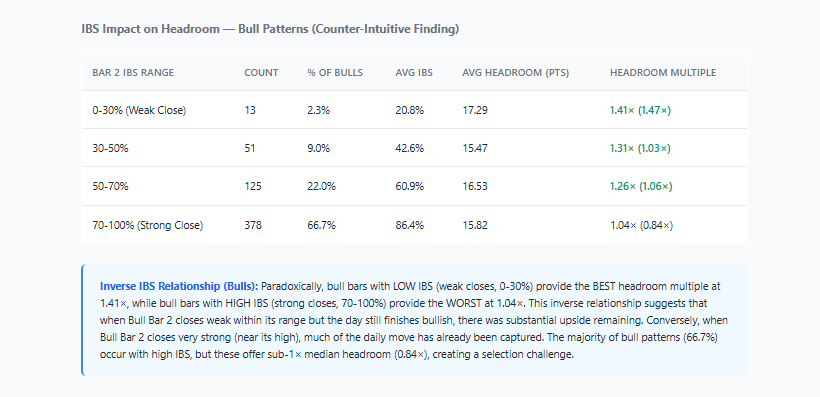
Counter-intuitive, but in line with the inside bar idea: getting a 2nd bull bar with a weak close increases headroom and gives more space for the trade to run.
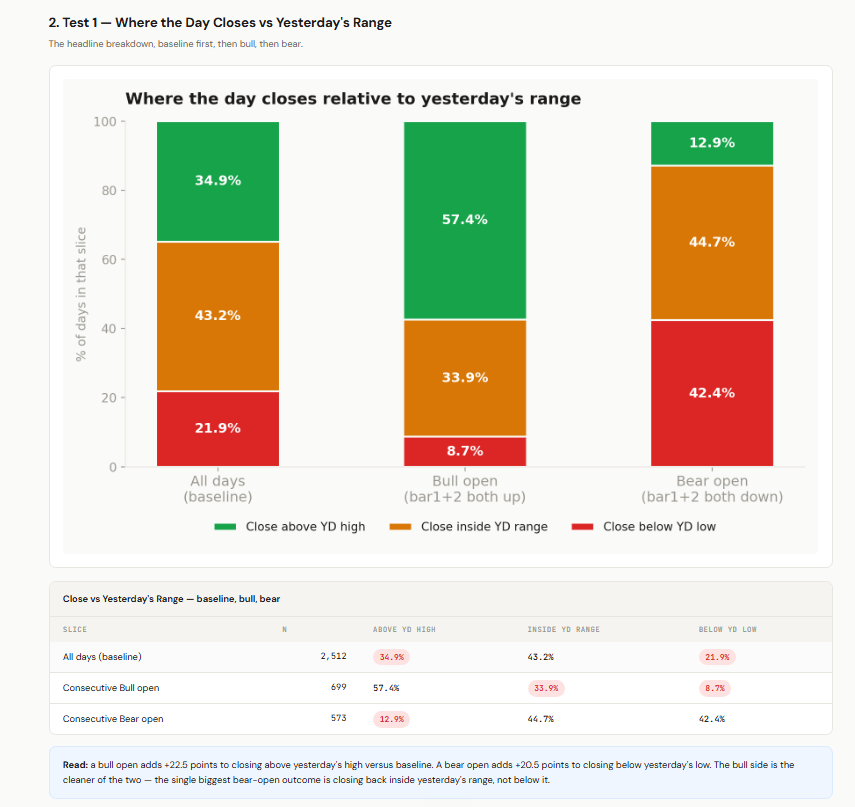
Where Does the Day Actually Close Relative to Yesterday?
- Then I looked at how it relates to yesterday
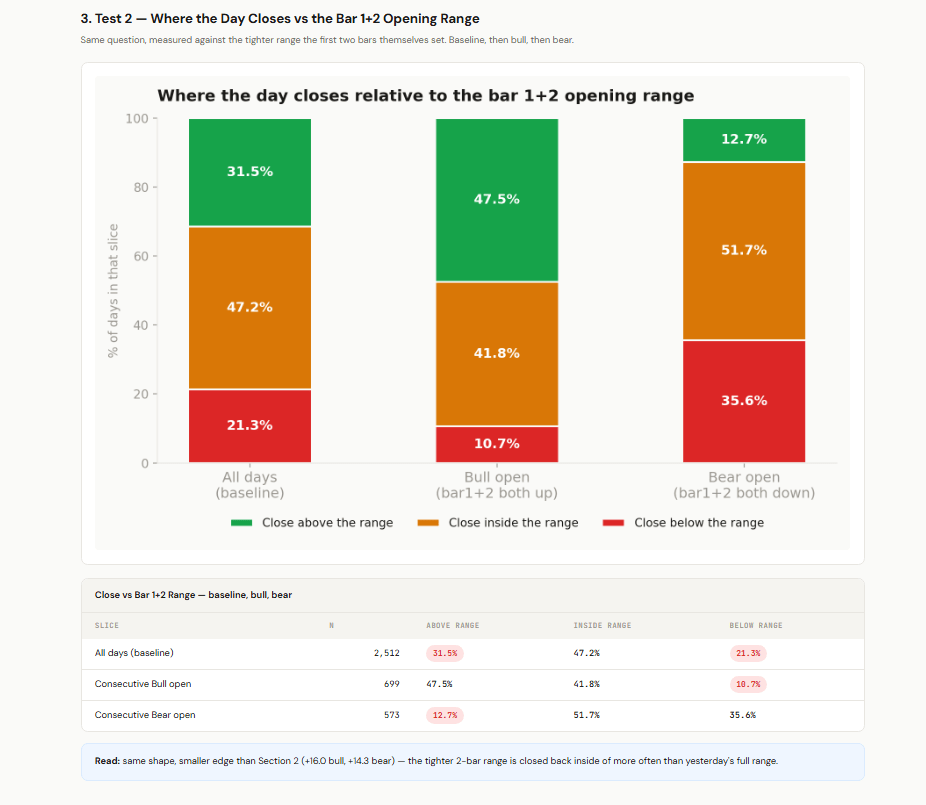
Where Does the Day Close Relative to That Bar 1+2 Range?
- More important, can we escape the range we created at the start of the day?
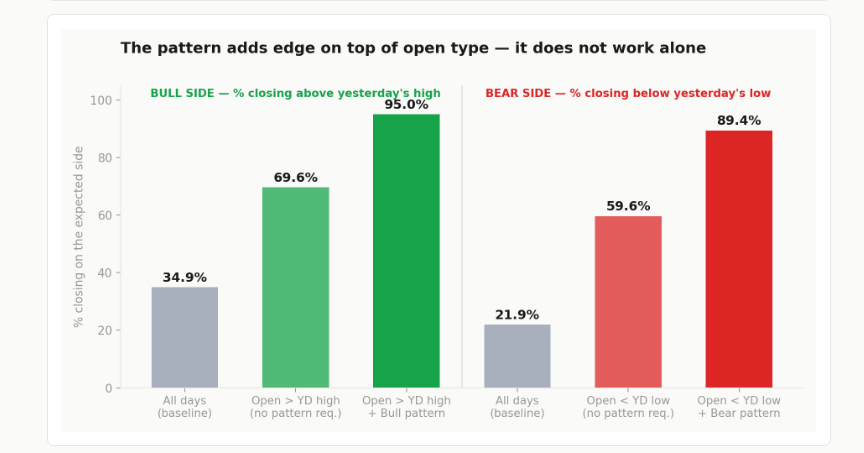
Does Where We Open Matter?
What if we changed the input to where we opened relative to yesterday?
- Opening above yesterday’s high
- Opening inside yesterday’s range
- Opening below yesterday’s low
I could insert a whole bunch of data, but it didn’t move the needle much — the summary is:
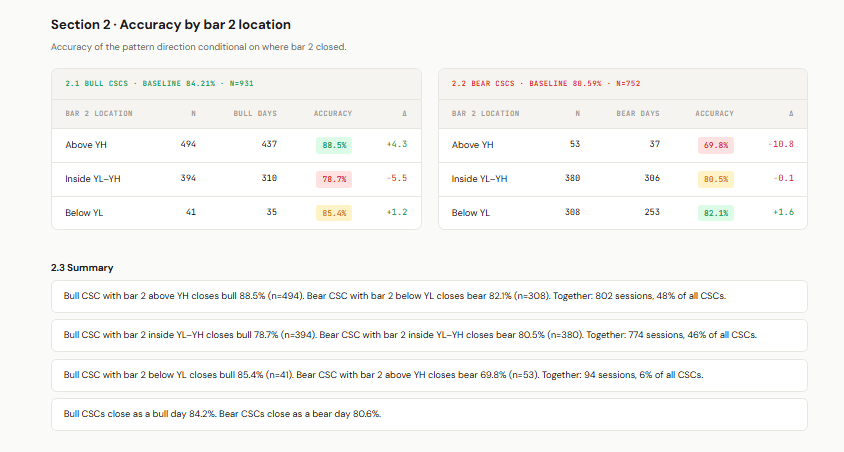
Does Breaking Yesterday’s Level Matter?
Related question, narrower: in the bull case, does it matter if that opening spike actually breaks yesterday’s high? In the bear case, yesterday’s low?
Slight increase when the close is outside of yesterday’s level.
Different Ways to Trade It
The simplest version: see two consecutive bull bars on the 60-minute chart, buy the close. But we already worked out it only goes 0.6x the distance… so the trade ain’t great.
Ok, lets think about a pullback trade.
In a pullback trade, you’ve got 4 options:
- It just extends and never pulls back.
- It pulls back, then fills you and goes to your target.
- It pulls back, fills you, but goes sideways until you close it.
- It pulls back and just stops you out.
Just looking at MAE/MFE — booking the max favorable movement — here’s what I found:
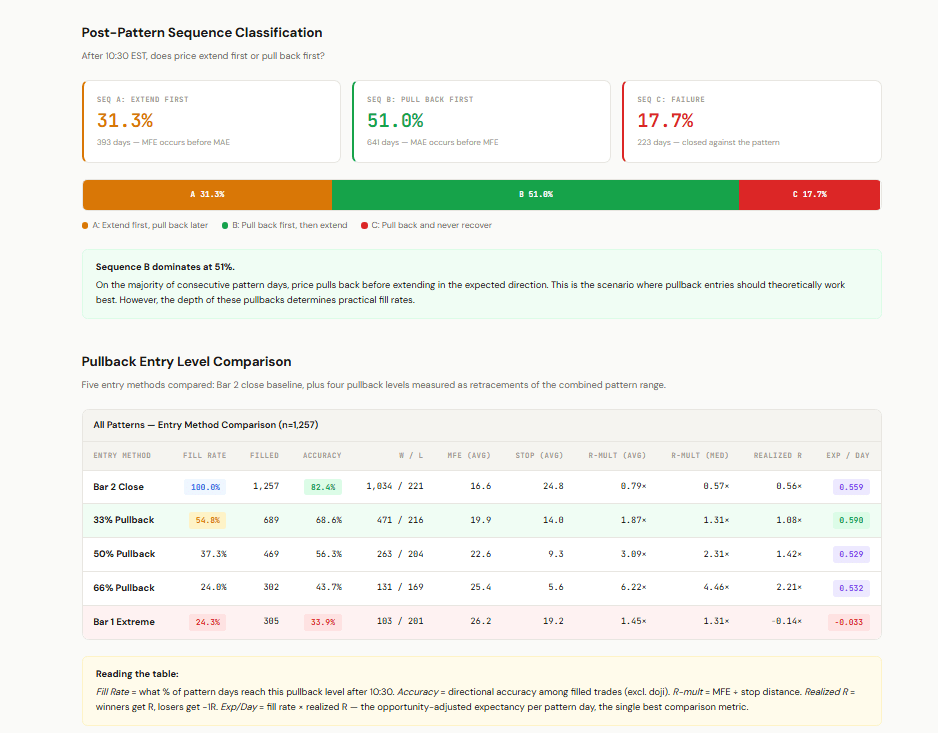
- Interestingly the bull buy the close and the bear 33% pullback perform the best.

- But we need to set some actual targets up-front, not just judge on the “the best” so lets look at it with fixed targets.
Outcome

- Best confirmed-trade combo: Bar2 Close entry, 0.5x stop, 1.0x target — 57% win rate, 0.14R realized, 0.114R/day. The single top-ranked combo by raw Exp/Day (0.5x/1.5x) only wins 42% of confirmed trades; most of its edge comes from day-close marks, not actual target hits. Wide stops (1.5x) are dead across every entry method. Deep pullbacks (66%) barely fill (39%) and mostly don’t pay off.
- Another good one is using half the pattern’s range as your stop location, and go for a 1:1
- PB 33% pullback entry, 0.5x stop, 0.5x target (0.5x stop distance) — 78% confirmed win rate, 533 fills, 0.113R/day, close to symmetric bull/bear.

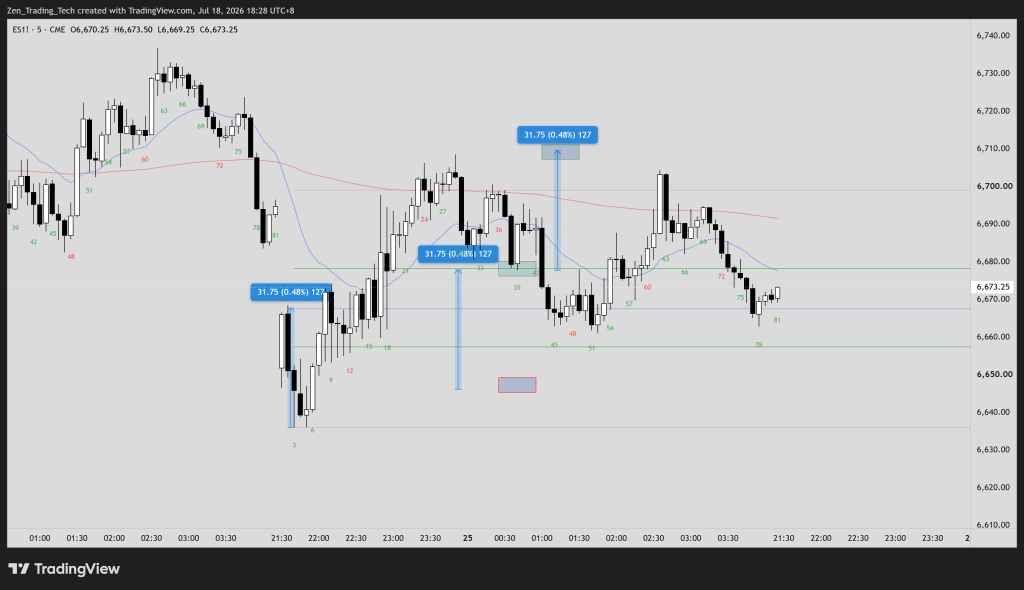
- I can’t say I “agree” with the data, because I need to go and find many examples to match it. But thats the stats for you!
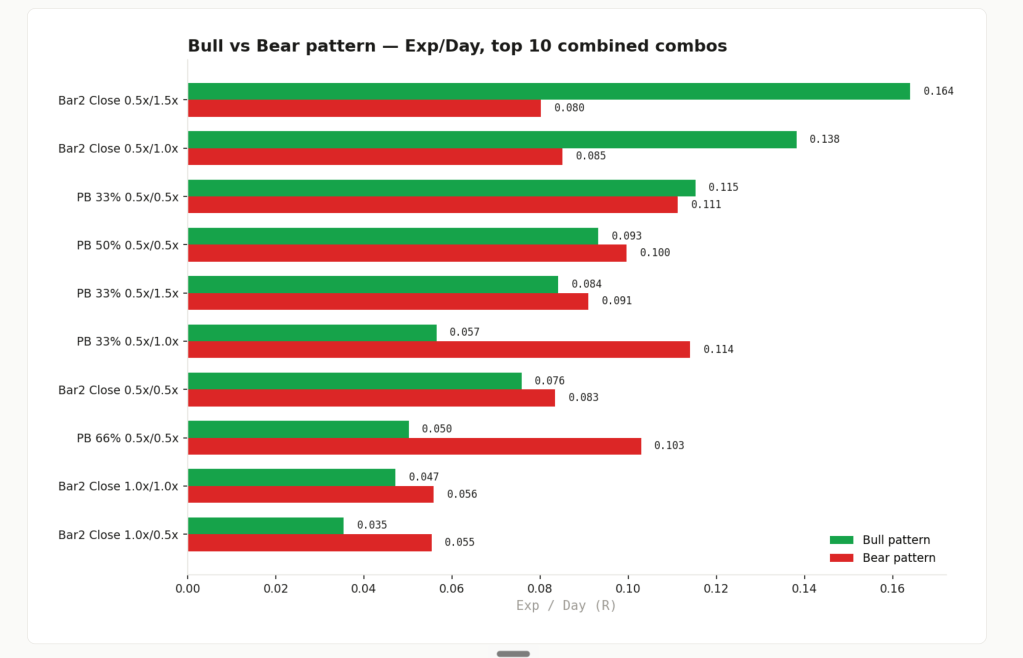
- Not a slam dunk, but certainly a place to go next time.
Trade It Using the 5-Minute Chart
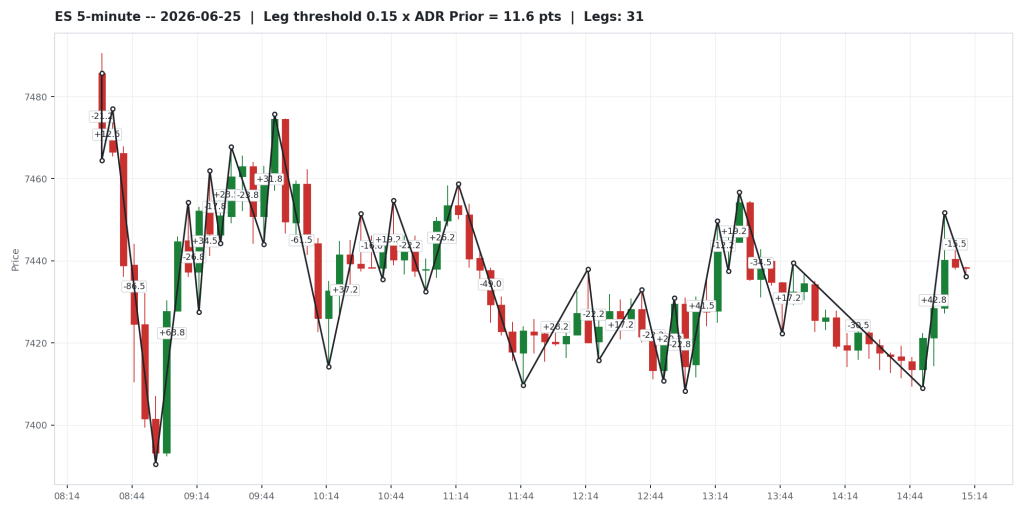
- In the end, I’ve gone back to trading it on the 5-minute chart but with higher-timeframe targets — which is great for swing trading.
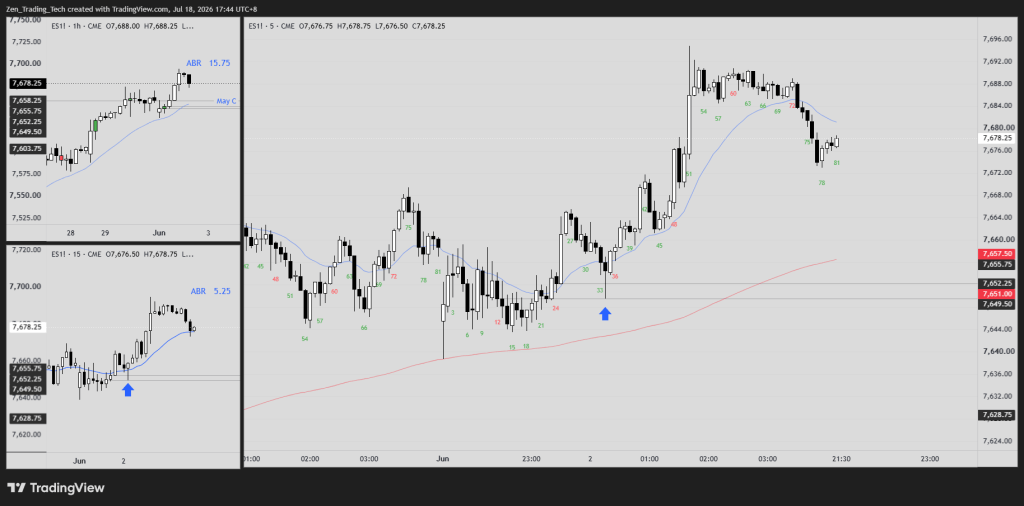
- I was looking to find a more part-time way to trade it, but that didn’t happen lol!
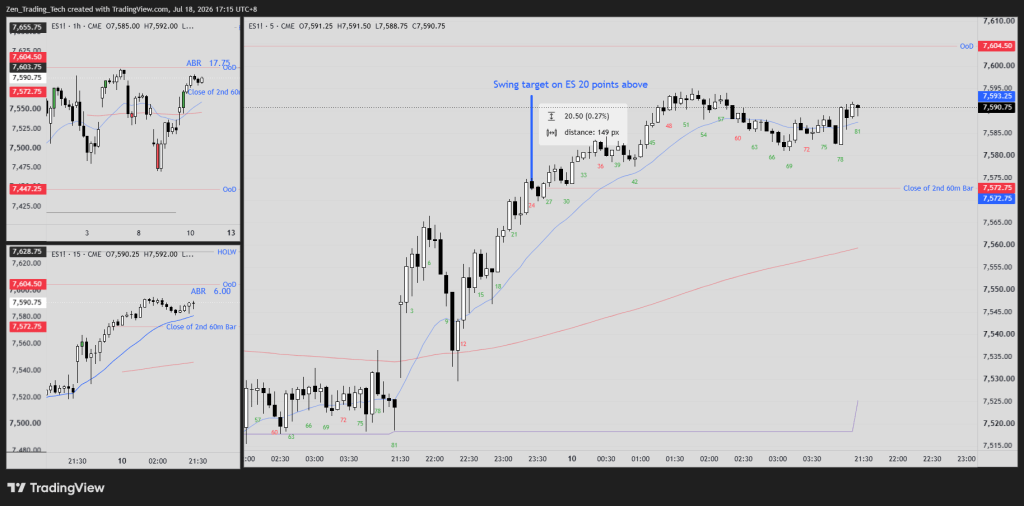
- Most of the time I use it for direction and sizing and then use a smaller timeframe to attack it like above.
- Or trying to enter on the first bar’s close after the 2nd confirms it like below
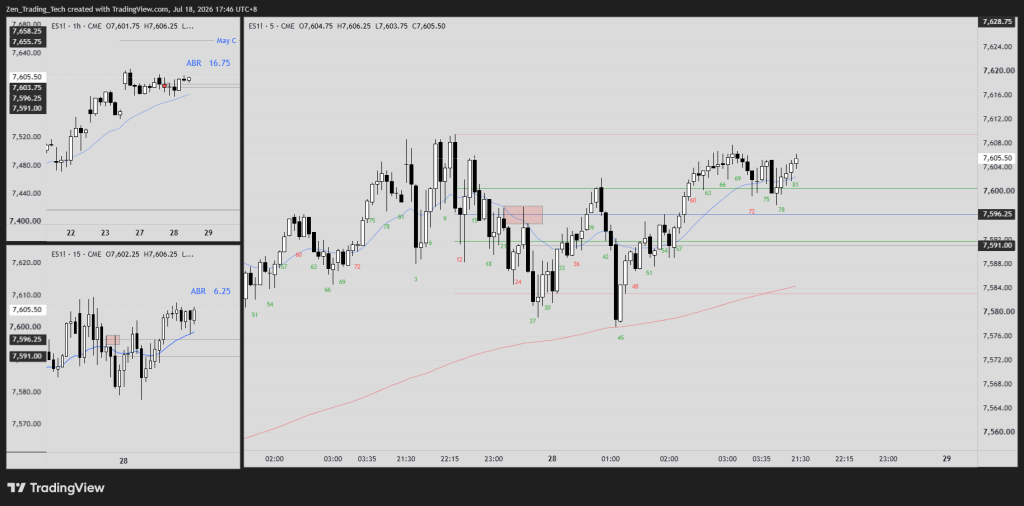
- You can also see the reversal and trade back to the 2nd close like below
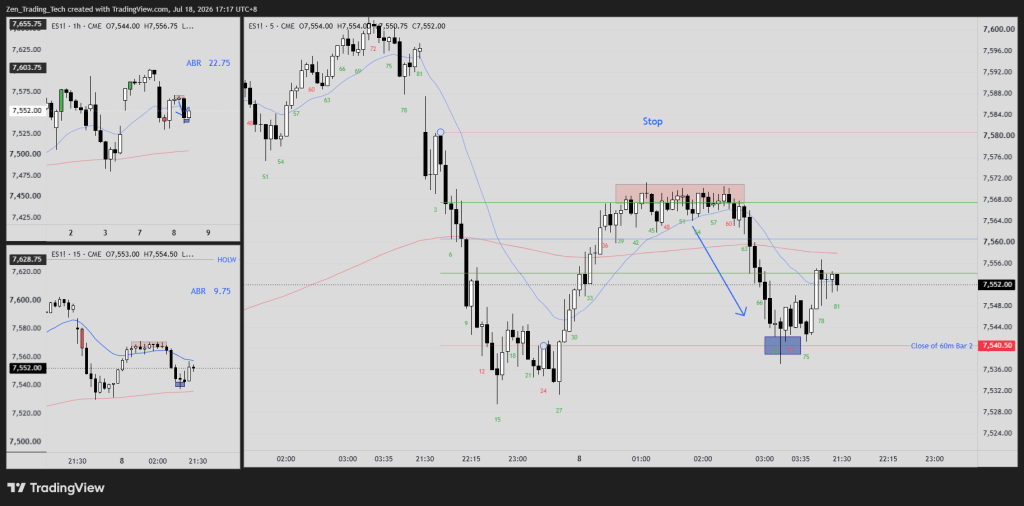
- Sometimes it won’t pan out and will oscillate between the two like below
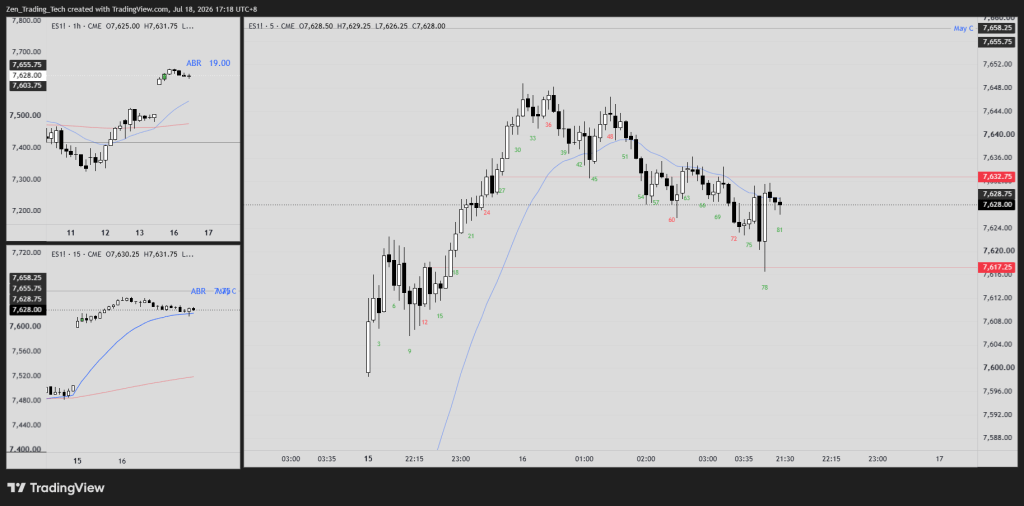
Trading Range Day Version
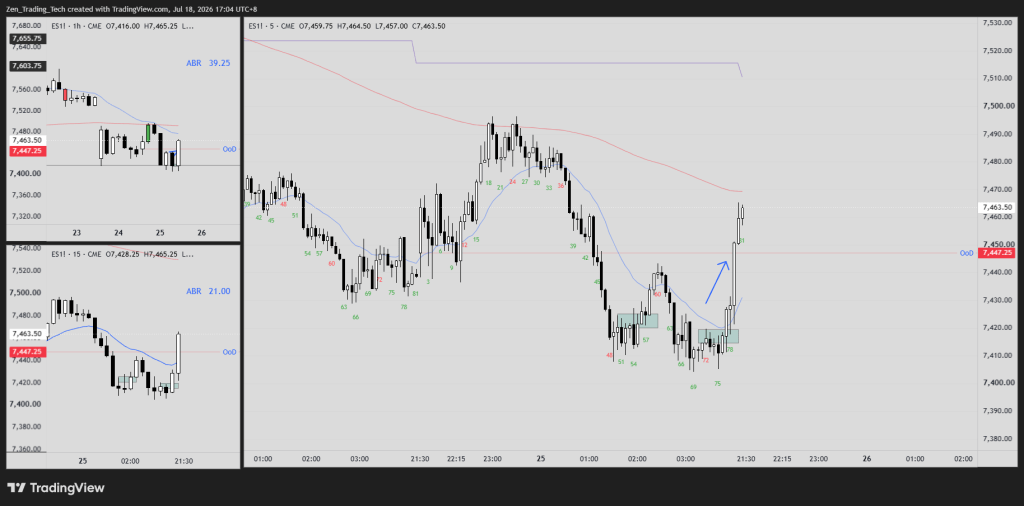
- There’s a second version I found while doing this research.
- Two consecutive bull bars on the open, but then it collapses into a trading range.
- If price trades back down through the open, I look to buy back to above it.
- The bet is that the 80% number will hold
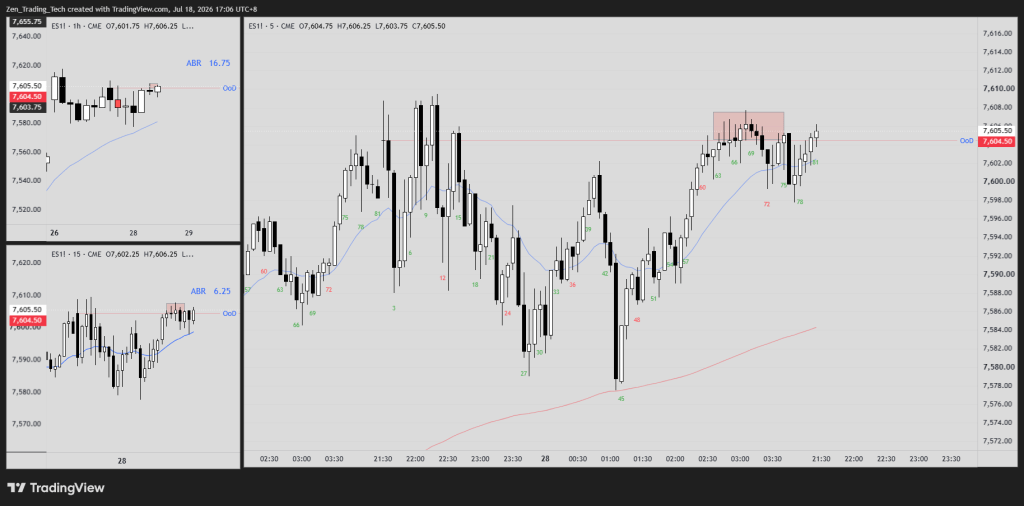
- Everything fails!
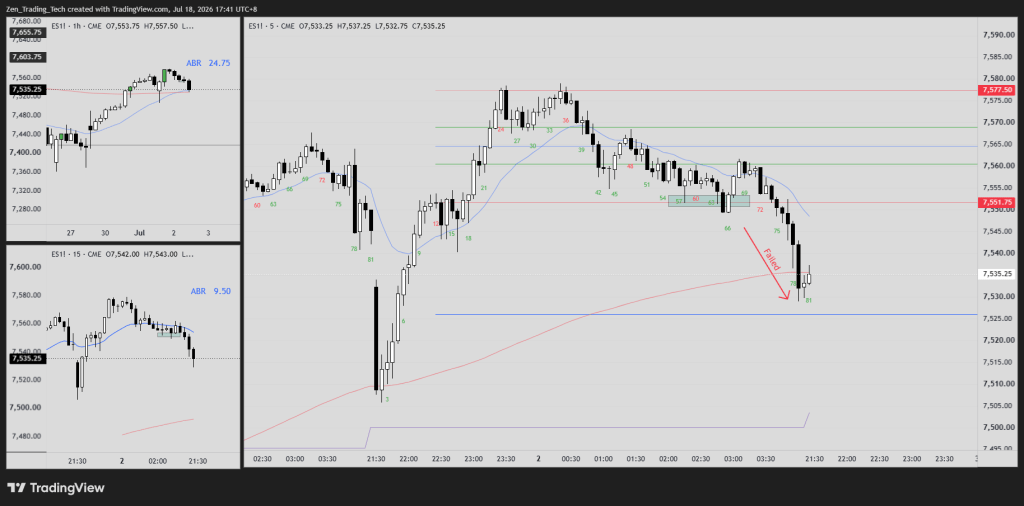
Why This Post Matters More Than the Pattern
Three things this is meant to show, beyond the 80% number:
- How an idea from your own homework turns into research;
- A repeatable process for organising and testing data — this isn’t the only pattern you can run this on; and
- The full arc: observation, testing, trade setup
Take this idea further or use it to inspire your next trading strategy.
Happy trading!
Tim





Leave a comment