Most traders use a moving average, but how many have studied the moving average itself and how to use it?
I n the post below I explore some research ideas that have been useful in my trading and valuable for traders to explore. There is also an indicator below you can use to speed it up!
Free TradingView Indicator
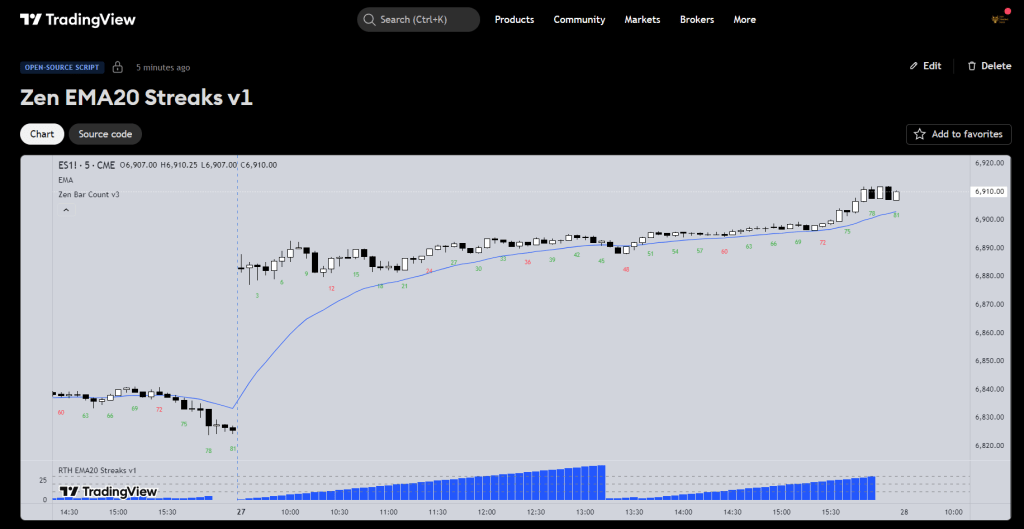
The RTH EMA20 Streaks indicator is a simple way to begin that research.
This free TradingView indicator measures how many consecutive bars trade fully above or below the 20-EMA during the CME Equity Index regular trading session (08:30–15:00 CT). The count resets at the start of each session or when a bar straddles the EMA, allowing for consistent, session-based analysis.
The logic tracks two streak types:
- Bars where both the high and low stay above the EMA20
- Bars where both the high and low stay below the EMA20
The results plot as column counts in the lower pane, with horizontal reference lines at 10, 20, and 30 to mark typical persistence zones. These patterns highlight when markets are maintaining directional pressure and when they are likely to revert toward equilibrium.
The script is fully open source. Settings such as session hours, EMA length, or display style can be adjusted to fit any instrument or study focus.
The goal is practical: to observe how markets move away from the moving average and how they return to it. Over time, these observations form a base for developing structured, repeatable trade ideas built on measured behaviour—not assumptions.
Some Useful Research to Inspire Trading Strategies
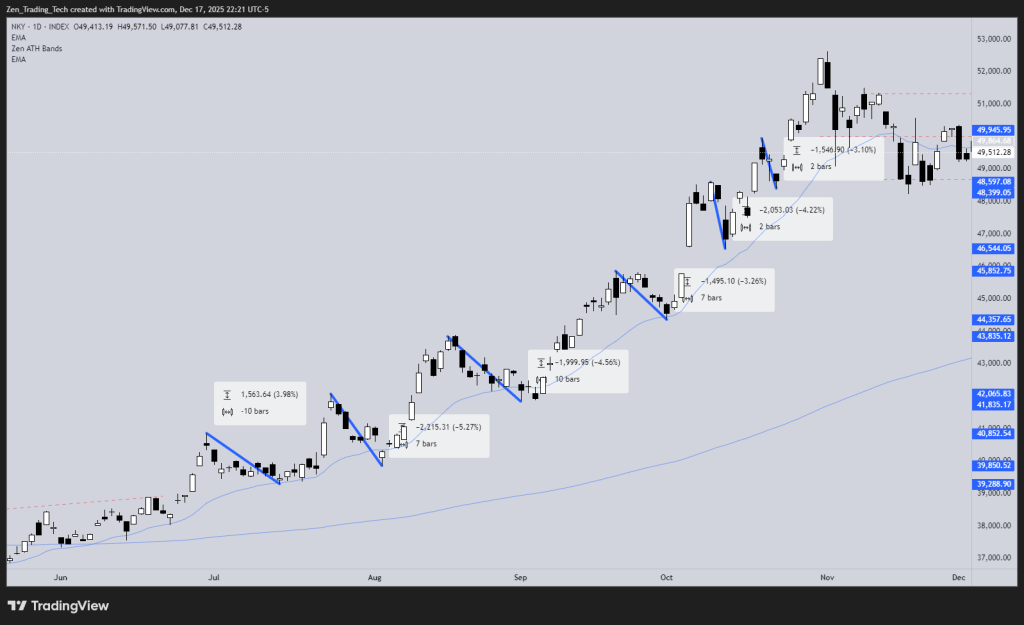
- Streaks either above or below
- Here scatter-plotting streaks of bars >< the moving average at anytime in the RTH session
- Looking at the past 250 trading days

- Grouped arbitrarily
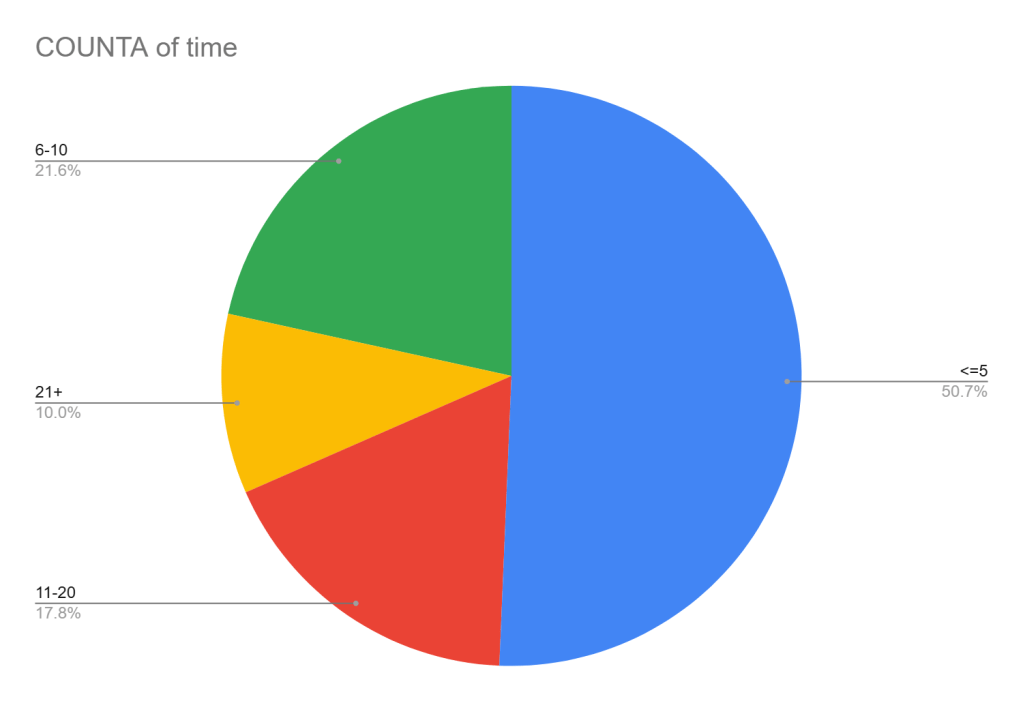
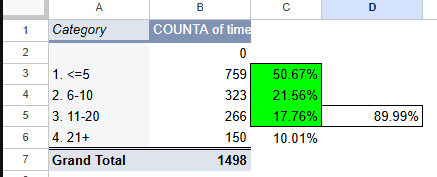
- Data below
- Hence why price action traders use the number of bars above / below the MA to develop assumptions about what comes next.
- 90% of streaks are 20 or less.
- You can use this to develop trading strategies towards or away from the MA
- You can use this to study what comes after a test.
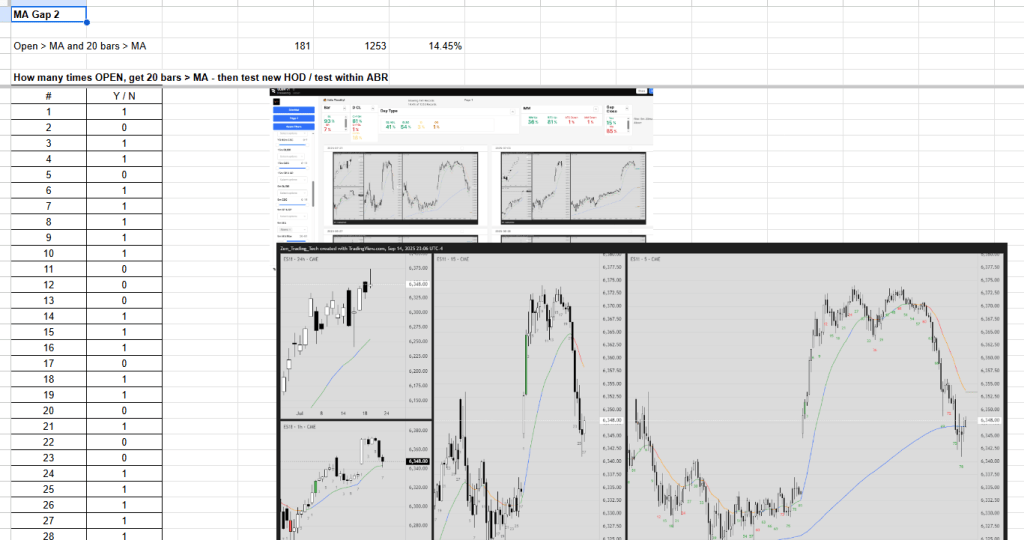
- A useful research for traders is looking at streaks from the open. I’ll leave you to explore that one on your own… its different for Bulls and Bears!
Enjoy!
Tim F


Leave a comment