Premise
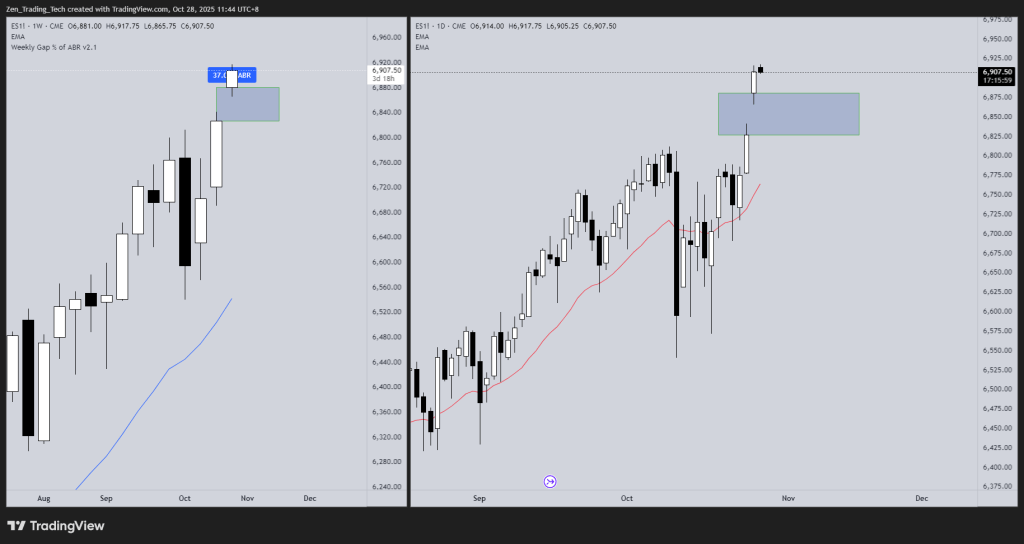
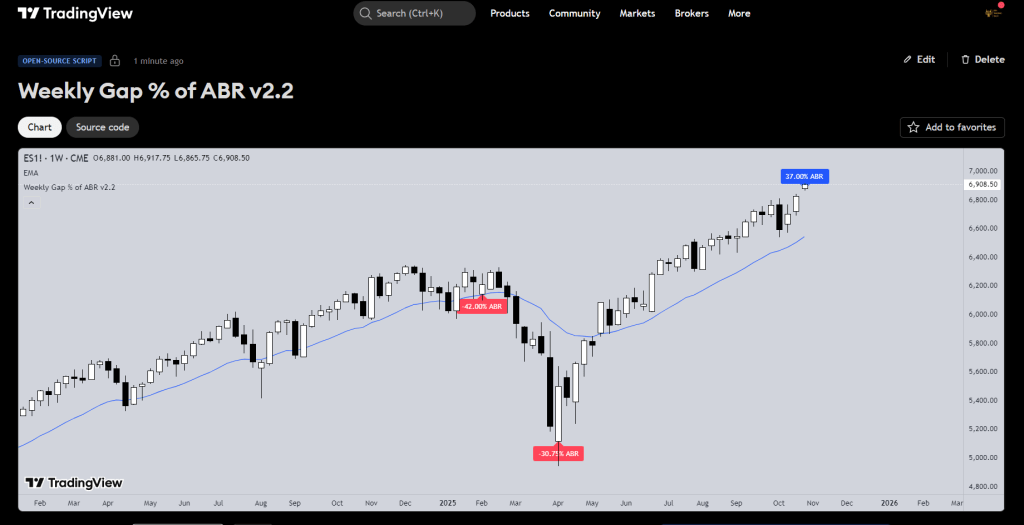
- Monday 27th October 2025 we gapped up 37% of the ABR on the weekly chart
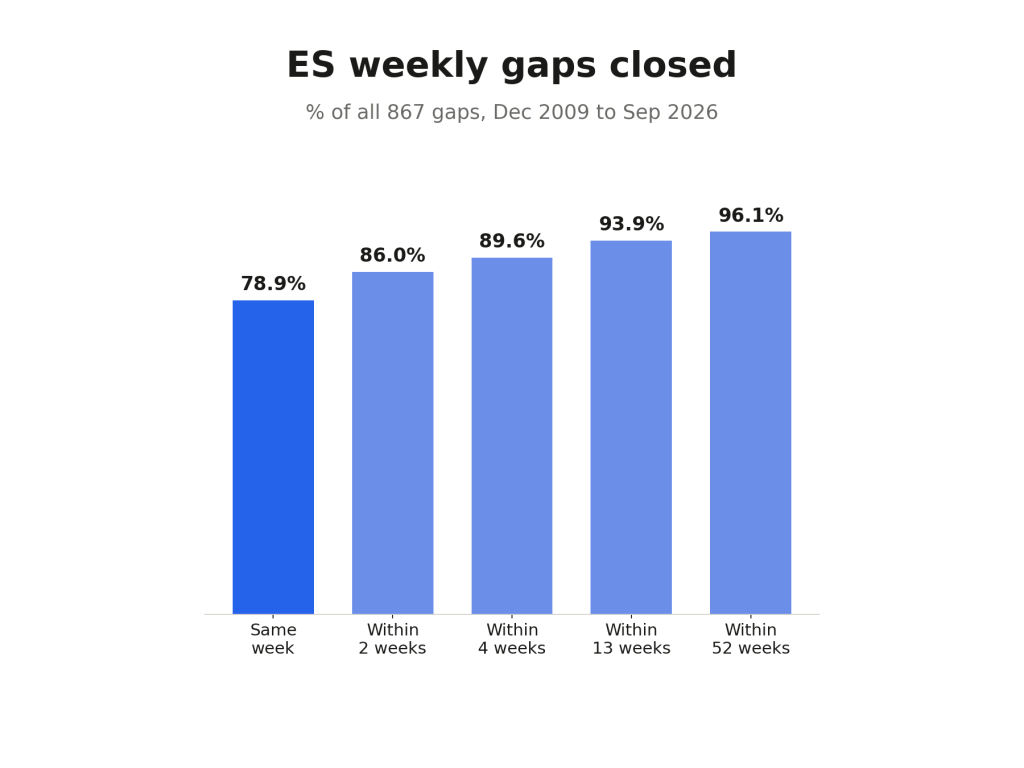
- Open gaps on the weekly chart are rare (ie the close of the week is usually tested in that week)
- In fact it is closed more often in the next few days
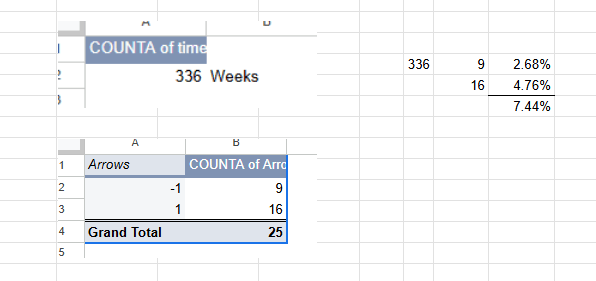
- I could only find a few instances when that happened in the past 5 years so I want to review them here.
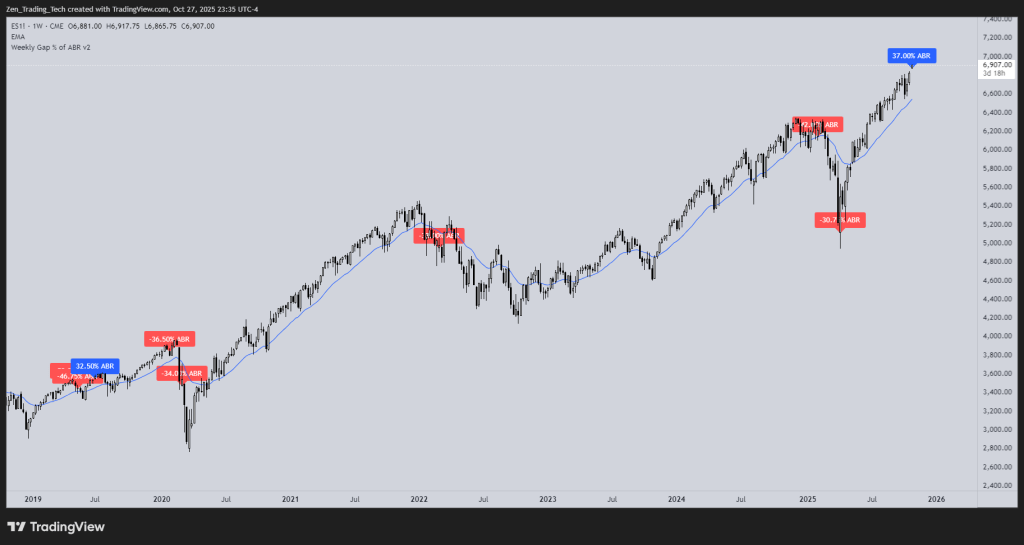
Weekly Gap Ups

27 October 2025
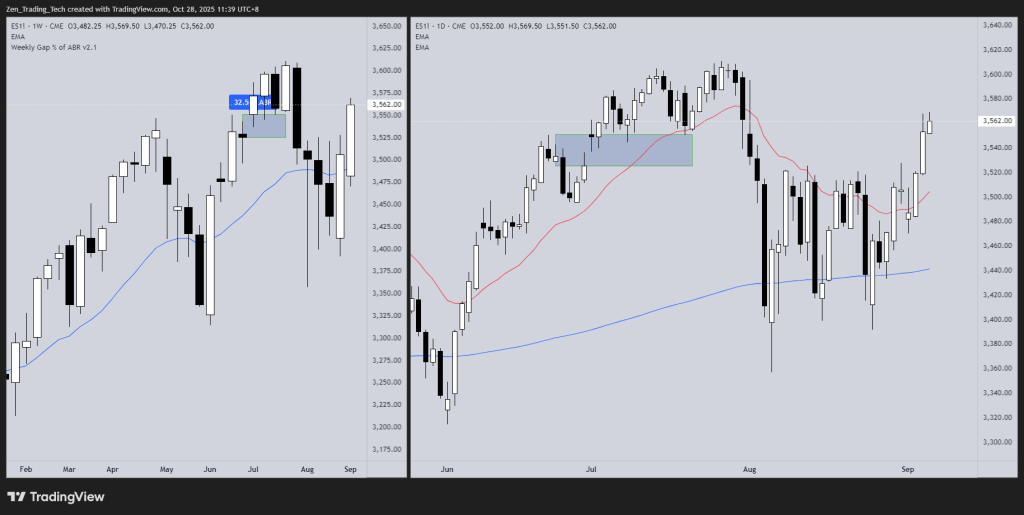
1 July 2019
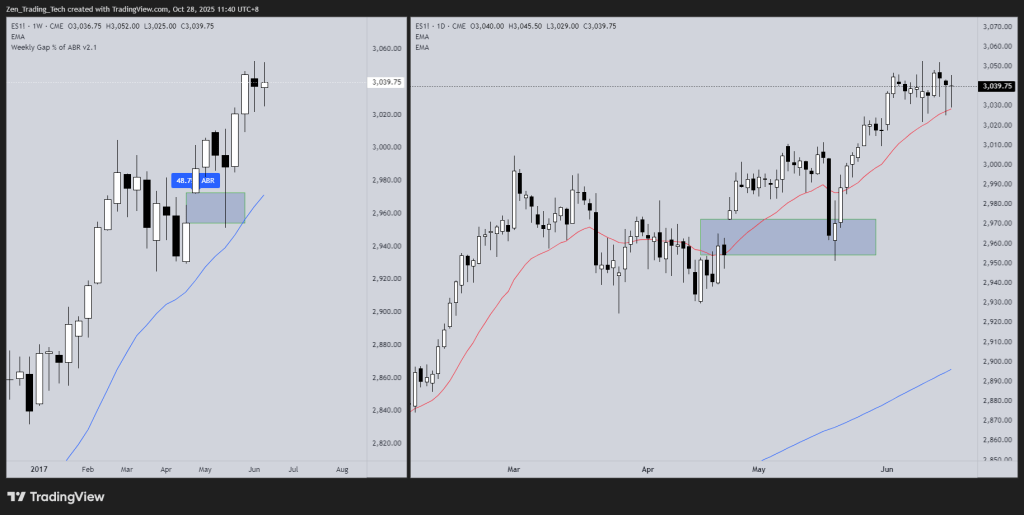
24 April 2017 – Gap Up 48.75%
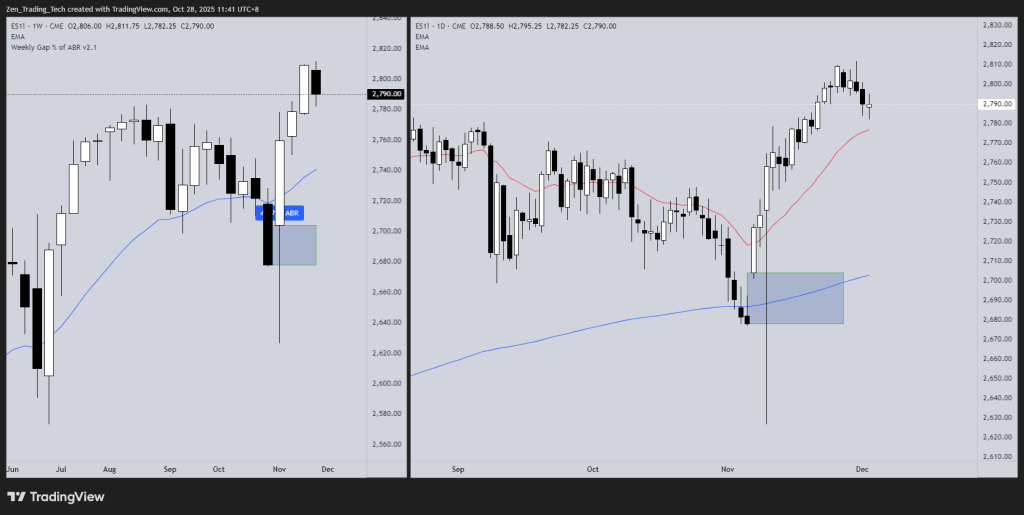
7 November 2016 – Gap Up 47.75%
- Possible for this week, China/US tariff agreements, MAG earnings reports and FOMC – big test catalyst?
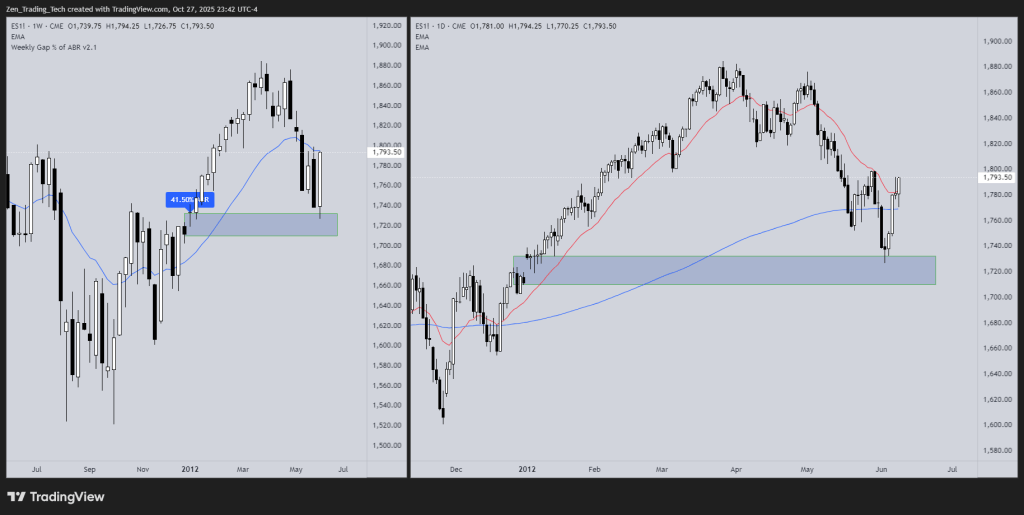
3 January 2012 – Gap Up 41.5%
Weekly Gap Downs
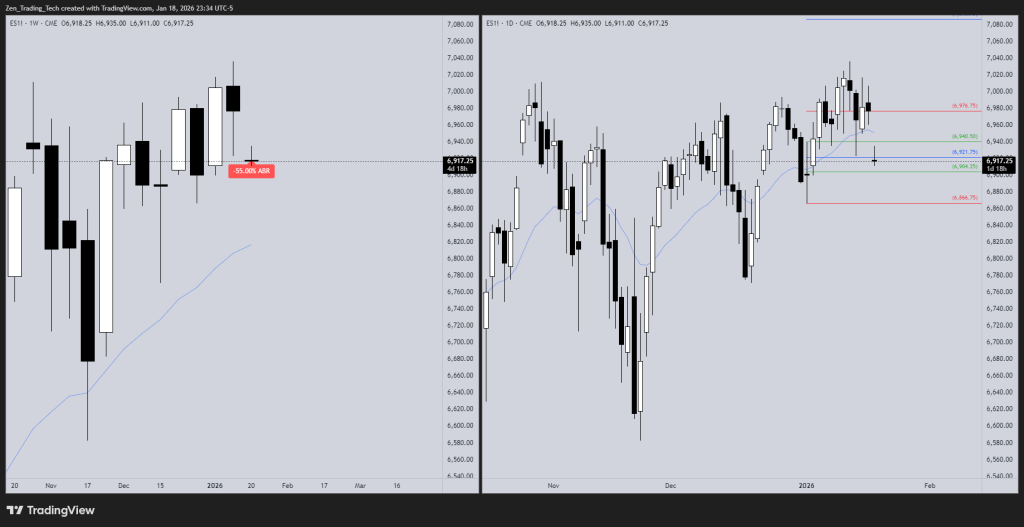
20th Jan 2026 – Big Gap Down 55%
- Will Bulls buy to swing up this week?
7th April 2025 – Big Gap Down 30.75%
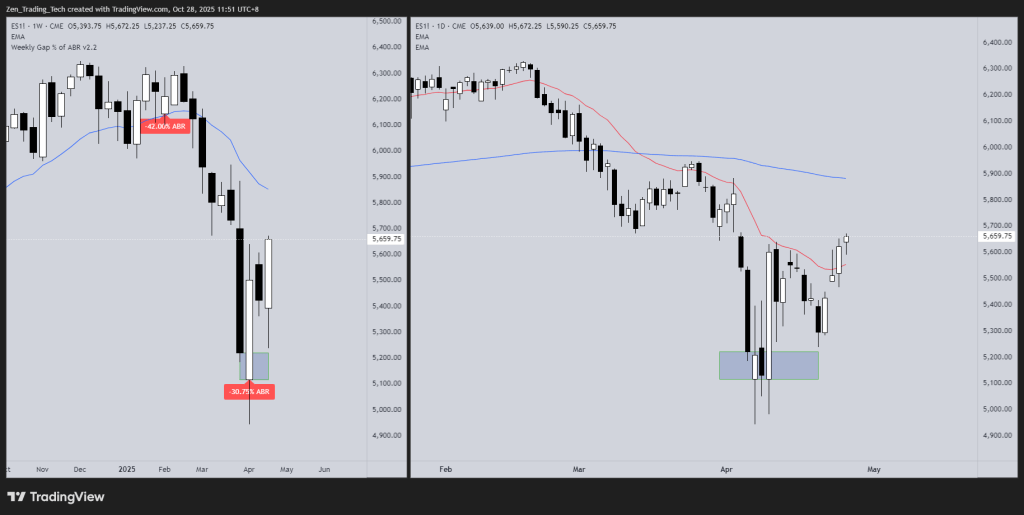
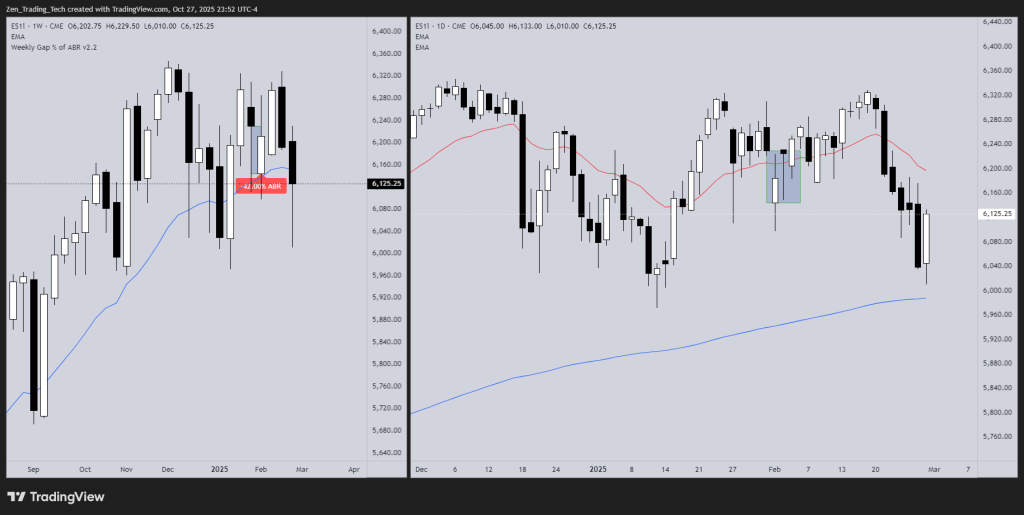
3rd February 2025 – Big Gap Down – 42%
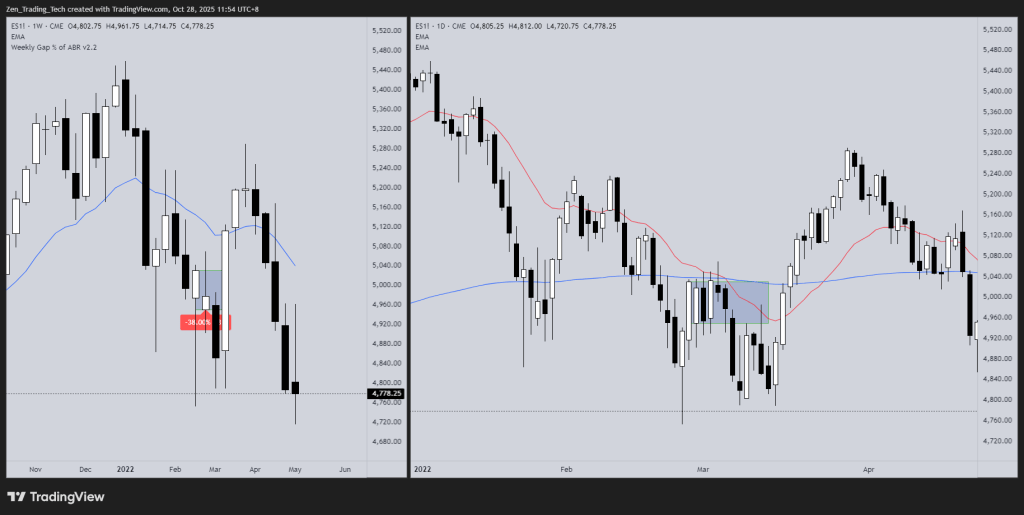
28th February 2022 – Big Gap Down – 38%
TradingView Indicator for Weekly Research
Conclusion
Hopefully this will encourage you to review the weekly chart to plan day trades during the week.
Thanks, Tim F




Leave a Reply