I built a free TradingView indicator that answers one question: is a scalp-sized target realistic on the timeframe I am looking at right now? It’s open source as usual so you can get Claudia or Gemma to make one for your specific software.
Get it here: Zen ABR Scalping Ladder on TradingView. Source and README also on GitHub.
Two bits of vocabulary before we start: ABR is average bar range: take the high minus the low of each bar, average the last n bars. ADR is the same idea on the daily bar, the average daily range.
Traders benefit from considering the impact of volatility on their trading approach. For scalpers looking for one average bar range, this is going to improve hit rate.
The problem
I like to scalp. Duck!
Phew, trader-trolls be throwing theory and equations at my head. Do they read it or just throw it at people?
Scalpers try to take pieces out of a move. Scalping has a high hit rate. You don’t have to be exposed to the market for very long. Most of the time you are flat.
Analogy: As a surfer, if I catch a wave and heaven forbid drop off before it finishes so I can get a new fresh wave, do I get kicked off the beach? No.
Why? Because the first part of that wave is the fun bit, and the next part is a bit slow and boring. It will drop me back at the shore and then I’ve got to carry my board, walk to the rip, paddle all the way out to catch another wave.
If I just catch the first part of the wave and drop off the back, I can catch 5, 10, or 20 times the number of waves. It’s more fun and I like it.
Scalpers approach the market this way. Of course, I know there is a big swing target and we’ll probably get there in a couple of hours, but I can make more money and enjoy myself more by trading larger and more frequently. I don’t care about the target for the trade I’m out of. The trade is finished. I only care about the trade I’m currently in. Not that much, but more than the other one.
A scalp needs a target
Some traders are looking for the one…. number.
5 points on ES. Thirty points on the DAX. Round, memorable, and then never looked at again.
Yet I’ve never been able to come up with a trading system that is purely like this! It makes sense because volatility is going up and down. Therefore your stop is going to go up and down, and so should the target. The only thing that’s going to stay constant will be your trading size, if you choose it to.
Locking points will be too stiff for an environment that is curving and flowing.
Wow – so deep Tim. Write that down.
Volatility drops for three weeks and then this morning it jumps so fast that ten points that used to take one bar now takes five, seconds.
So scalpers typically normalise everything to volatility. An average bar range works well. Because that is what the price action is doing so I should sync myself to that right?
So I asked myself: what if, rather than selecting the perfect average bar range (I usually use 8), I took a range of them and then looked at the graph?
I kinda created an ABR Cloud… lez see how it works.
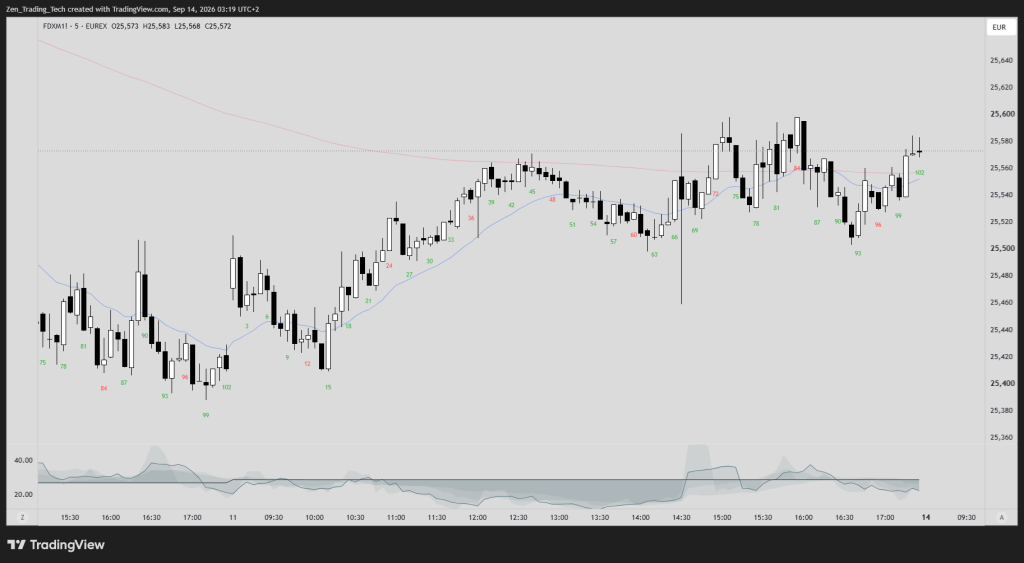
What it does
It sits in its own pane under the chart and draws two things.
- Five ABR lines, at lookbacks 2, 4, 8, 16 and 32 bars. Short lookbacks react fast. Long ones hold the longer picture. Each line has its own switch, colour and width.
- One scalp line, set at a percentage of the average daily range. Default is 10%. Change it to whatever your own scalp target is.
- A grey cloud filling the gap between the scalp line and the ABR lines. Where several lookbacks sit on the same side, the fills stack and the grey darkens on its own.
Everything is drawn in points. That is the whole trick. A twelve-point average bar and a ten-point target are two lines on the same axis, and you can see which is on top without doing any arithmetic.
I’ve made the indicator huge so easier to read obvs you wouldn’t trade with it so large…
Darker line = 10% of a day’s range – lines represent various ABR lookbacks.
How to read the cloud
Simply: is the grey above the line or below it?
- Cloud above the scalp line. An average bar on this timeframe is bigger than your target. One bar can carry the trade. Take the scalp.
- Cloud below the scalp line. An average bar is smaller than your target. The target now needs several bars in a row to get there. Either move up a timeframe or take fewer points.
- Darker grey. More of the lookbacks agree. The fast reading and the slow reading are saying the same thing.
- Lighter grey, lines split either side. The fast and slow readings disagree. Something has just changed. Worth a look at the chart rather than the pane.
That is the whole read. It takes about a second.
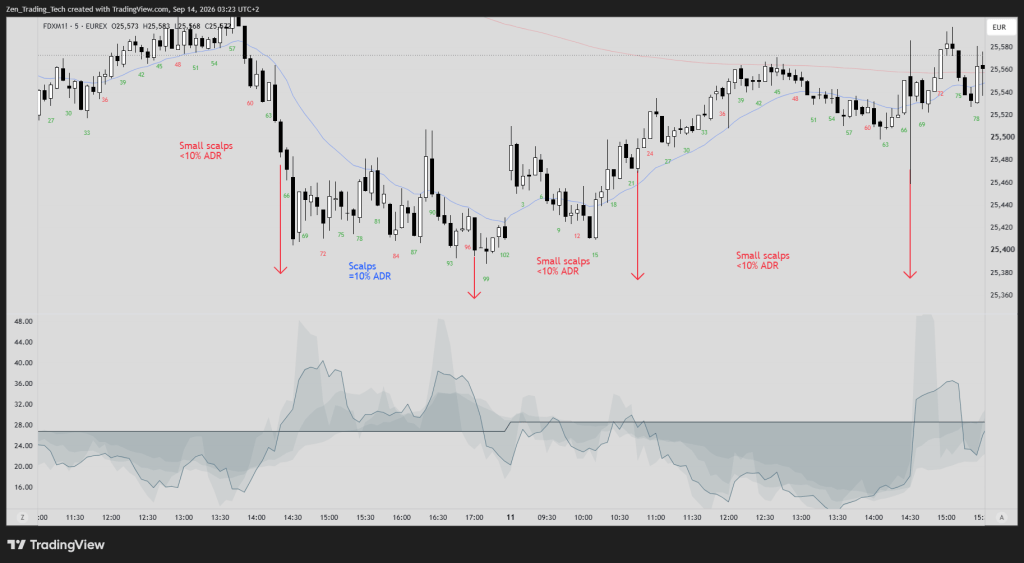
Last 2 days on DAX, I was subconsciously scalping for 20-25 and 40-50 (double scalps) yet why did I suddenly decide to do that?
That is why I woke up Saturday and built this.
ES Example
- 10% ADR = 6 points
- 5 and 10 pt targets on the chart
- Le ABR cloude below it
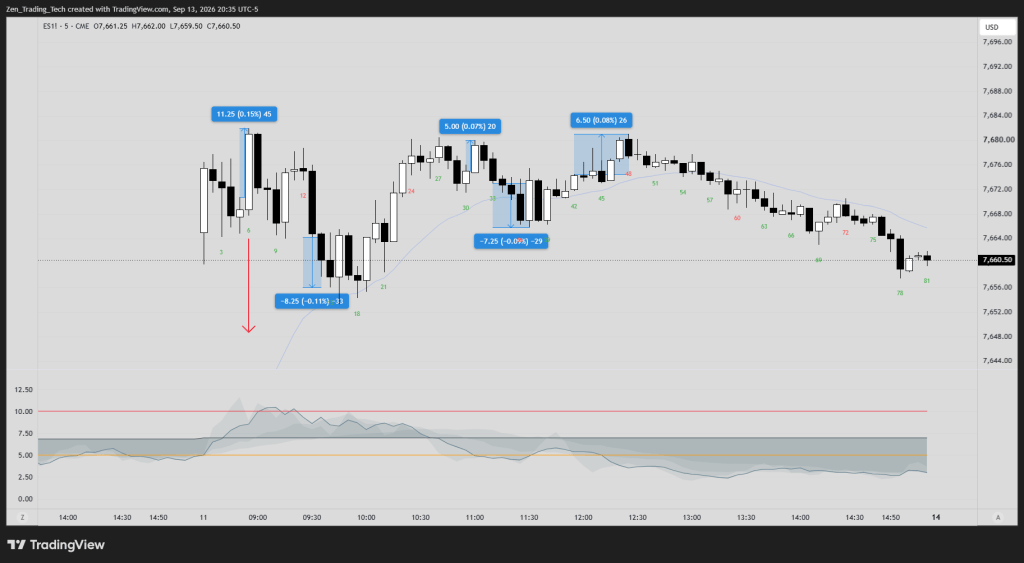
- Bar 5: high one by. After a gap up, traders were able to take 10 points. Look at the cloud there. It’s early in the session so a lot of the lookbacks are quite low, but more important, instead of looking for 5, you are looking to get the higher scalp.
- Bar 11: a third entry short and a reasonable scalp down. All the averages are between 7 and 9 so it would have helped you take 8 points.
- Bar 30: Going for 5 points, what happened? You didn’t get a fill. If you look at the averages, not only are they below the scalp line, but some of them are even below the 5-point line. On the first trade, going for the higher target would have been more prudent. On the second trade, if you’d gone for the lower target, you would have missed. On ES, that’s 3.5 points, so you’ve missed.
- Bar 32 / 33: What do you do on your next trade? You might consider that the traders are taking less than the average, so if you sold a third entry short, going for less than 1 ABR but more than 5pts would have hit. Some good calibration.
- Bar 42: Consecutive bull bars above the MA in a bullish trending trading range day, buy the close, BTC – average sitting just above 5pt line – 5pts was another hit.
Yes, I’m using hindsight. It’s giving me an idea of whether the averages are going up or down. For scalpers looking for one average bar range, this is going to improve hit rate.
Where the 10% comes from
The default scalp line is 10% of the average daily range.
It’s common in day trading technical books, hedge fund scalpers use it in futures markets, I read that 2 market wizards use it and of course my favourite you will also find it in the Brooks Trading Course.
Custom Settings worth knowing
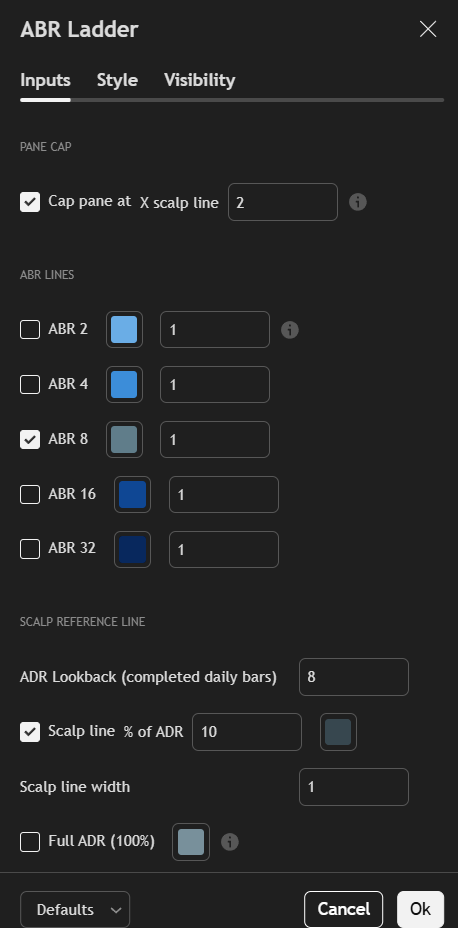
The pane cap. On by default, set at 2x the scalp line. Without it one volatility spike stretches the vertical scale and squashes everything you actually want to read into a flat band at the bottom. With it, anything above the cap draws flat at the cap. The value table still shows the true number.
Middle-three mode. Drops the fastest lookback and the slowest, and fills from the average of ABR 4, 8 and 16 instead. Calmer top edge. I use this one on the DAX.
Fixed levels. Three horizontal point levels, off by default. Use them to pin your own targets into the pane so the ABR lines cross something you recognise.
The value table. Off by default. Turn it on and every live line shows in points and as a percentage of the daily range.
No setup needed. The daily range comes off TradingView’s standard daily bar, so there is no session string to type, no timezone to set and no instrument preset to pick. Drop it on any chart of any market and it works. If you would rather measure the day session only, the code is open and the one line to change is the daily request.
Try it
Put it on the timeframe you actually trade. Set the percentage to your own scalp target.
Now review your past trades and see if this approach can shed some more light on ways to improve.
I’ll do a more detailed post on its use once I play with it more this week.
Enjoy!
Thanks, Tim F



 Zen Trading Tech
Leave a comment