The hypothesis: does the market always go up on September 11th?
Someone said it in the room this morning, after FDAX opened — it’s trading right now as I write this. ES trades tonight. Here’s how I tested it, and what the data shows. Maybe I cnan use it when I trade ES tonight!
Finding the dates
First step: find every real September 11 session in the data. Every session in this data is a normal, full trading day.
FDAX daily data I had lying around runs from 2008 to 2026 — 19 possible years. Six have no real September 11 session: 2010, 2011, 2016, 2021, 2022 fell on weekends, and 2026 hasn’t happened yet as I write this. That leaves 13 years.
ES daily data I have 11 possible years, that will do for now. 2016, 2021, 2022 fell on weekends. 2026 hasn’t happened yet. That leaves 7 years.
What to measure
Two measures of direction: the percent move from that day’s own open, and the percent move from the prior day’s close. The first measures the session itself. The second folds in any overnight gap.
I also want to look at the day’s range — how big a day September 11 actually is, not just which way it closed. To measure that, I need a yardstick: the prior day’s average daily range. In my own indicator I call this ADR Prior — it’s yesterday’s ABR (average bar range, an 8-bar rolling average of the daily range). I use yesterday’s value, not today’s. Today’s own ABR includes today’s range, so measuring today’s range against it is circular.
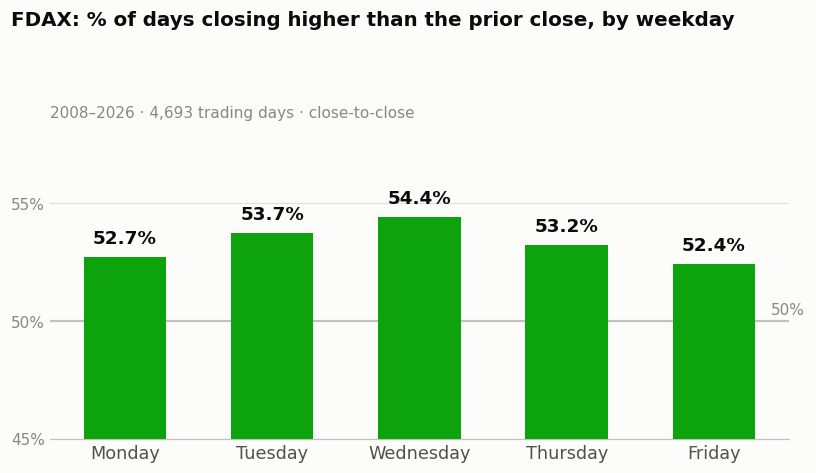
Last thing: a number on its own means nothing without something to compare it to. I need a baseline. So I computed the same two direction measures across each instrument’s entire history — every trading day, not just September 11 — and I compare the September-11-only numbers against that.
Percent move from the open
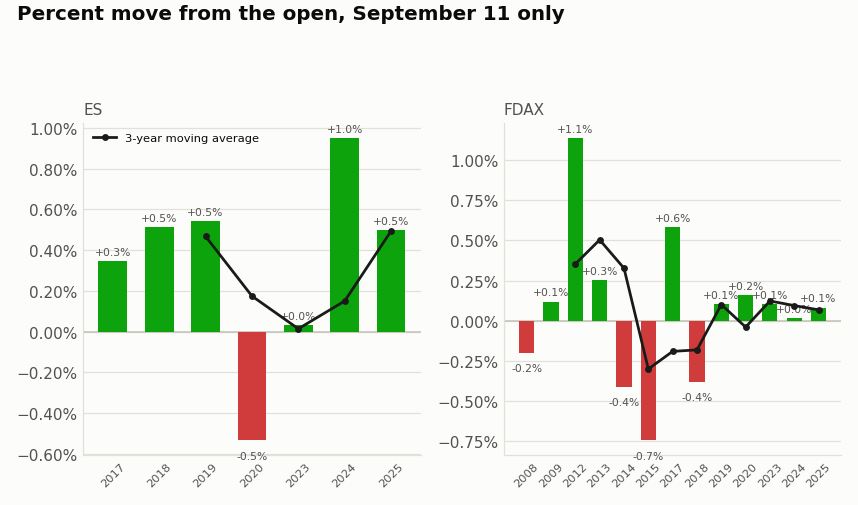
FDAX: 9 of 13 years closed above the open.
ES: 6 of 7 years closed above the open.
The moving average line on both charts shows the same thing the bars do — it moves with whichever recent years were up or down, it doesn’t sit flat.
Percent move from the prior close
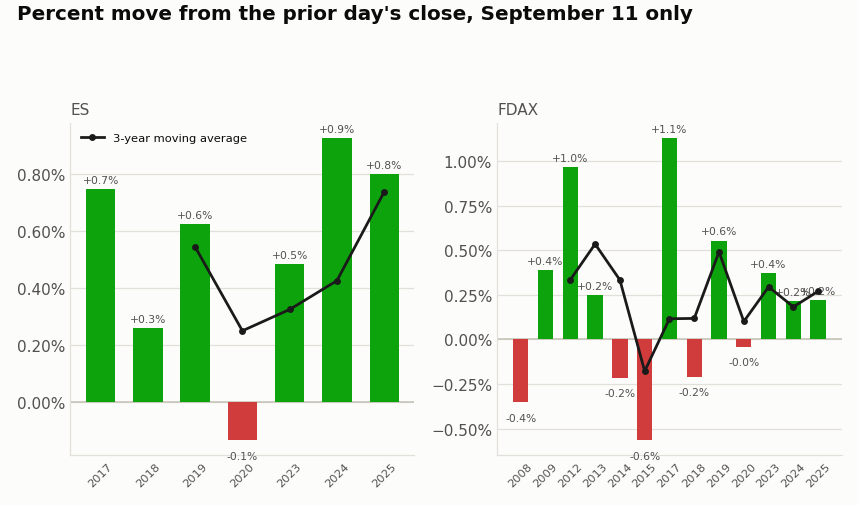
Same two measures, different anchor.
Folding in the overnight gap changes some individual years — FDAX 2020 flips from up-vs-open to down-vs-prior-close, for example — but the overall shape is close to the first chart.
The baseline
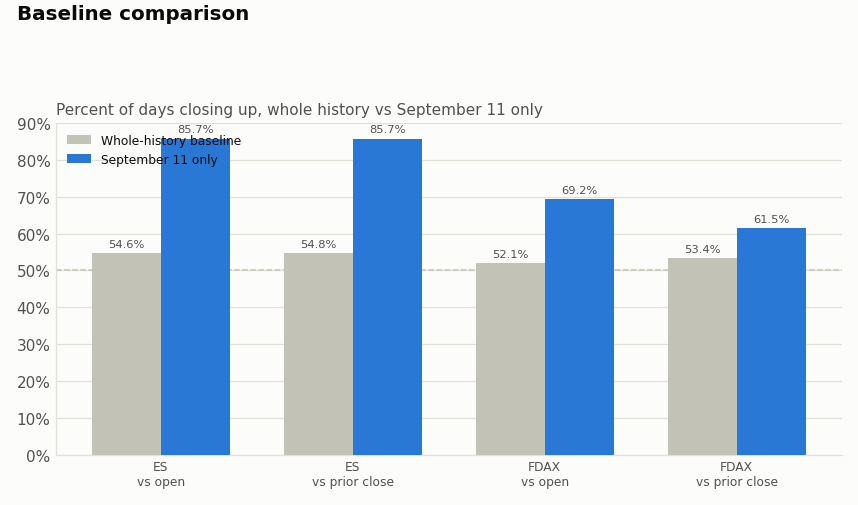
Across FDAX’s whole history, 52.1% of days close above the open, and 53.4% close above the prior close. On September 11 specifically: 69.2% and 61.5%.
Across ES’s whole history, 54.6% of days close above the open, and 54.8% close above the prior close. On September 11 specifically: 85.7% on both measures.
Both instruments read higher on September 11 than on an average day, on both measures.
Range vs the prior day’s ADR
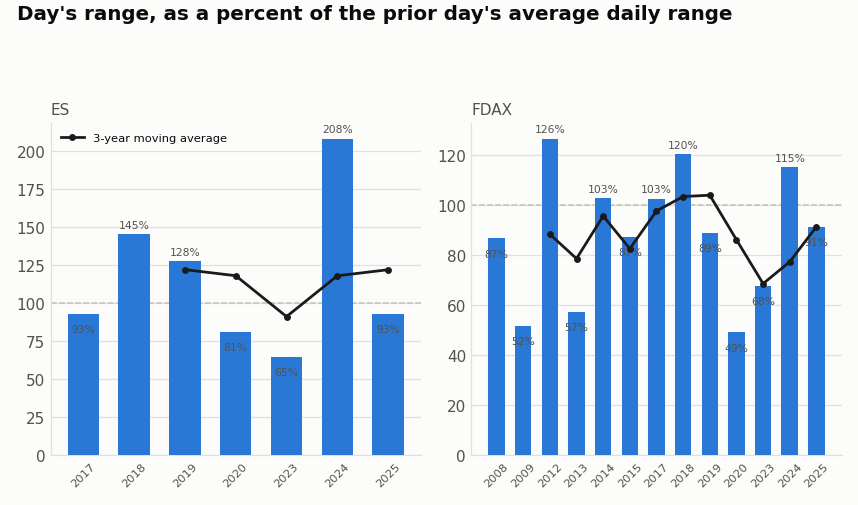
FDAX’s September 11 range averages 88.3% of ADR Prior across the 13 years — below the 100% line, meaning a slightly smaller than average range.
ES’s averages 116.3% across the 7 years — above the line, driven mainly by 2024, which ran 208% of its own ADR Prior.
Reproduce it yourself
Every number above comes from four calculations. Here they are, exactly:
- Percent move from the open: (close − open) ÷ open × 100.
- Percent move from the prior close: (close − prior close) ÷ prior close × 100.
- Percent of days up, based on that delta: count of days where the delta is positive, divided by the number of days.
- Range vs ADR Prior: (high − low) ÷ prior day’s ABR × 100, where ABR is an 8-bar rolling average of the daily range.
ES: CME RTH daily bars, America/Chicago, 2015-10-06 to 2026-09-10, 2,747 trading days in the baseline.
FDAX: Xetra RTH daily bars, Europe/Berlin, 2008-03-12 to 2026-09-10, 4,698 trading days in the baseline.
Date selection: exact calendar date only, no substitution for a weekend.
Tim
Zen Trading Tech



 Zen Trading Tech
Leave a comment