Most Mondays, ES opens away from Friday’s close. Sometimes by a little, sometimes by a lot.
Here’s the question: how often does price trade back to last week’s close — and when?
I first ran this study a few years ago. I update it from time to time put the whole thing on GitHub as a free research kit for you. The data, the rules and the script. So you can see if it fits your trading approach.
The Question
Last week’s close is one of the few levels you can mark before the week even starts.
So the research question is simple. When the week opens with a gap, I want to know four things:
- How often does price trade back to last week’s close in the same week?
- Which day of the week does it happen?
- Does the size of the gap change the answer?
- If the gap does not close that week, how many weeks does it take?
I am not going to tell you how to trade it. Scalp it, swing it, use it as a target, use it as a warning — that is your call and it depends on your style. This study tells you where price tends to go.
How I Measured It
A few rules:
- Day session only (RTH — regular trading hours, 08:30 to 15:15 Chicago). On a 24-hour chart the weekly gap nearly disappears.
- Week open = the first trading day’s open. Week close = the last trading day’s close.
- Weekly gap = this week’s open minus last week’s close.
- Closed = from the gap open onward, any day’s high and low straddle last week’s close.
- First trading day = Monday, or Tuesday when Monday is a holiday.
RTH has gaps, ETH is continuous hence no-gaps (Or impossible to trade gaps).
The gap size is important. I do not measure gaps in points. The same gap in points means far less in 2026 than it did in 2012 — ES is more than four times the price.
So I size every gap against ABR (average bar range). It is the average high-to-low range of the last 8 bars. Here I use the last 8 weekly bars. A gap of 10% means the week opened one tenth of an average week’s range away from last week’s close.
I have also done the study as a % of price, you can do that as well.
The Data
- ES continuous back-adjusted contract, RTH only
- Dec 2009 to 11 Sep 2026
- 875 weeks
- 867 of them opened with a gap (99.1% of weeks — only 8 flat opens)
- 470 gaps up, 397 gaps down
How Often the Gap Closes
High probabability.
| All 867 weekly gaps | Gaps | % of all gaps |
|---|---|---|
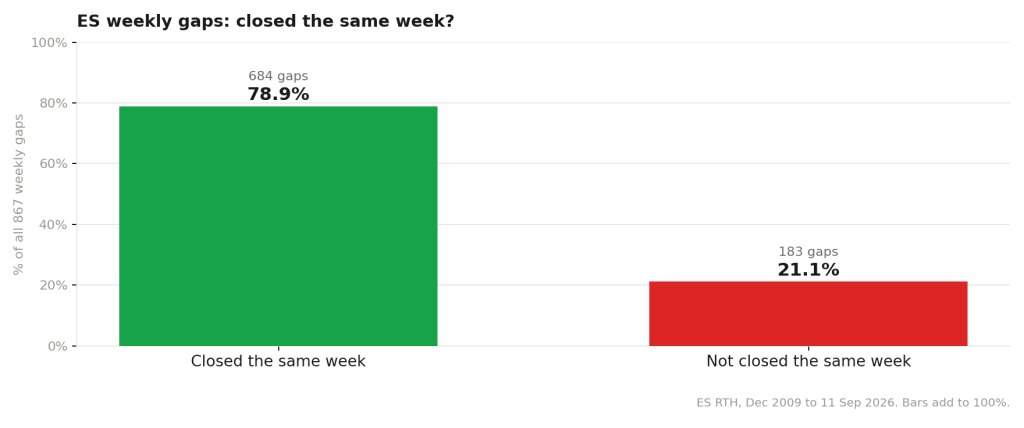
| Closed the same week | 684 | 78.9% |
| Not closed that week | 183 | 21.1% |
| Total | 867 | 100% |
Of the 78.9%, if not on Monday, then when?
| The 684 gaps that closed the same week | Gaps | % of the 684 |
|---|---|---|
| Closed on the first trading day | 475 | 69.4% |
| Closed later that week | 209 | 30.6% |
| Total | 684 | 100% |
About 4 weeks in 5, price trades back to last week’s close within the week. More than half of all gaps (475 of 867) closed on the first trading day – if holiday Monday, that means Tuesday.
Gaps down closed a little more often than gaps up: 82.6% of 397 against 75.7% of 470. Makes sense because bullish tendency of ES.
Of the 684 gaps that closed the same week, 84.1% had closed by the second trading day. Only 7.5% of them waited past the third trading day.
Gap Size Changes Hit Rate
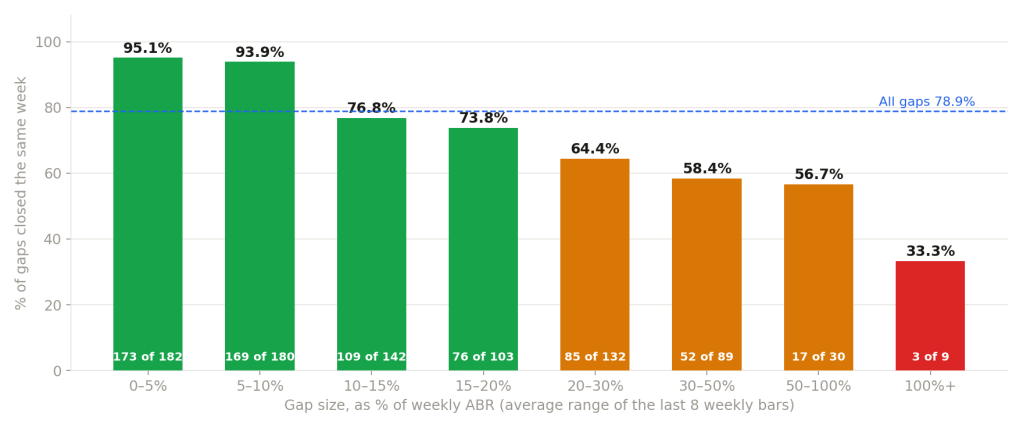
The closure rate depends on how big the gap is.
| Gap size (% of weekly ABR) | Gaps | Closed same week | Closed within 4 weeks |
|---|---|---|---|
| 0–5% | 182 | 95.1% | 96.2% |
| 5–10% | 180 | 93.9% | 98.3% |
| 10–15% | 142 | 76.8% | 88.0% |
| 15–20% | 103 | 73.8% | 87.4% |
| 20–30% | 132 | 64.4% | 84.8% |
| 30–50% | 89 | 58.4% | 77.5% |
| 50–100% | 30 | 56.7% | 76.7% |
| 100%+ | 9 | 33.3% | 66.7% |
Small gaps under 10% of weekly ABR: 342 of 362 closed the same week, and 297 of those on the first trading day.
Big gaps of 30% or more: 72 of 128 closed the same week. Only 22 of those closed on the first trading day.
n=9 in the 100%+ group is thin — treat those as examples, not a rate.
How Many Weeks Until It Closes?
A gap that misses its own week does not disappear. So I tracked every one of them forward until price traded back to the level.
| Time since the gap open | Gaps closed | % of all gaps |
|---|---|---|
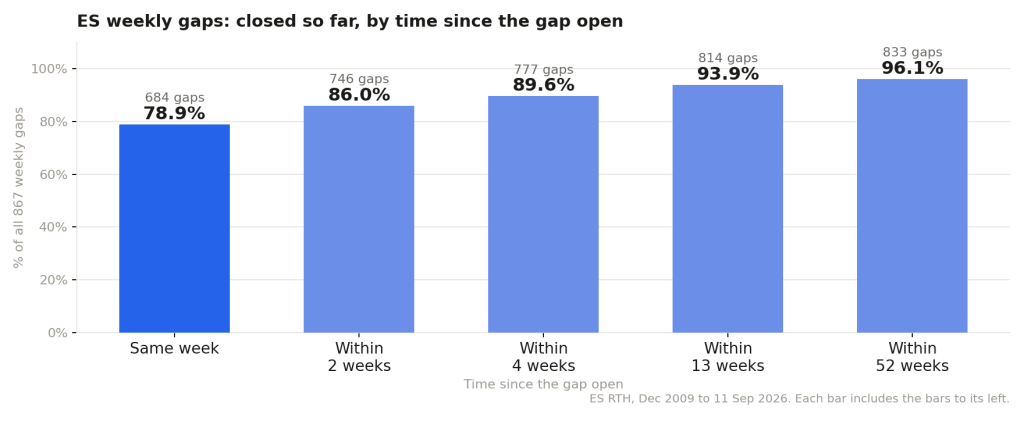
| Same week | 684 | 78.9% |
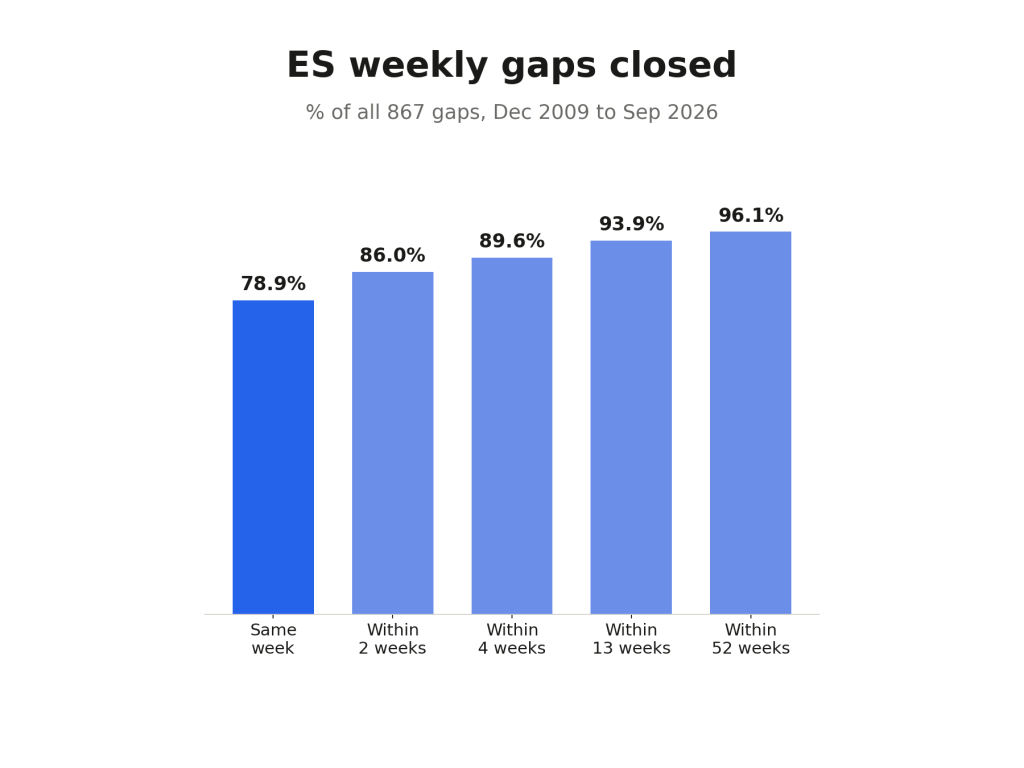
| Within 2 weeks | 746 | 86.0% |
| Within 4 weeks | 777 | 89.6% |
| Within 13 weeks | 814 | 93.9% |
| Within 52 weeks | 833 | 96.1% |
Of the 183 gaps that missed their own week, 62 closed the very next week. 16 took more than a year.
And 18 gaps are still open as of 11 Sep 2026. 16 of the 18 are gaps up — ES rallied away and has not come back down to those closes.
Do Your Own Research — The Free Kit
Everything is in the Weekly Gap Close research kit on GitHub:
- The data — 4,254 ES daily RTH bars, Oct 2009 to Sep 2026
- The rules — the exact definitions above, written out step by step
- An AI prompt — paste it into Claude with the CSV and it builds the report
- A Python script — reproduces every number in this post
- The reference report — so you can check your result against mine
Run it on the ES file first. If you get 867 gaps and 684 closed the same week, your setup matches mine. Then point it at NQ, the DAX, the Hang Seng — or whatever you trade — and see if the same level holds up there.
If you want to see what the really big weekly gaps looked like on the chart, I went through a few of them in Big Gap Up on the Weekly Chart.
Data beats opinion. Check my numbers, and report back with what you find on your market.
Happy trading!
Tim
Zen Trading Tech


 Zen Trading Tech
Leave a comment