Summary
- I want to research trend days so I can improve my ability to trade them, but how do I get a list to study?
- I tried and failed to get AI to find me all the trend days on ES.
- So I classified them manually – all 2,716 days in my database.
- I will shortly attach this list to my public GitHub so you can use it without doing that.
- I’ve attached preliminary stats below. Spoiler: the 20% number held up. My definition of a trend day did not.
- I will use this to refine my trading by day type, and I’m interested to see where other traders take it.
- This post took three weeks instead of the three hours I budgeted.
Starting Hypothesis
“Trend days occur 20% of the time.”
“Most parts of most days are trading range days.”
Classifying Trend Days
Why I care what kind of day it is
I take several trades a session. Open, midday, close. The same setup does not pay the same on every day, and the thing that changes it most is what kind of day I am in.
On a bull trend day, buying the moving average is something you keep doing.
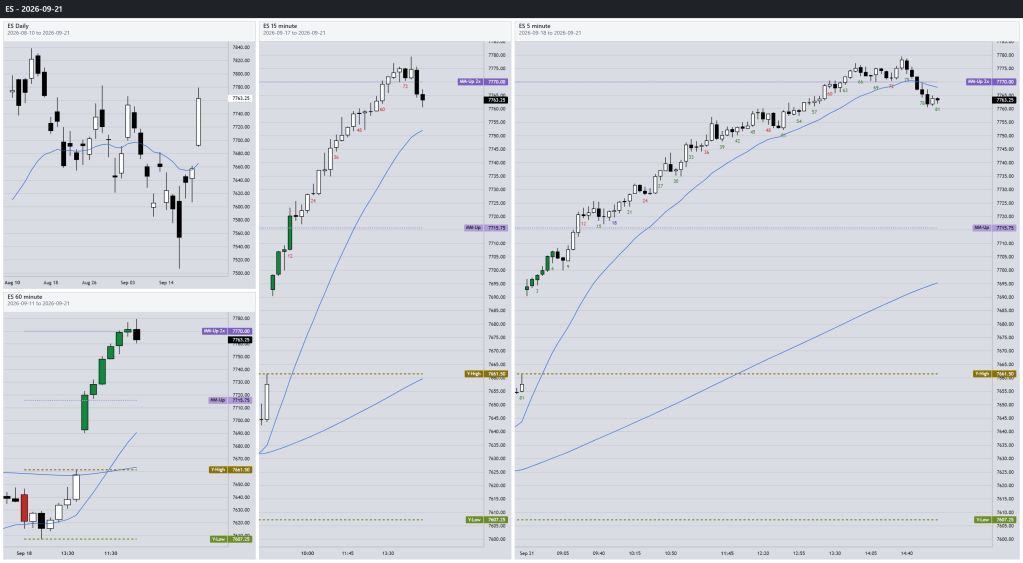
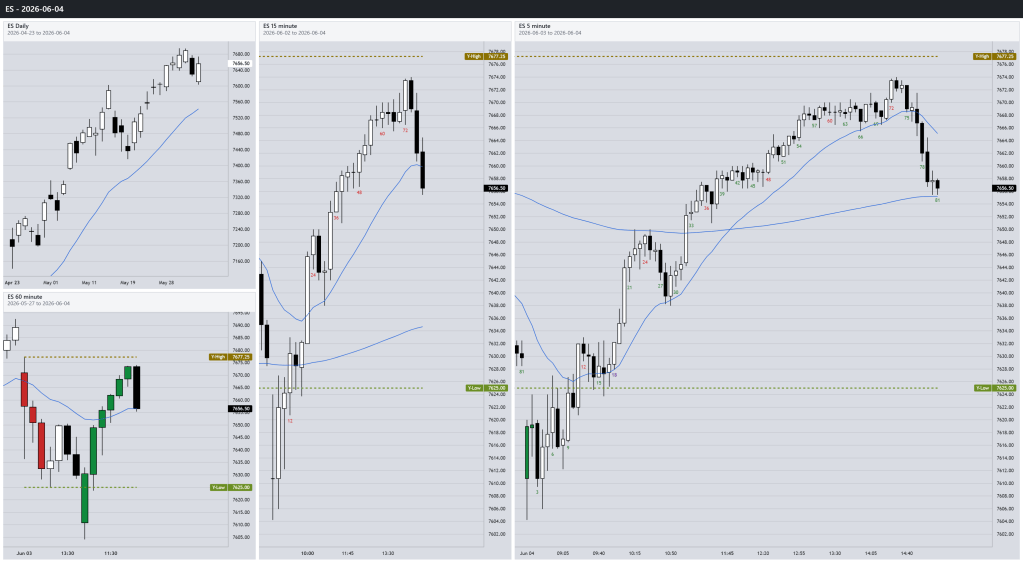
On a trading range day, that same trade keeps breaking even. Fading the breakouts and the extremes is the high-hit-rate trade instead.
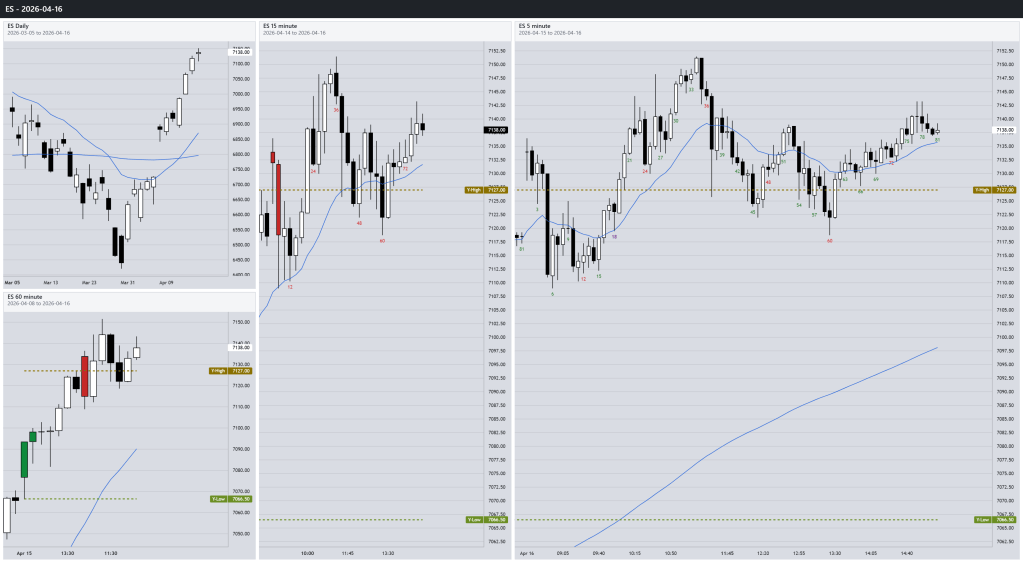
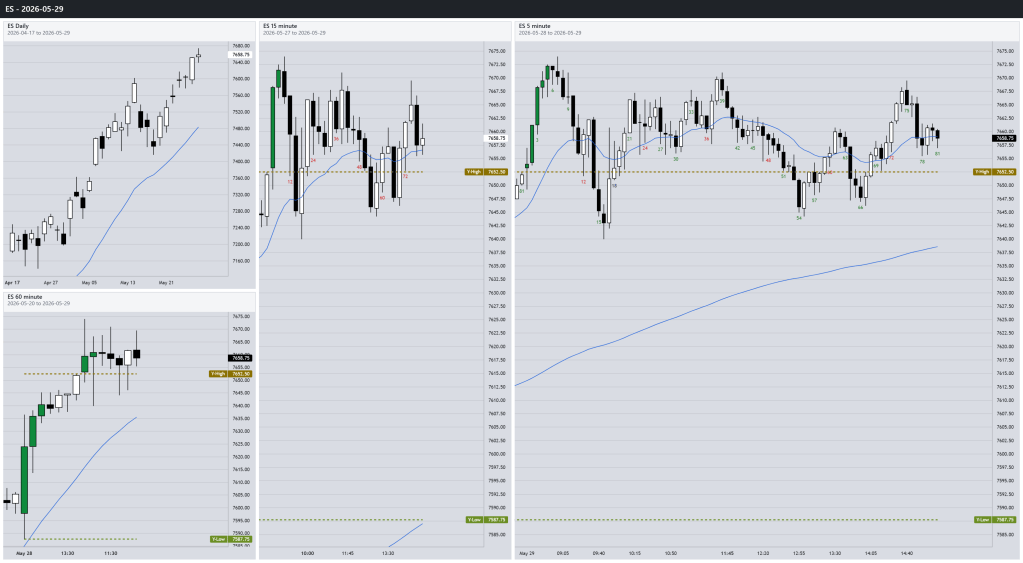
So “what kind of day is this” is not an academic question for me. It changes which strategy I should be running, and how hard I should push it.
Leg Counting
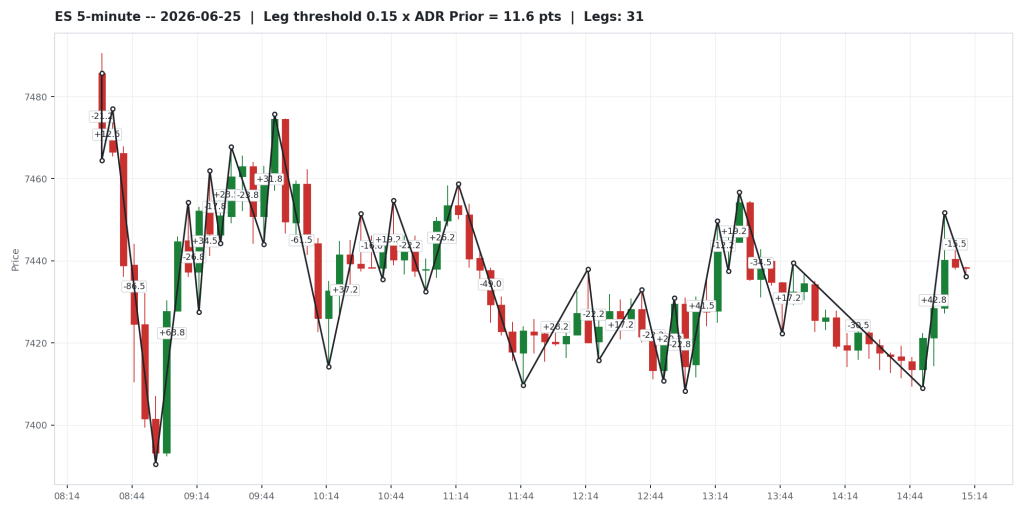
My first idea was leg counting, from my earlier post. It did not separate trend days. It does help on trading range days, which I will cover in a later post.
Ask AI
Next I asked AI. Together we built a trend score from six ideas: how far the day moves from the open, how big the day is, where it closes, how many legs it has, how equal the legs are, and the biggest leg against the trend. Claudia liked the first 2 hours 🙂 ?
It failed. The leg count punishes big days and down days, because both make more legs for the same shape. And a big first two hours, a range over 70% of the average daily range, turned out to be the weakest sign of a trend day.
Another fail. Let’s do it the hard way.
Did you hear the one about the constipated accountant?
He had to work it out with a pencil.
Manual Labour
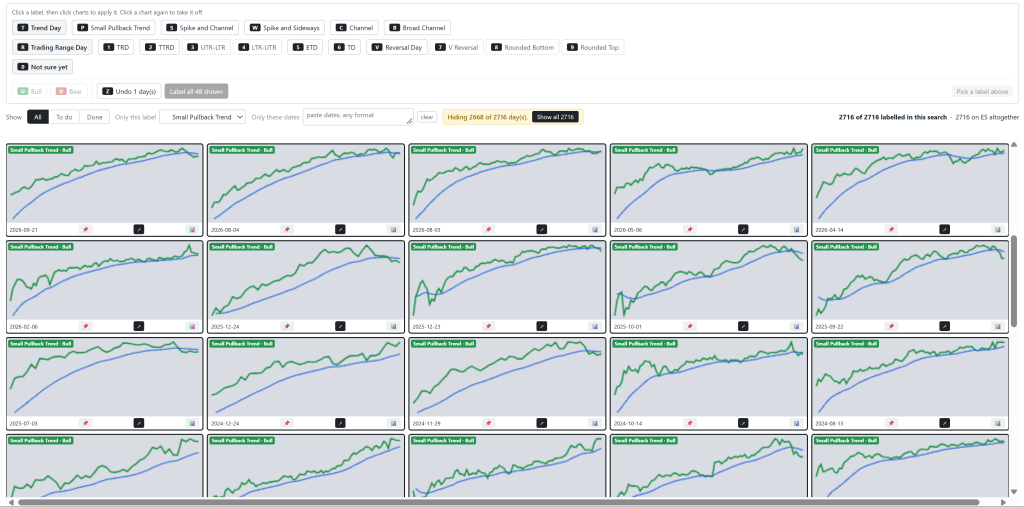
- I started with price action, on the strongest trending days first.
- My goal was to come up with as few categories as possible.
- I decided a day is either a TREND DAY or a TRADING RANGE DAY (TRD).
Note: My eyes are going to see things that the stats are going to confirm later, but once I’m finished manually classifying them, I’m going to ask the computer to challenge me on the edge cases.
What does it mean to be trendy?
Before you can label anything you need names. Mine come from Al Brooks’s course, which is the framework I trade from. In price action, trend strength is a function of what the other trader can achieve. Briefly, in my own words:
Trend day. The day goes one way and holds it. It closes near one end of its range. You trade with it and only with it. You cannot make much if any money doing the opposite.
But there are flavours of trend day.
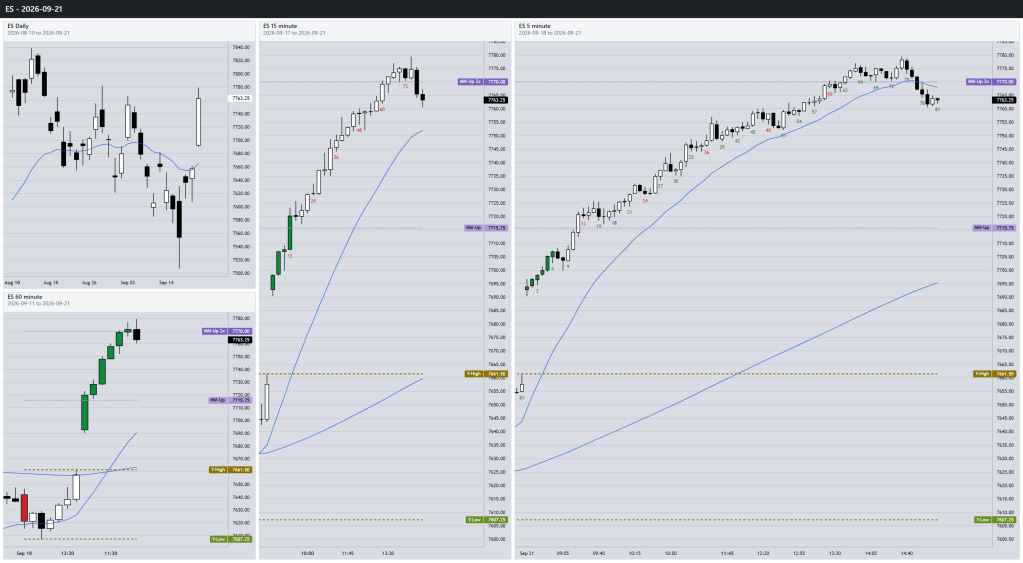
Small pullback trend.
- Microchannel on a higher time frame
- Counter-trend traders cannot make money with stop orders or limit orders
- The pullbacks are so shallow you can barely see them.
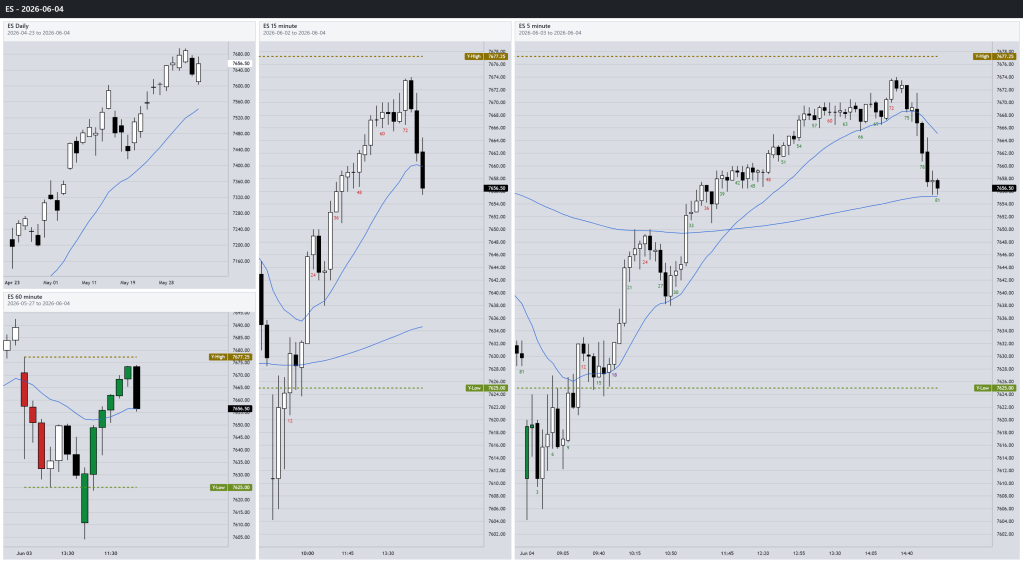
Channel.
- Small pullback trend on a higher time frame
- Counter-trend traders cannot make money with stop orders but can with limit orders.
- Gaps between the legs. You can see where you would have got in again.
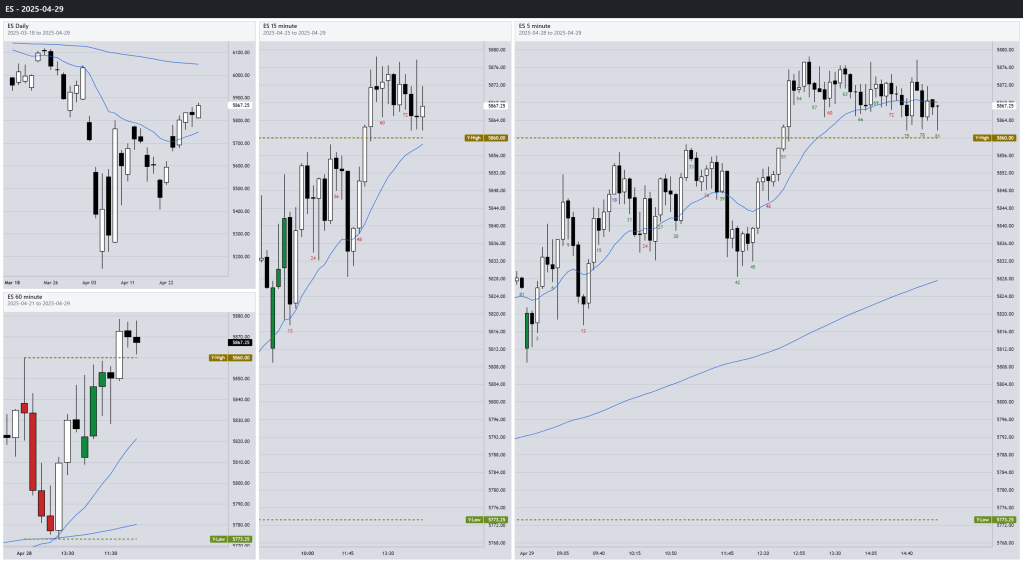
Broad channel.
- Channel on a higher time frame
- Counter-trend traders can make money with either stop orders or limit orders.
- Wide enough that you could have traded both sides. One side was still better.
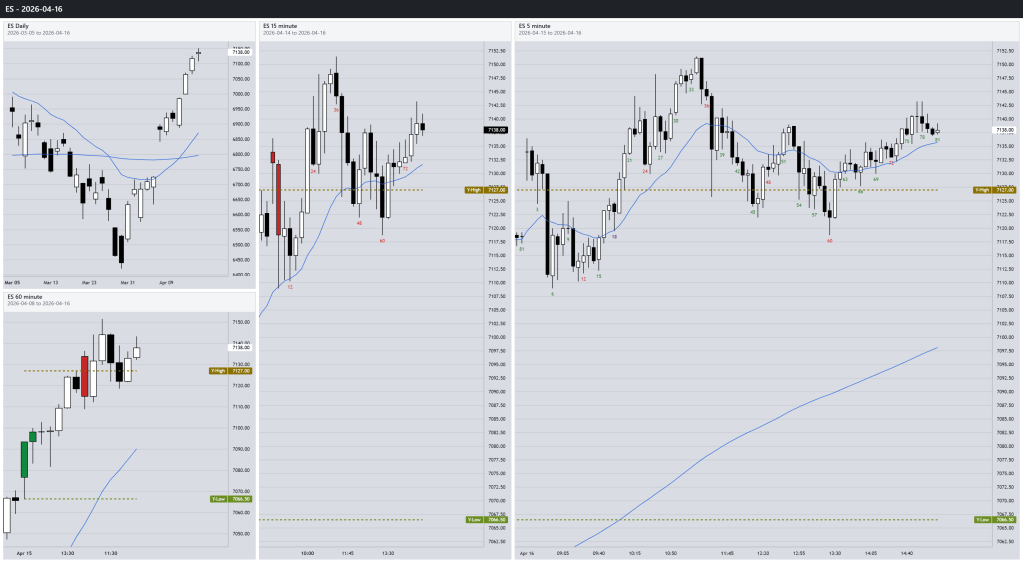
Trading range day.
- Two-sided trading all day.
- Usually multiple trading ranges connected by spikes.
- Breakouts failed, so fading the extremes was the trade.
Although I had many more, my final categories for trend days are small pullback trend and channel. Broad channel and everything else is a TRD.
Now, how to find them??
60 min chart
- I started with days that have 7 consecutive bull bars on the 60 min chart
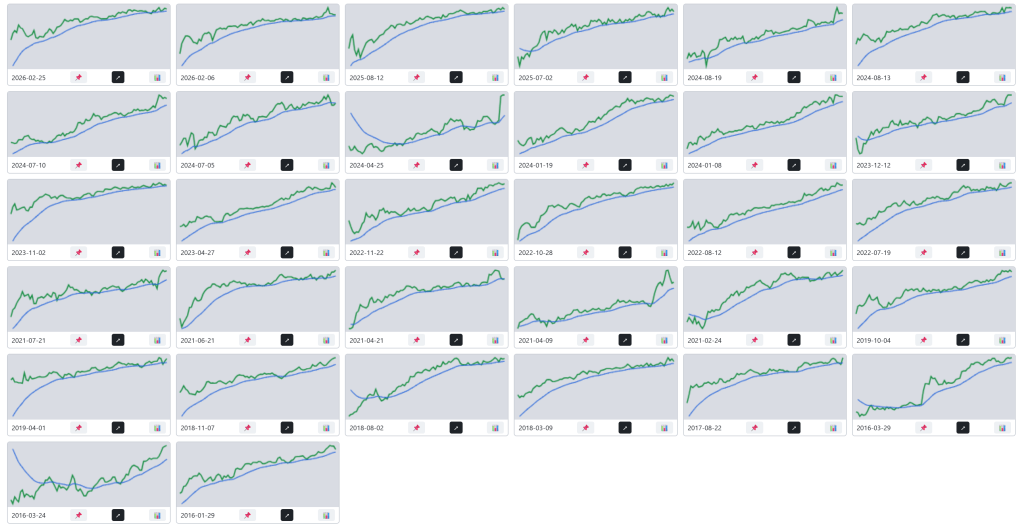
- Initial observations:
- High and low of day. Low of the day in the first third, high of the day in the last third. No days with the high or low in the middle.
- Moving average. The 20 EMA below acts as support. So the number of touches, crosses and switch-backs might be key.
- Open of the day. All of these move away from the open in the trending direction, some after a short trading range. They don’t seem to come back to the open.
- Classification. A mix of small pullback trends and channels. None fit into trading range days. So far, good start.
Next step: 5 to 6 bull bars, so some all-day versions drop off. I gave it a cheeky sort by how much it touched the MA, based on the earlier observation.
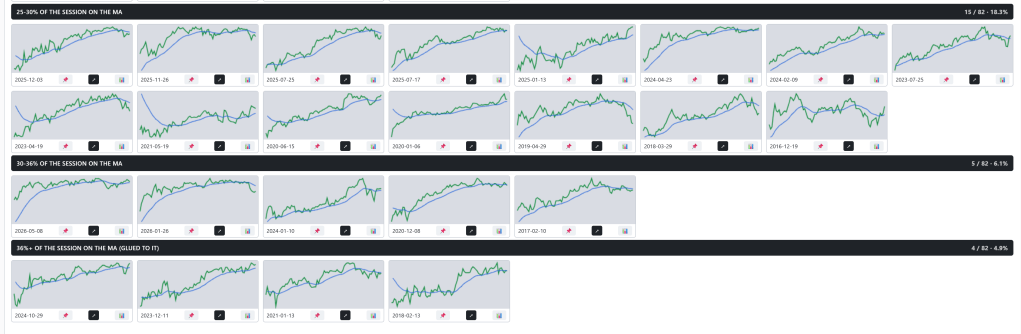
Now I’m seeing more two-sided trading. It doesn’t necessarily mean I want to be short, but you can see traders making money selling above highs. You’ve got some rounded tops and days that don’t finish so strongly.
Those three hunches – the open, the 20 EMA, and where the high and low sit – became the three measures below.
Summary Results
Results at a glance
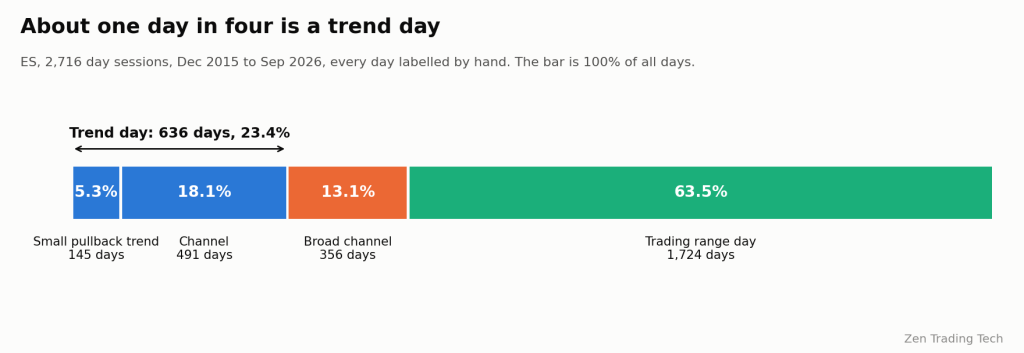
- 23.4% of 2,716 ES days are trend days (small pullback trend or channel).
- Days that crossed their own open 8 or more times were almost never trend days.
- A day that makes its high or low in the middle third of the session is almost always a trading range day.
- Up-trends run tighter than down-trends.
The three measures below show where each of these comes from.
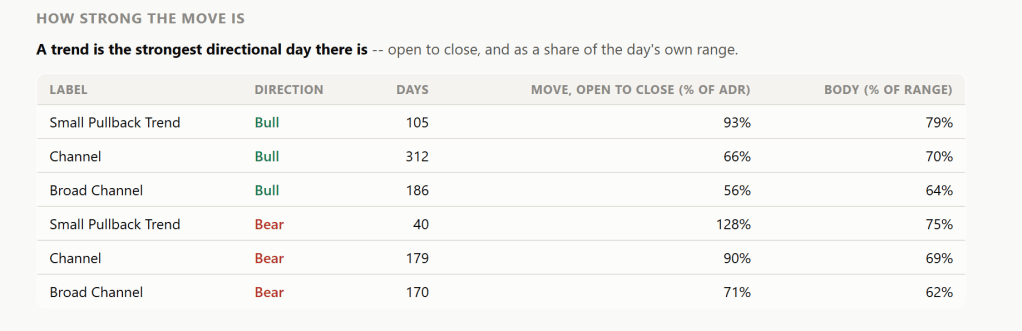
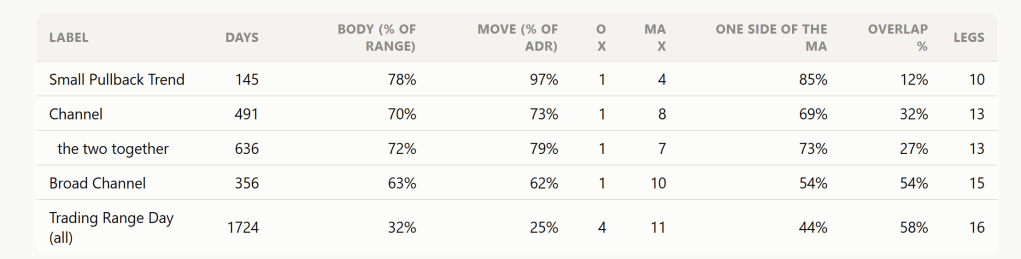
- Trend days are mostly body, not much tail on the bar
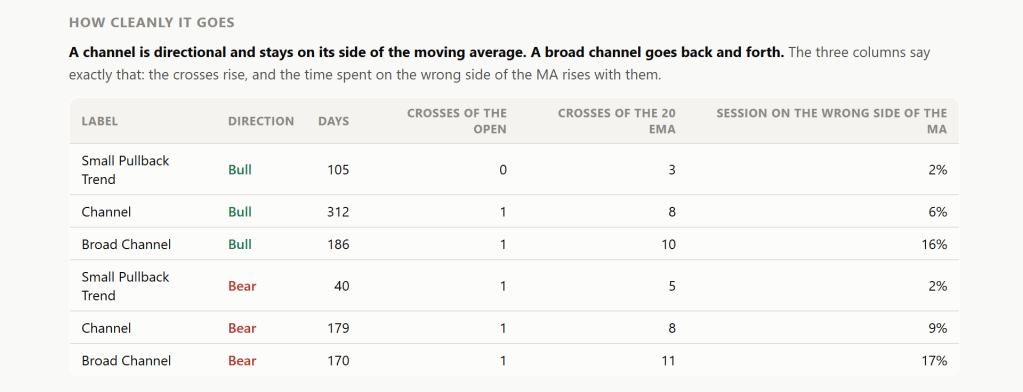
- Trends don’t cross the open much, rarely cross the MA and spend most of their time on the trend side of the MA
Results – More Details
Open Cross
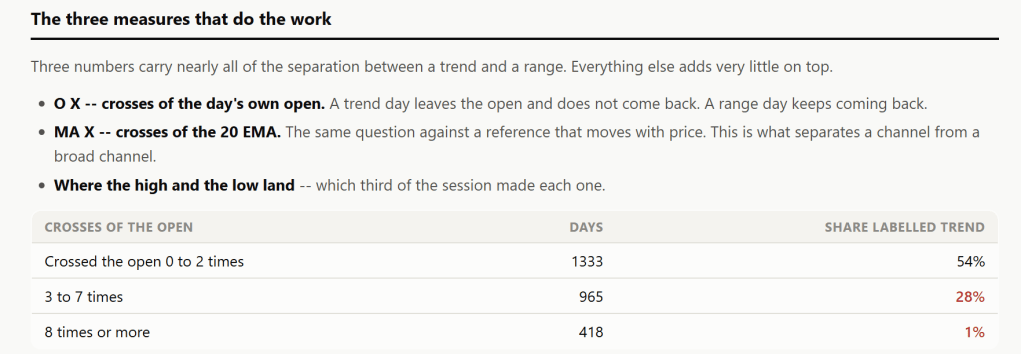
I made up a measure. I call it Open Cross: how many times a five-minute close flips from one side of the day’s open to the other.
A trend day leaves the open and does not come back. A range day keeps coming back. That is the whole idea, and it turns out to be the single clearest split in the data.
| Crosses of the open | Days | Share of those days I labelled SPBT, CH, BR CH |
|---|---|---|
| 0 to 2 | 1,333 | 54% |
| 3 to 7 | 965 | 28% |
| 8 or more | 418 | 1% |
Read the bottom row. Out of 418 days that crossed their own open eight or more times, I put only six in any trend or channel group. Thats the stats confirming my eyes – so it has my bias on it.
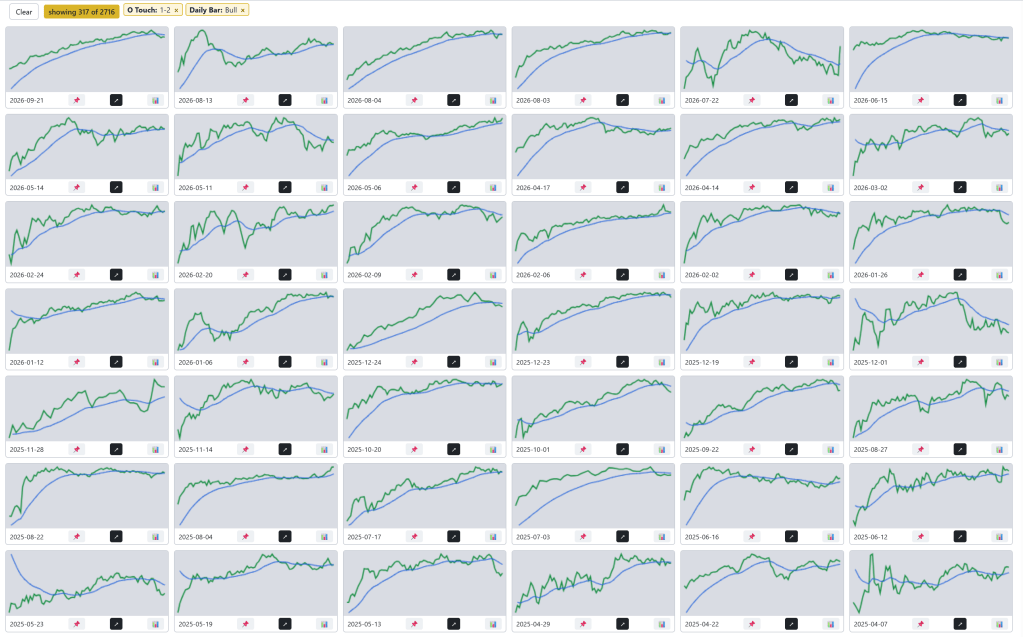
It seems to be a good one to monitor during the day.
Time on the wrong side of the 20 EMA
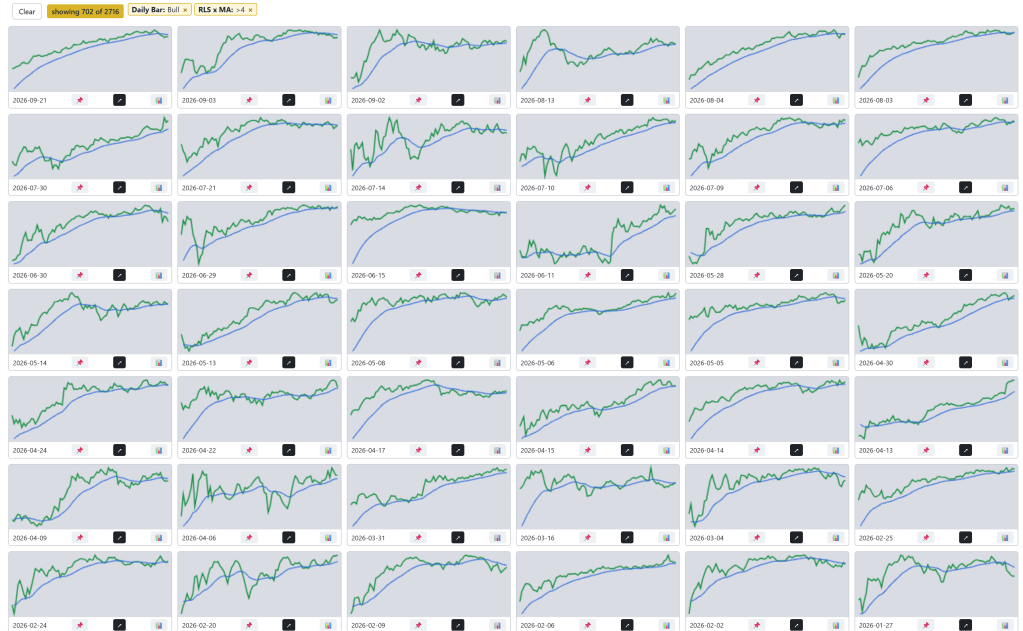
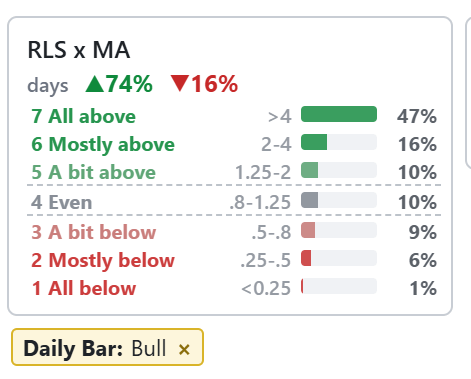
Take every five-minute bar that sat wholly on the wrong side of the 20 EMA (below it on a bull day, above it on a bear day) as a share of the session’s bars.
| Label | Days | Share of the session on the wrong side (middle day) |
|---|---|---|
| Small Pullback Trend | 145 | 2.5% |
| Channel | 491 | 7.4% |
| Broad Channel | 356 | 16.0% |
Some of them will not be strong trends, but they will be directional if we can split by either time (# bars), or complete bars or closes across the 20 EMA. I approached it like this below.
For all of my ES data – about 2700 charts – daily bars sit like this.
High of Day and Low of Day – Comes Early.
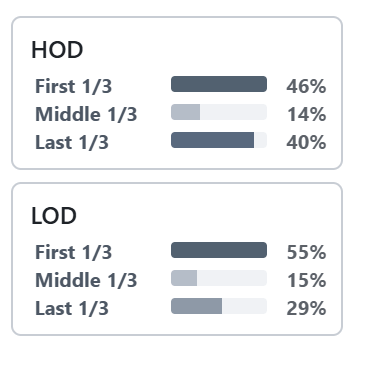
Split the session into thirds and ask which third made the high and which made the low. That gives nine combinations.
A day that makes either extreme in the middle third is a trading range day. Across my labels, the combinations with a middle-third extreme run 87% to 100% trading range. It went one way, stalled, and came back. It never committed.
Only two combinations hold the trend days: low in the first third and high in the last third, or the mirror. Both extremes in the first third looks like a trend that stopped.
A clean combination is not a trend day on its own. Low first and high last is 922 days, and 60% of them are trend days. The mirror is 626 days and 53%. The middle third tells you what a day is not, far better than the ends tell you what it is.
Have I been kidding myself?
The worry with three weeks of hand-labelling is that you are just drawing your own prejudices onto the charts. So I checked, two ways. First, I got Claude to rescan my sorting for outliers – sometimes I agreed, sometimes I didn’t. Second, I found the value of “time on the wrong side of the MA” that best separates Channel from Broad Channel, separately for bull days and bear days.
Bull: about 10%. Bear: about 10%. Same number, found independently on each side.
Then the bull skew. My labels run 72% bull in Small Pullback Trend, 64% in Channel and 52% in Broad Channel. That looked like bias until I checked all the days, ignoring my labels entirely:
| Share of session on the wrong side of the MA | Days | Share of those days that closed bull |
|---|---|---|
| Very tight (5% or less) | 348 | 76% |
| Mid (over 5%, up to 15%) | 650 | 64% |
| Loose (over 15%) | 1,710 | 47% |
My labels run from 72% bull down to 52%. The market, with no labels, runs from 76% down to 47%. Same shape. Up-trends run tighter. Down-trends trade more two-sided. That is a market fact I picked up by eye, not a bias I introduced.
That check is the one thing the computer did that my eyes could not have. Worth the three weeks on its own.
Conclusion
Back to the one-liners I set out to test.
“Trend days occur 20% of the time.” Confirmed. On 2,716 ES sessions it is 23.4%. About one day in four.
“Most parts of most days are trading range days.” Confirmed, at the day level. 76.6% of days are either a trading range outright, or a broad channel, which carries a big stretch of two-sided trading. I have not measured the parts inside each day yet.
And I now know what I mean by a trend day. A trend day, for me, is a small pullback trend or a channel, bull or bear. Not a broad channel. Not a trading range.
The number was right. My definition was wrong. Before this, “trend day” was a feeling that covered anything with a direction in it.
The eyes beat the computer at finding the pattern. No amount of scoring got there. But once I had labelled it, the computer was much better than me at checking whether I had been consistent.
Part 2: how early in the session can you tell it is a trend day?
Happy trading!
Tim
Zen Trading Tech



Leave a comment