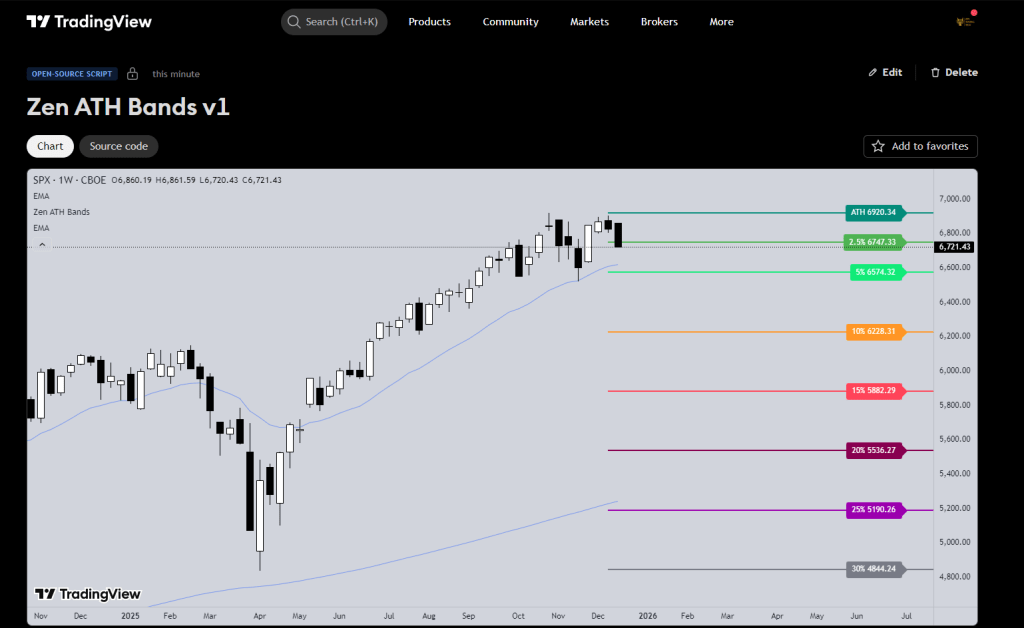
- Here is a free All Time High and Pullback Indicator for TradingView
- This one is quite useful for higher time frame and investing.
- Code is open-source so you can adjust yourself 🙂
Technical Details
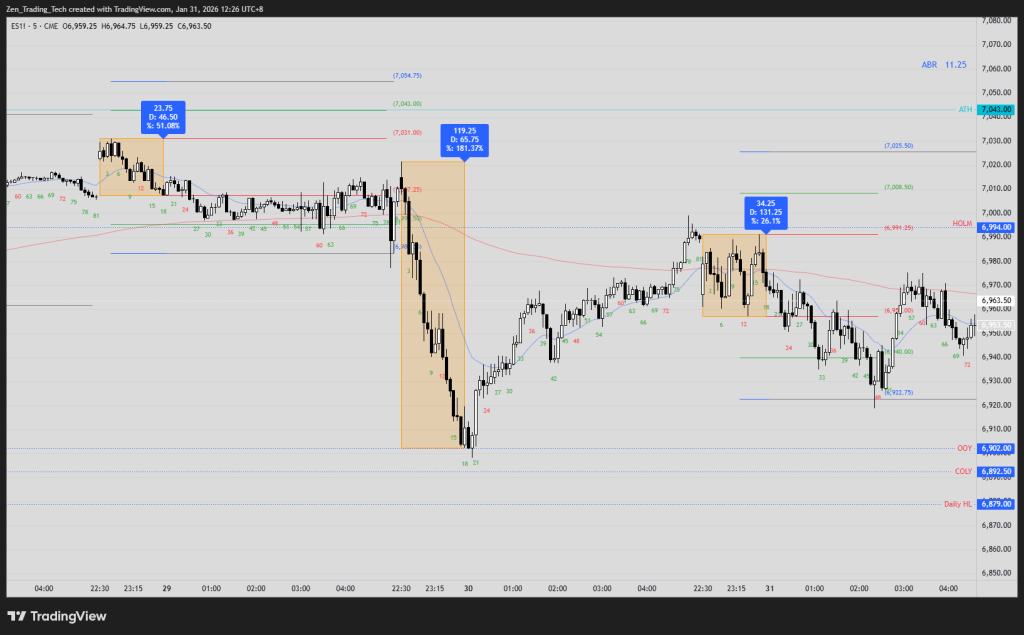
This indicator plots horizontal drawdown levels projected into the right-hand margin. It calculates percentage drops from a selected anchor point (ATH or Current Price) to identify key price levels.
Technical Features
- Dynamic ATH Tracking: Automatically calculates the highest high in the chart’s history without lookback limitations.
- Non-Invasive Plotting: Uses right-extended lines and labels to keep the price action history unobstructed.
- Performance Optimized: Only renders on the most recent bar to ensure zero impact on chart loading speeds.
Custom Options Explained
1. Reference (refMode)
- Option 1 (ATH): Sets the anchor to the highest high ever recorded on the chart. All percentage bands are calculated as drops from this peak.
- Option 0 (Last Price): Sets the anchor to the current closing price. Useful for visualizing potential downside risk from the current market value.
2. Right Offset (bars)
- Purpose: Sets the horizontal distance between the current candle and the level labels.
- Usage: Increase this value (e.g., 50 or 100). If you use a wide chart layout or decrease it if you prefer labels closer to the price action.
3. Percentage Band Toggles
- Included Tiers: 2.5%, 5%, 10%, 15%, 20%, 25%, and 30%.
- Function: Each level can be individually enabled or disabled via checkboxes.
4. Color Inputs
- Customization: Each band has a dedicated color picker. This allows for high-contrast visibility regardless of whether you use a light or dark chart theme.
Indicator Inputs Table
| Input Label | Default Value | Function |
| Reference | 1 (ATH) | Toggle between All-Time High or Current Close as the calculation base. |
| Right Offset | 30 | Moves text labels X bars into the future margin. |
| Show [X]% | Enabled | Boolean toggle to show or hide specific percentage lines. |
| [X]% Color | Varies | Defines the color for the specific line and label. |
Post on using with the cash index coming soon!
Thanks
Tim F


Leave a reply to Tim Fairweather Cancel reply