- In this post I’m exploring ways traders use pullback % to trade higher time frame indices (using futures or other instruments as the cash index can’t be traded directly)
It reminded me of an old funny quote by trader Michael Burry.

Post with Indicator here
Futures and Cash Indices
- Futures and underlying cash indicies
- Note that TradingView doesn’t have true cash index for a few tickers – so they have a TVC (Trading View Chart) option
| Index | TradingView Ticker | Hosted Source (Exchange) | Based on Futures |
| S&P 500 | SPX | CBOE | ES (E-mini) |
| Nasdaq 100 | NDX | NASDAQ | NQ (Nasdaq) |
| Dow Jones | DJI | DJ (Dow Jones Indices) | YM (Dow Jones) |
| Russell 2000 | RUT | CBOEFTSE | RTY (Russell) |
| DAX 40 | DAX | XETR (Deutsche Börse) | FDAX (DAX) |
| Hang Seng | HSI | HSI (Hang Seng Indices) | MHI / HSI |
| Nikkei 225 | NKY | TSE | NK / NIY |
| ASX 200 | XJO | ASX | AP (SPI 200) |
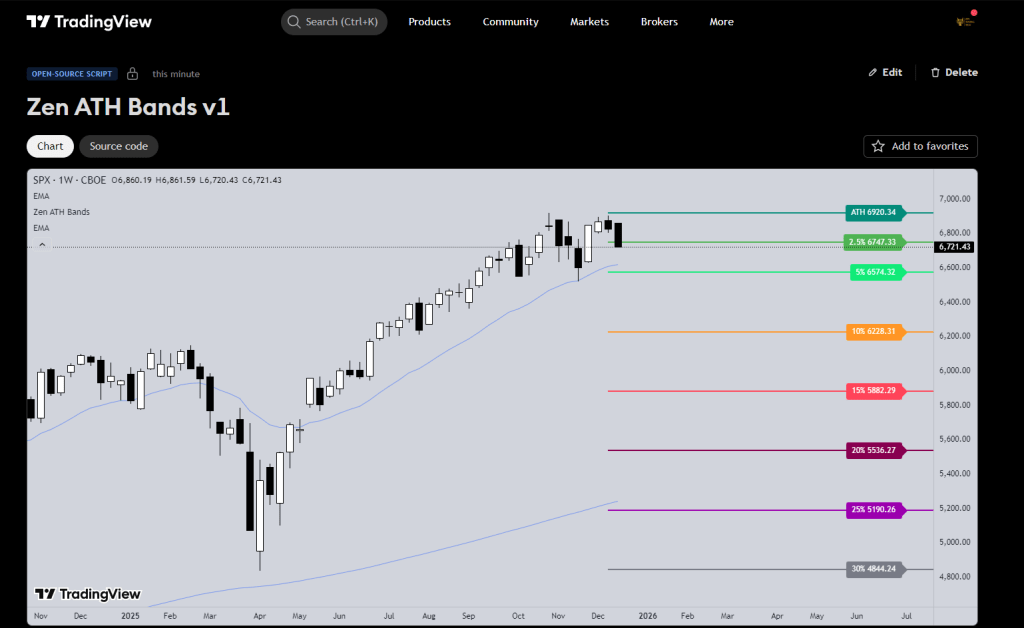
Example – S&P
- Strong Bear Day selloff paused at 3%


- Complex pullback to 5%

- 2025 selloff to April was 20% pullback

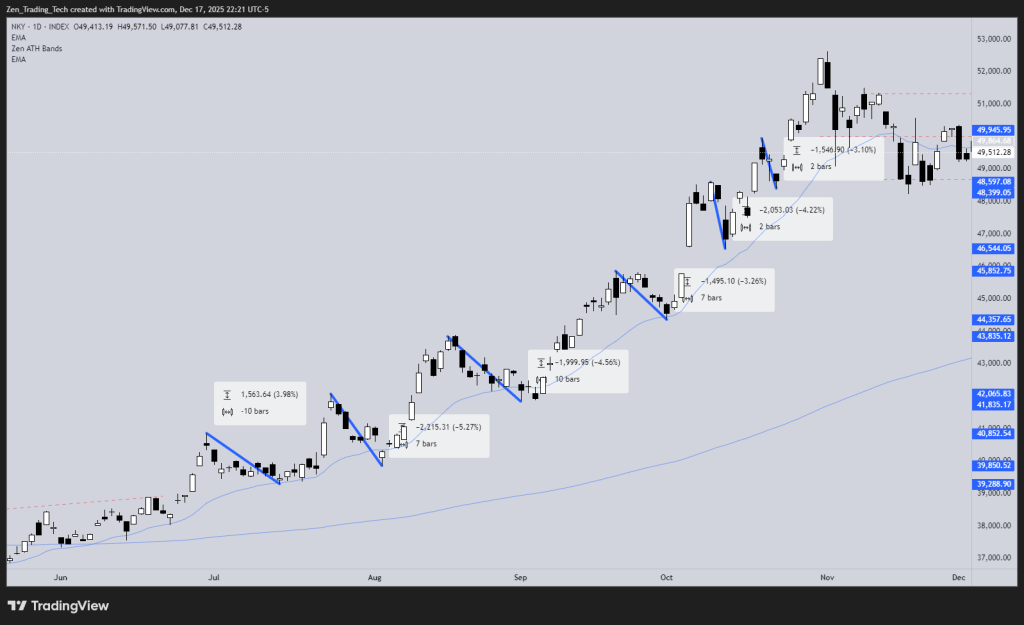
Examples – Nikkei
- Traders bought 2.5%, 5% and 7.5%
- Or you could buy 5% and exit part at next level up – 2.5% (midpoint)
- Or you could buy 7.5% and exit part at next level up – 5% or midpoint

- Buying the MA in a Bull Trend, and were all 2.5% / 3% / 5% pullbacks – reasonable in a bull trend
Examples – Hang Seng
- Traders buying 10% down and scaling in lower
- Can exit back at first entry (if expecting 2nd leg down)
- Here pullbacks are deep so trading differently to S&P

Examples – Nasdaq
- When strong – 2.5% / 3% pullback buys
- Buying MA
- Then 5%, 10% scaling into test of high

Examples – Dow
- Buying the MA and scaling in lower

Conclusion
- Hopefully this inspires you to research pullbacks and higher time trading
- Long live the Buy The Dip generation 🙂
Thanks,
Tim F


Leave a comment