I don’t think consistency in trading comes from finding a “perfect” indicator, setup, signal, size or exit; I think it comes from the relentless review of our performance every day.
If Tiger Woods at #1 was still working on ‘fixing’ his swing… for sure I can keep reviewing the fundamentals in my trading routine!
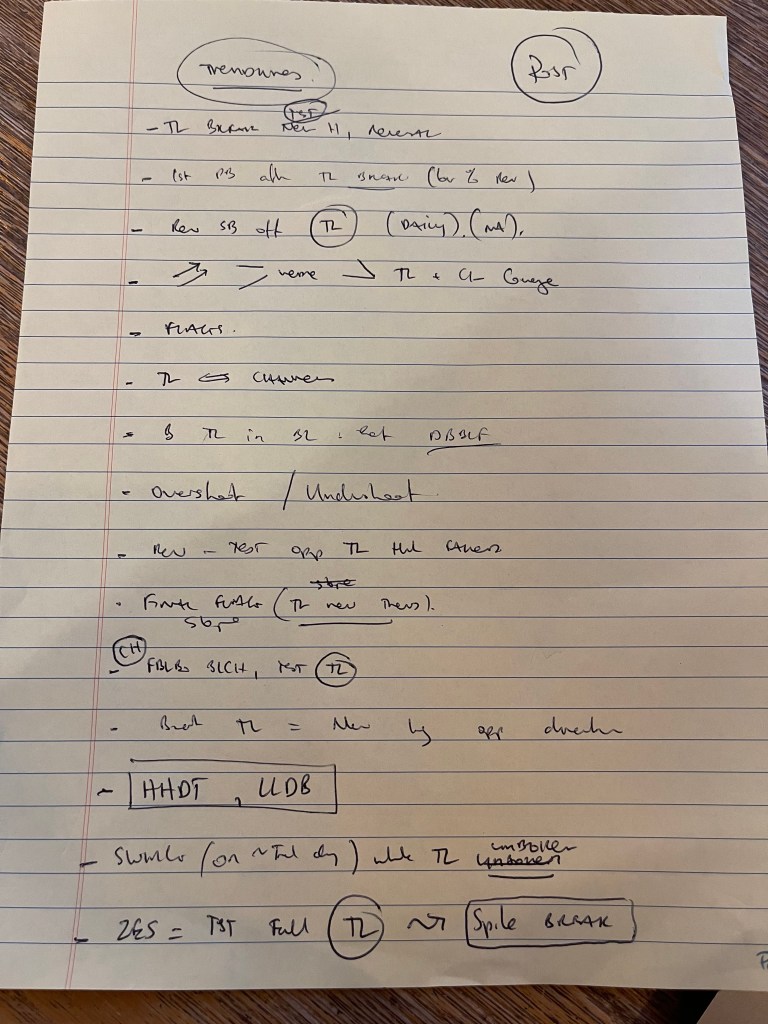
Lately, I’ve been revisiting my foundational work on trendlines—re-watching my videos and dissecting past blog posts—to see where the theory meets the reality of the charts.
I’m breaking down my latest insights on trendline breaks, the psychology of trapped traders at new highs, and how to use “failed” tests as high-probability entries.
My intention is that you will be inspired to review your own fundamentals in your trading strategy and see if you can find micro-gaps to improve 🙂
Recommended process and links:
- Goto NotebookLM https://notebooklm.google.com/
- Add sources
- I used my own blog posts and my own youtube videos
- Links below
- It can create infographics, slides and DOPE flashcards as well instantly.
- I reviewed what it made and I took notes on things I learned when reviewing my own trades
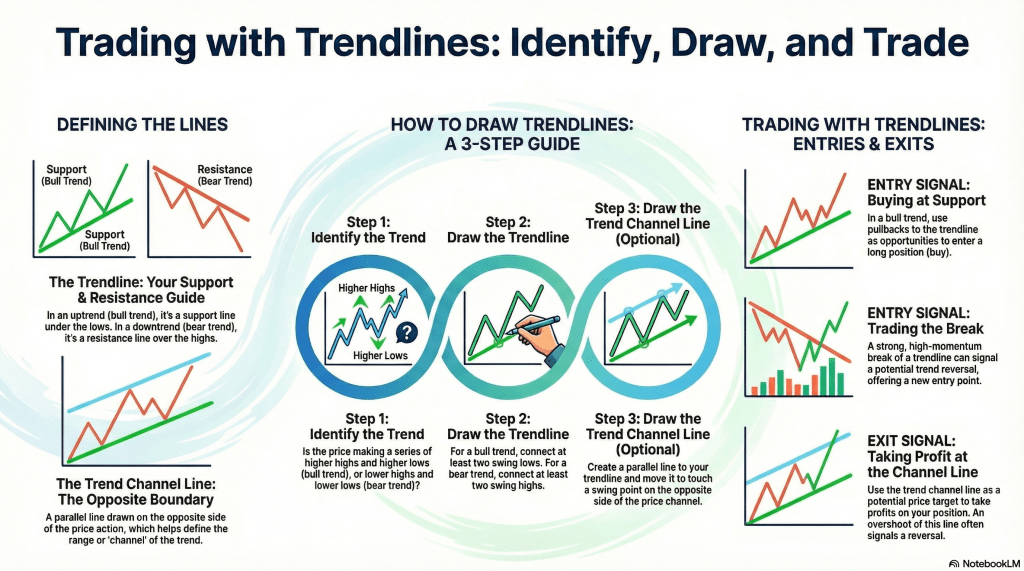
The Psychology of the Trendline Break
A trendline represents an invisible “pain threshold” for traders.
When a trendline breaks and the market attempts to push to a new extreme (a new high or low), it is a major test of conviction.
- Trapped Traders: Traders who bought a trendline only to see price go against them significantly are under stress. When the market returns to a new high, they aren’t looking to buy more—they are looking to exit.
- The Swing Signal: For swing traders, this behavior is a signal that the trend is starting to weaken. Conviction changes at the next high.
- The Scalp Entry: You can use a trendline break as a way to get in for a scalp. Conviction that we will at least test the old extreme.
- Staying in: More importantly, it serves as a filter: until I get a clear trendline break, there is no technical reason to close a winning swing trade.
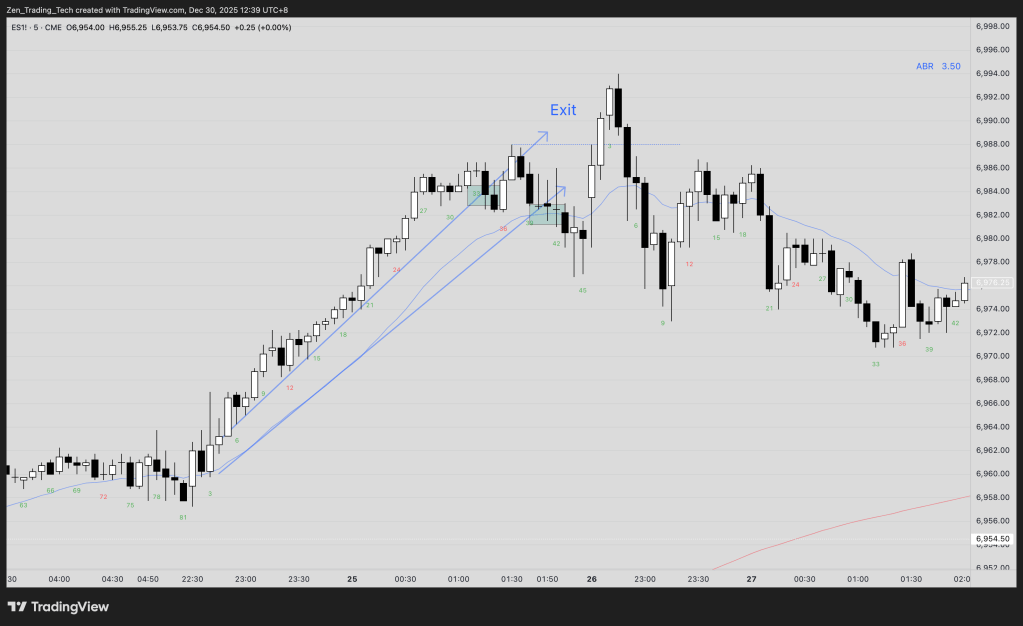
Reversal Entries and the First Pullback
The most reliable reversals happen after the market “proves” its change in direction through a decisive break.
- The First Pullback: A strong break of a trendline followed by the first pullback is often an excellent reversal entry. This can lead to a small second leg (moving sideways to up) or act as the first entry after the market switches direction.

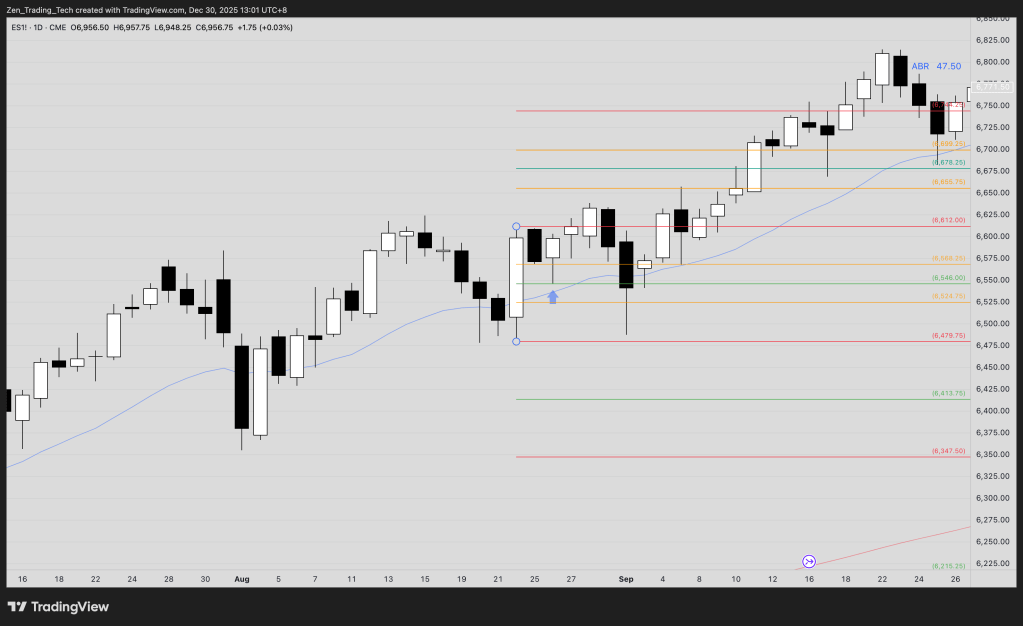
- Signal Bars: When the market tests back to a trendline, you are looking for a clear reversal signal bar. You can find these high-probability setups on the daily chart or view them as an average pullback in a broader trend.
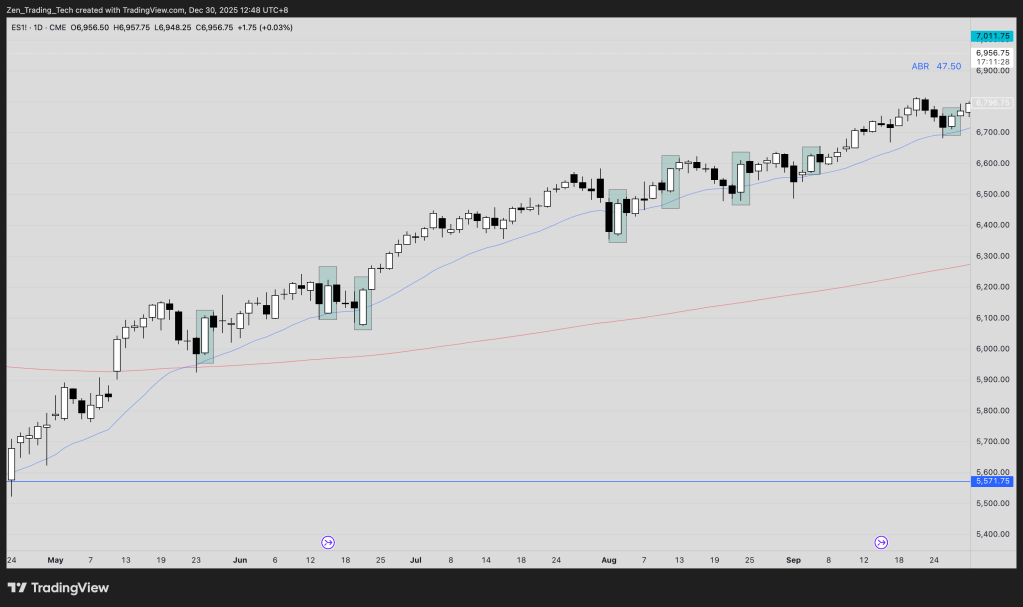
- Managing Size: If the signal bar is too large, traders should modify their entry. Don’t chase a giant bar; adjust your position size or entry method to account for the increased risk.
- In the example above of the DAILY chart – the big bull outside bar – see how they bought 50% to control risk in the below image.
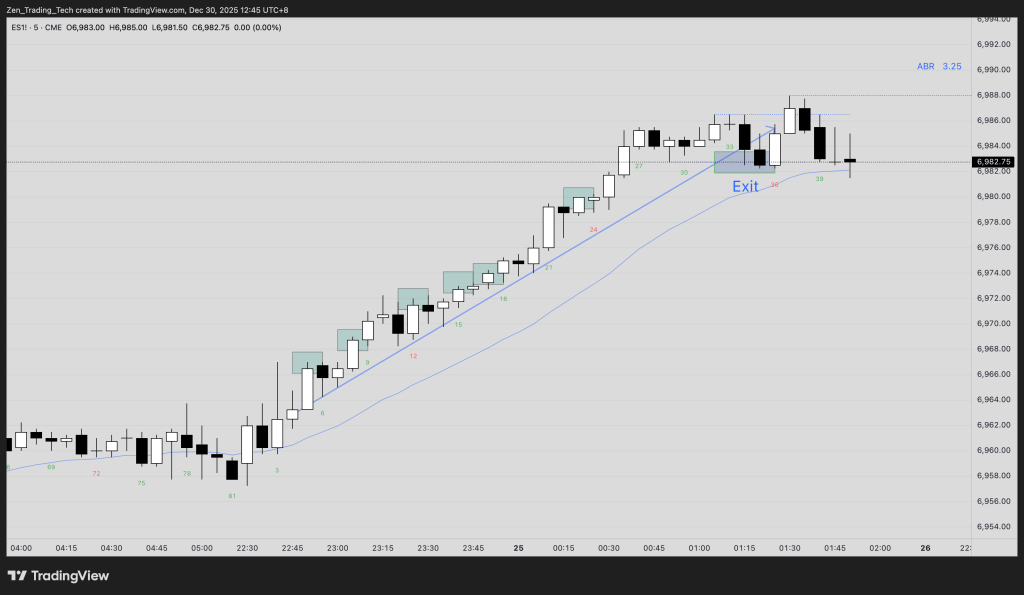
Channels, Wedges, and Flag Angles
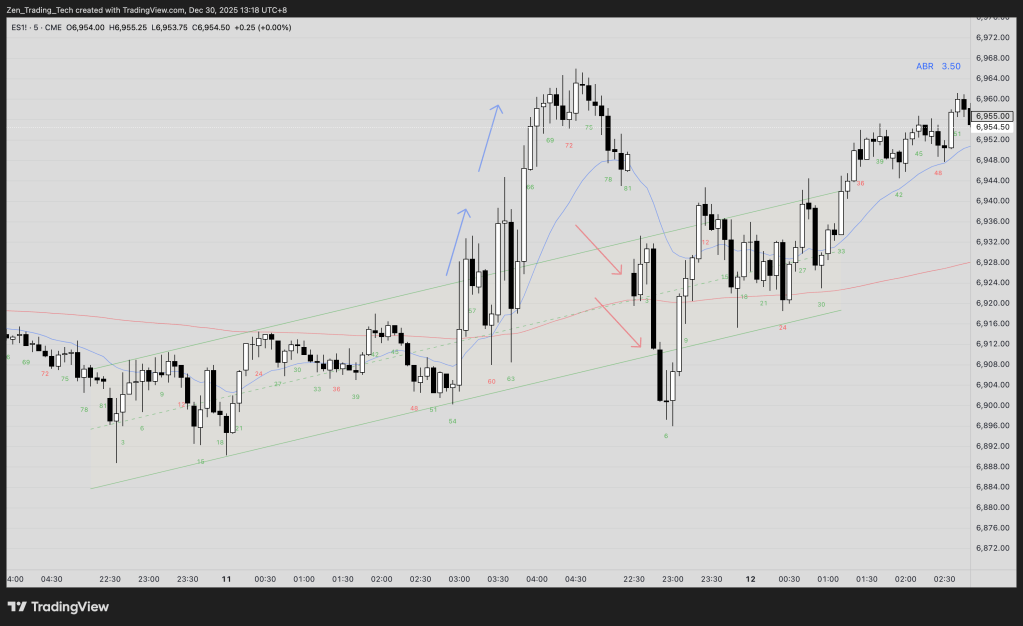
Understanding the relationship between trendlines and channel lines helps you categorize the market environment instantly.
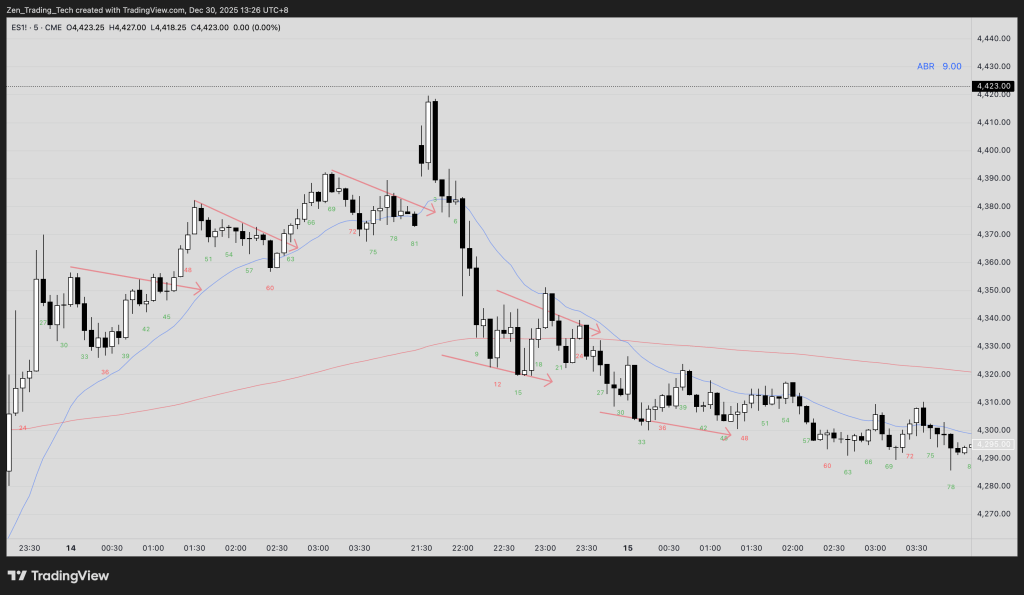
- Parallel vs. Converging: When the lines are parallel, we have a channel. When they converge, it is a wedge. Here are some more complex variations which resulted in wedge entries.
- The Flag Angle: Pay close attention to the angle of the final flag. It often dictates the angle of the new trend that is about to begin. I had never noticed this before so will keep a look out for it.
- Spike break test buy – buy the test back to the original spike break. One of my favourite scalping techniques.
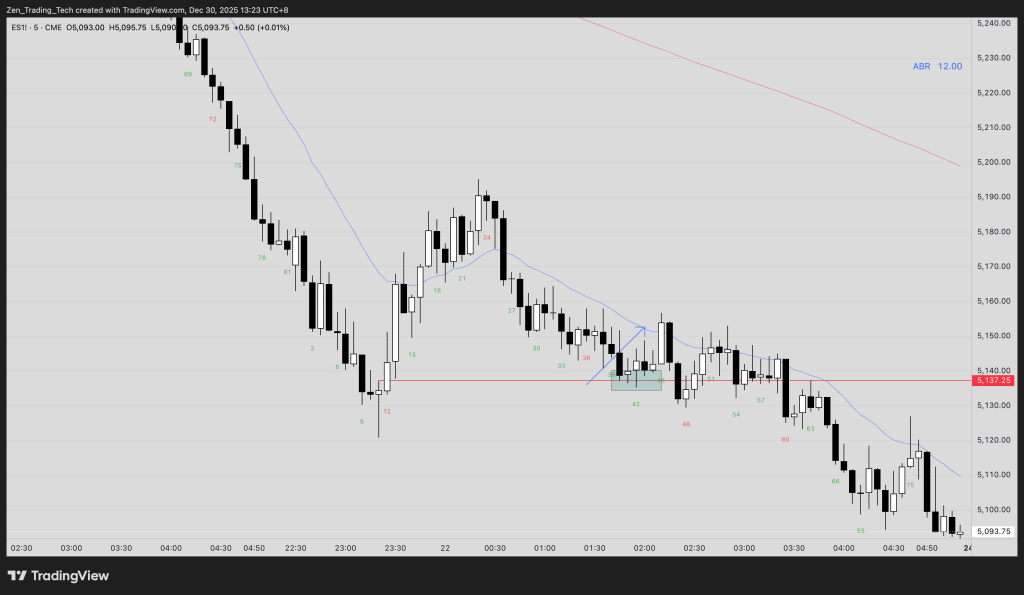
- 2nd reversals and scaling in – a 2nd trend line break is a second entry. Here mostly sideways open so expect breakouts to be weak and reversals to work well.
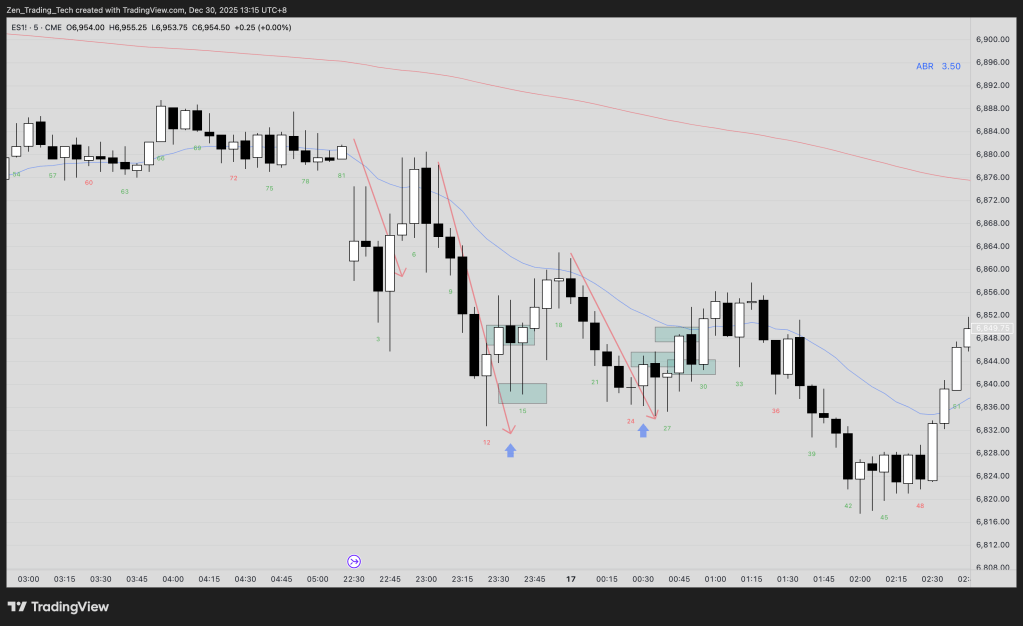
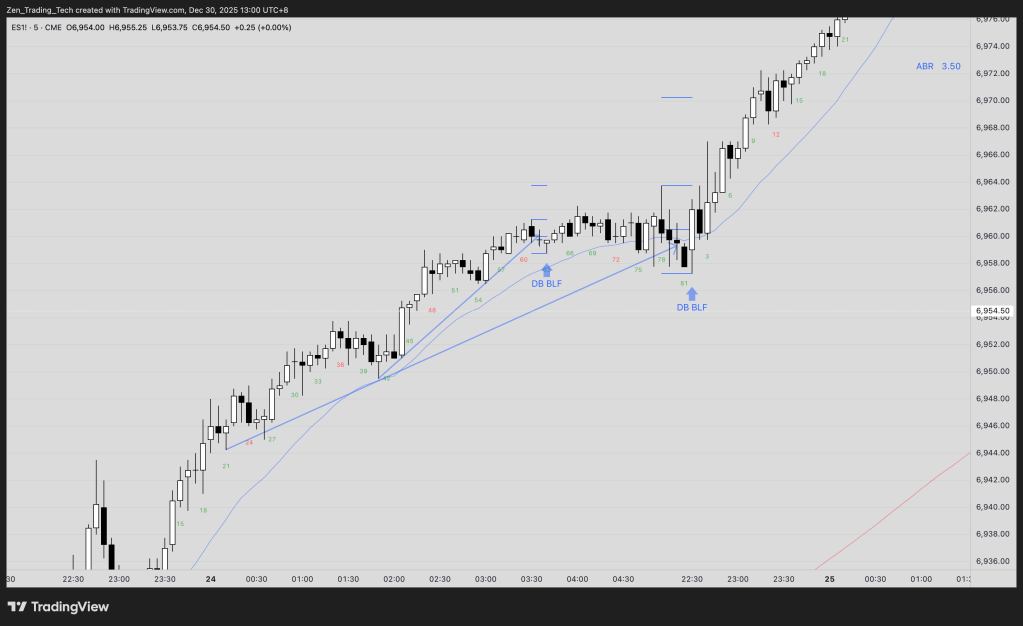
- The Double Bottom Bet: When bulls buy a trendline in a bull trend, they are essentially betting on a double bottom bull flag. To hold that entry, you must trade it with the discipline of a double bottom setup. Here a small one and bigger one.
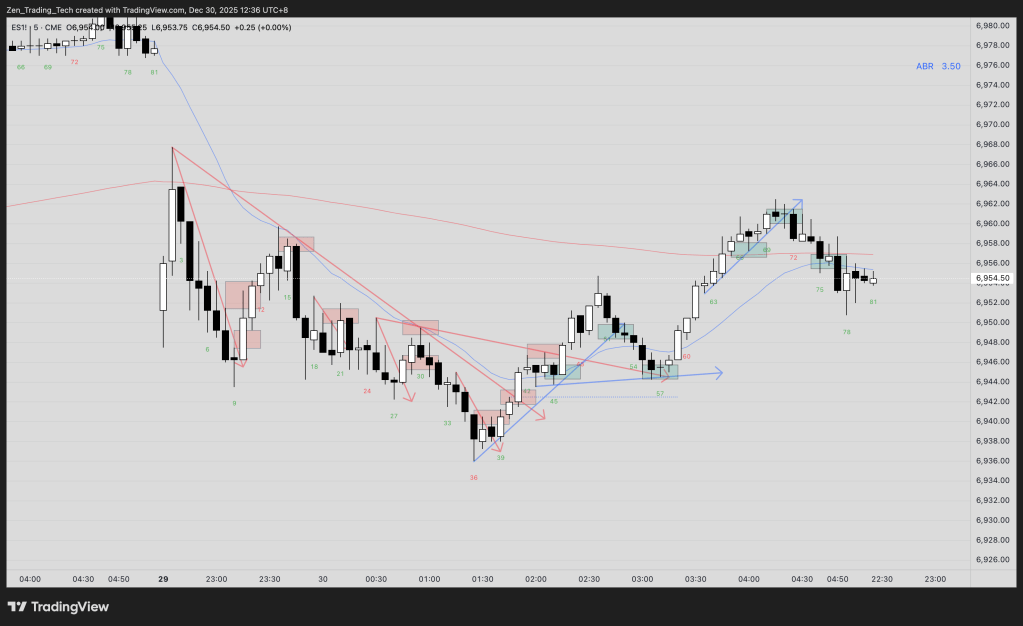
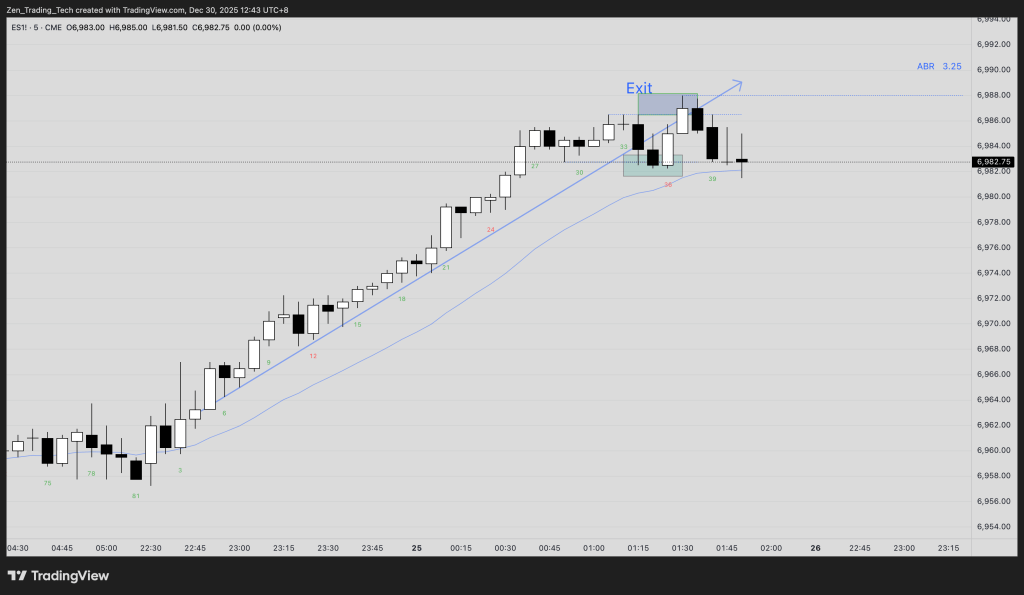
Navigating Overshoots and Failed Extremes
The most difficult patterns to master are the higher-high double tops and the lower-low double bottoms, especially concerning tested extreme reversals.
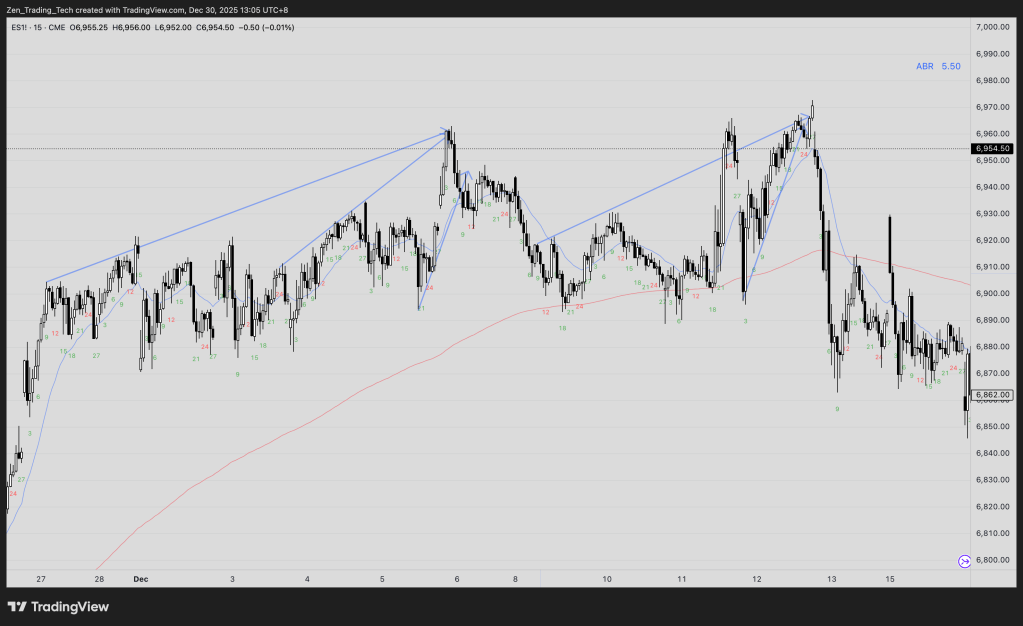
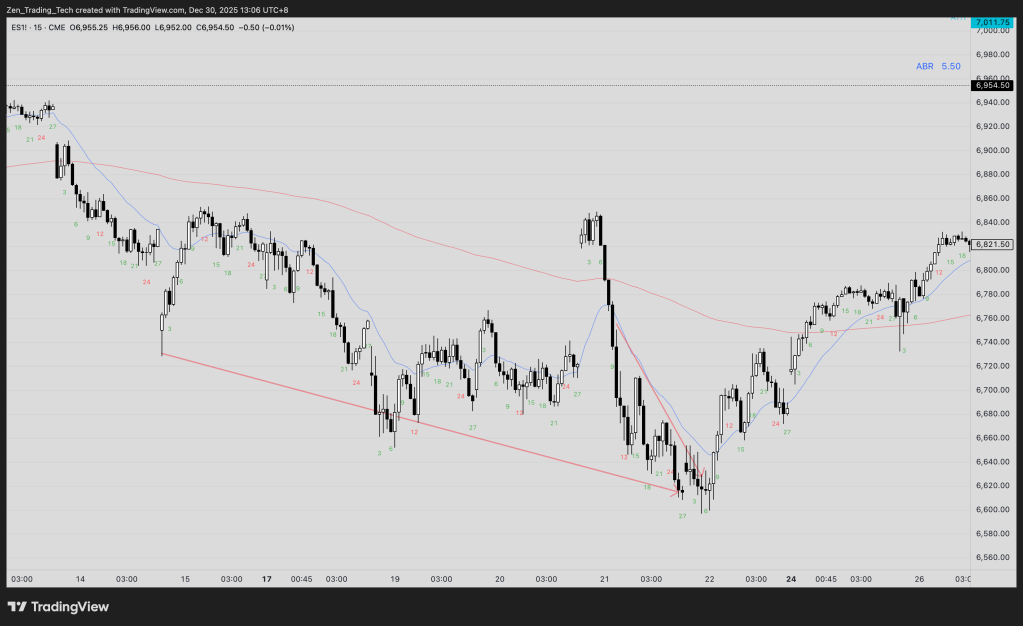
- The Trendline Test: In a bull trend that breaks above the prior bear trend line, price often pulls back all the way to the original trendline before forming a higher low
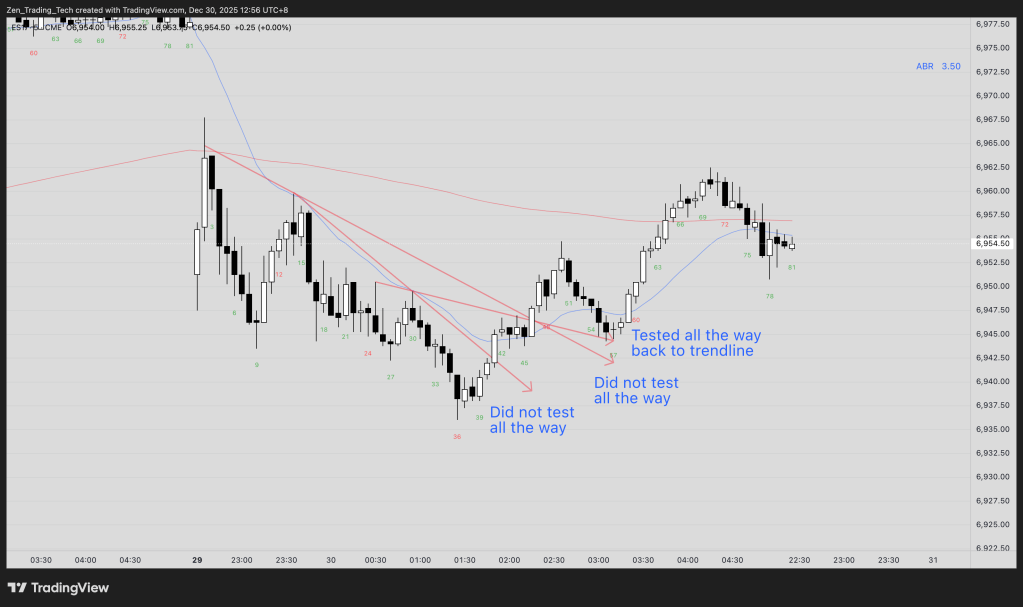
- The Failed Breakout: In a bull channel, when a bull breakout fails, price often returns to test the trendline to see if any traders are still defending that level. Magnets at the channel line, midpoint and the trendline.
- The Strategy: Before you attempt a reversal, wait for a trendline to break, then let the market test the opposite trendline that failed.

At the end of the day, trendlines and channels are simply maps of the battle between bulls and bears.
Whether you are looking for a scalp on a trendline test or holding a swing until a definitive break, the goal is to remain objective.
By watching how the market reacts to these levels—especially during overshoots and second entries—we can move away from guessing and start trading what is actually happening.
What is one trendline rule you’ve had to “unlearn” to become more profitable? Let me know in the comments.


Leave a comment