- What is a Measured Move?
- Indicator
- ES Daily Chart and Measured Moves
- What if Yesterday was a Bull bar vs Bear Bar?
- What about Internal Bar Strength (IBS)?
- Putting it all together
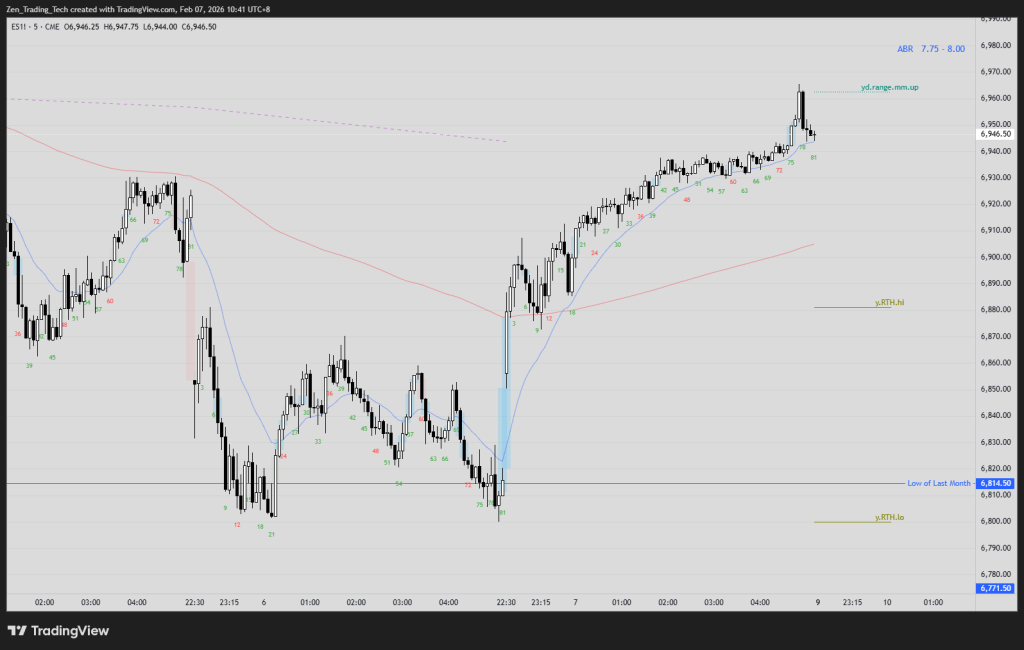
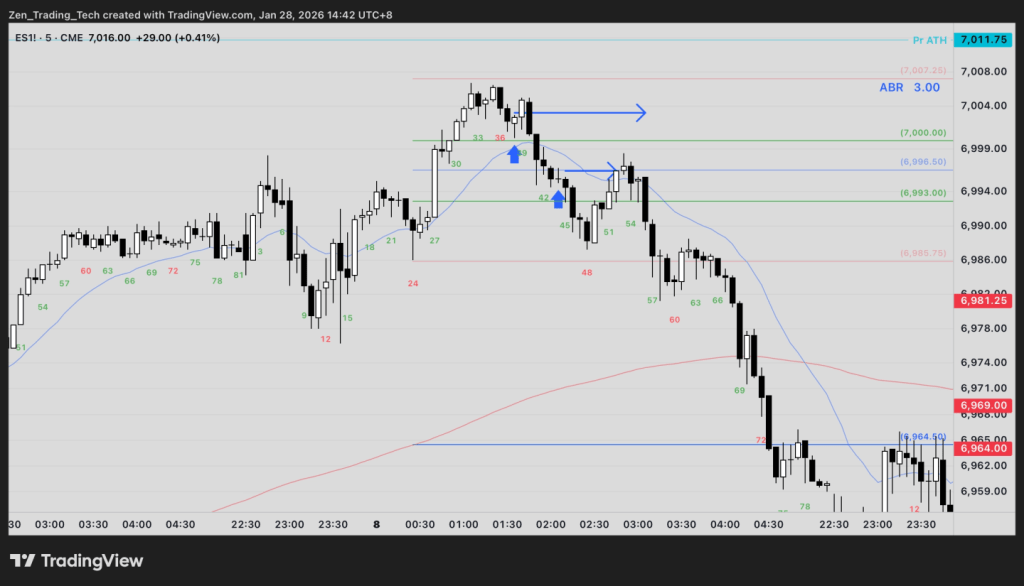
Yesterday was a bull trend from the open which ended at a measured move of the day before.
Which got me thinking about some old research I needed to update.
What really are the chance we get a measured move of yesterday’s range?
In this post I will explore it further to hopefully inspire you to research your own trading strategies.
What is a Measured Move?
- There are many kinds of measured moves
- The one I’m referrring to here is about the prior bars high – low and projecting it up and down.
- On the daily chart, the prior bar is yesterday.
Indicator
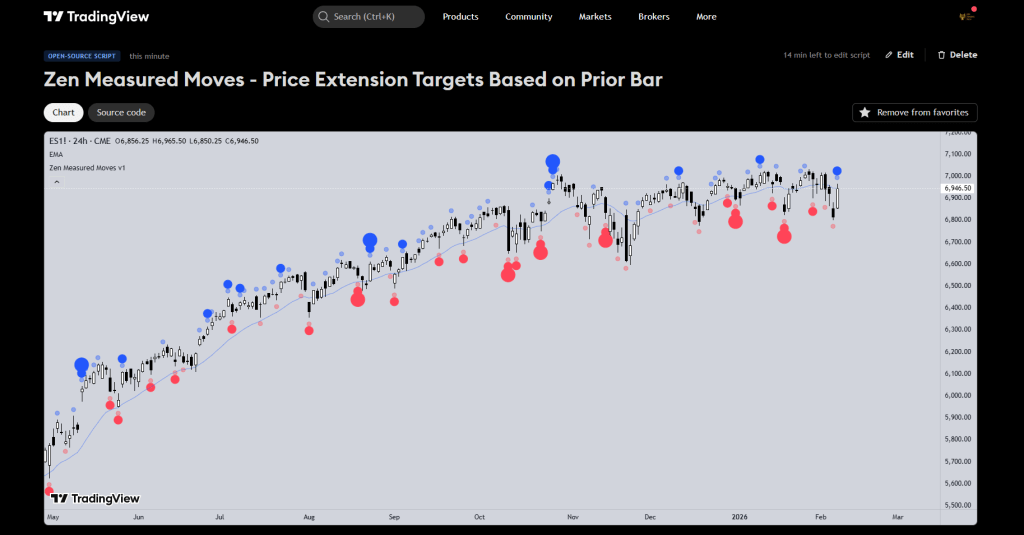
- I wrote a free indicator for TRADINGVIEW with open source code you can use.
Simply:
- 50% of YD rannge small light dot
- 1 x YD range medium full dot
- 2 x YD range is big full dot
- You can use this to pull data into excel for your research
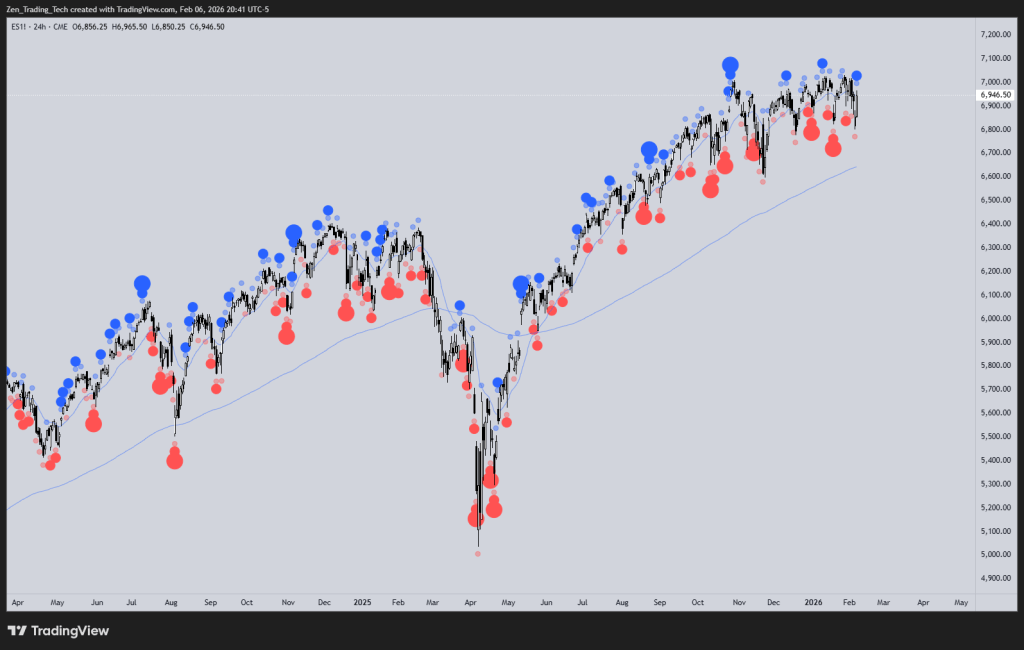
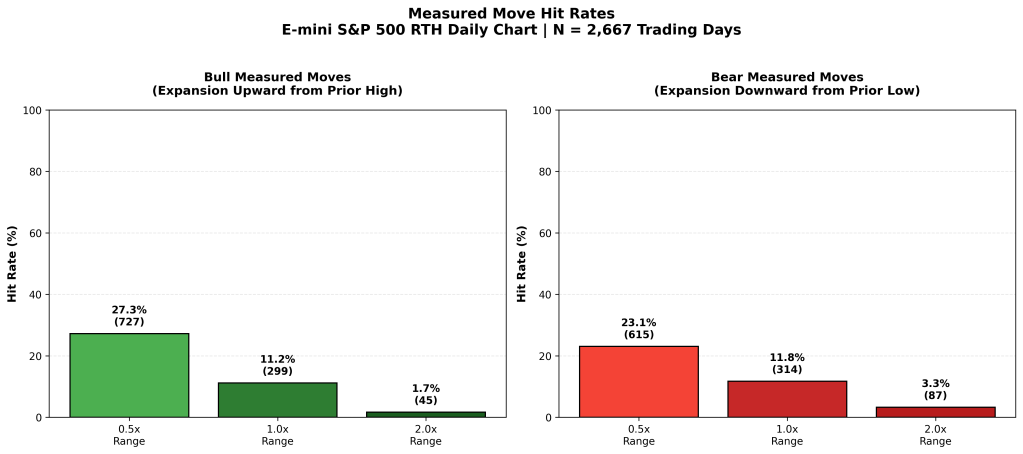
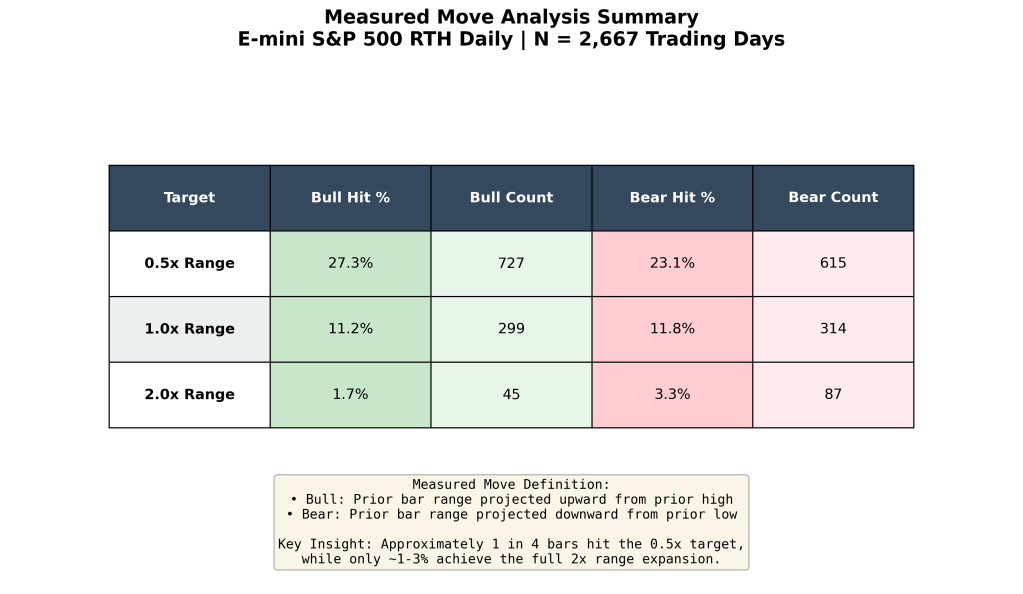
ES Daily Chart and Measured Moves
- What is the chance of a measured move of yesterday? Pretty low…
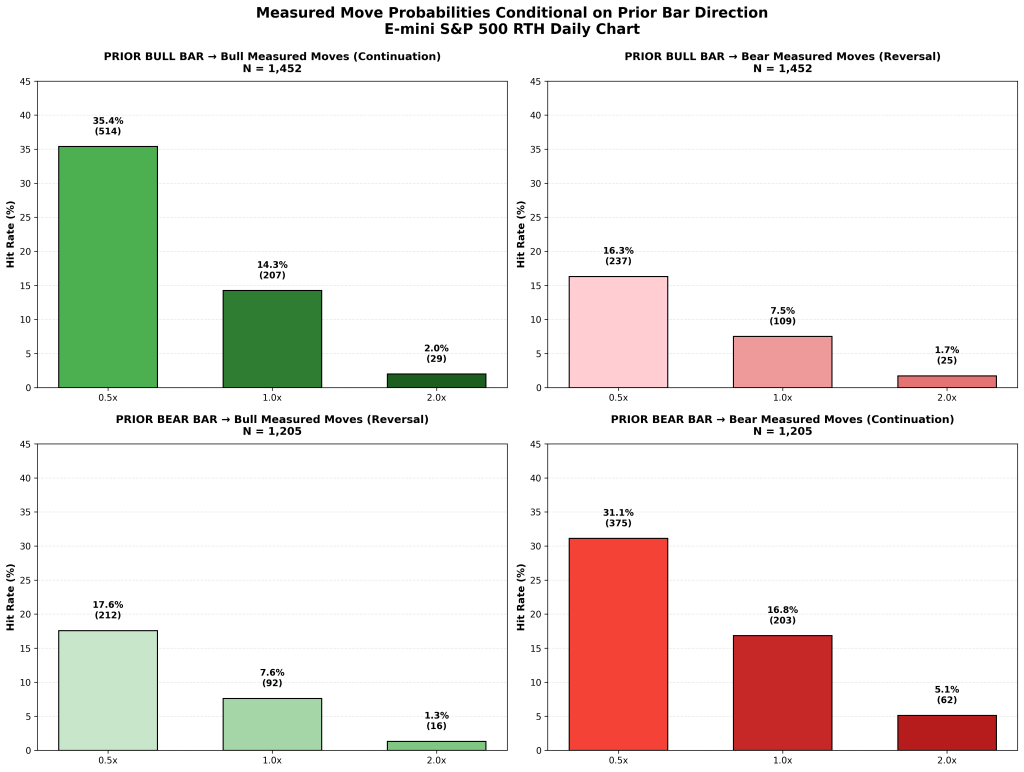
What if Yesterday was a Bull bar vs Bear Bar?
- A little bit of a boost but not really
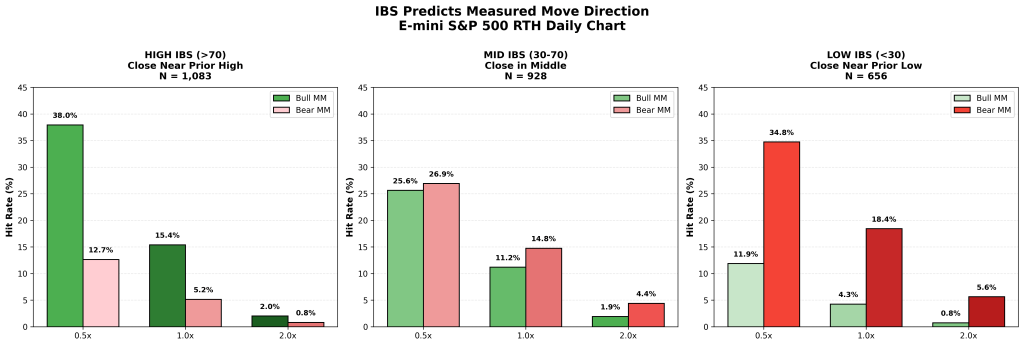
What about Internal Bar Strength (IBS)?
- Does the close matter more relative to the high/low of the bar?
- Yes ok we found a better predictor but its marginal at best.
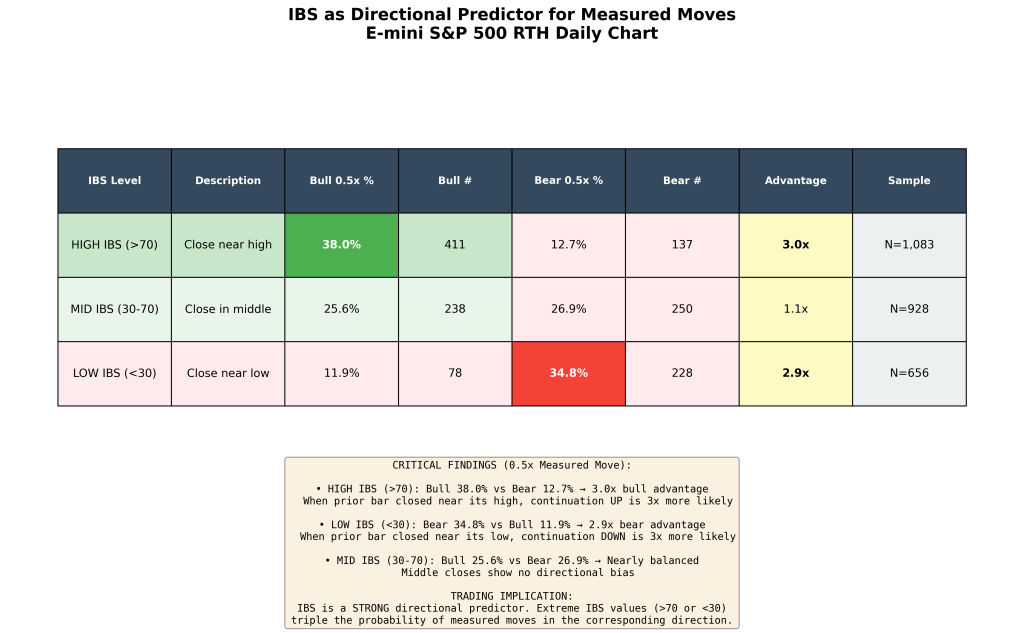
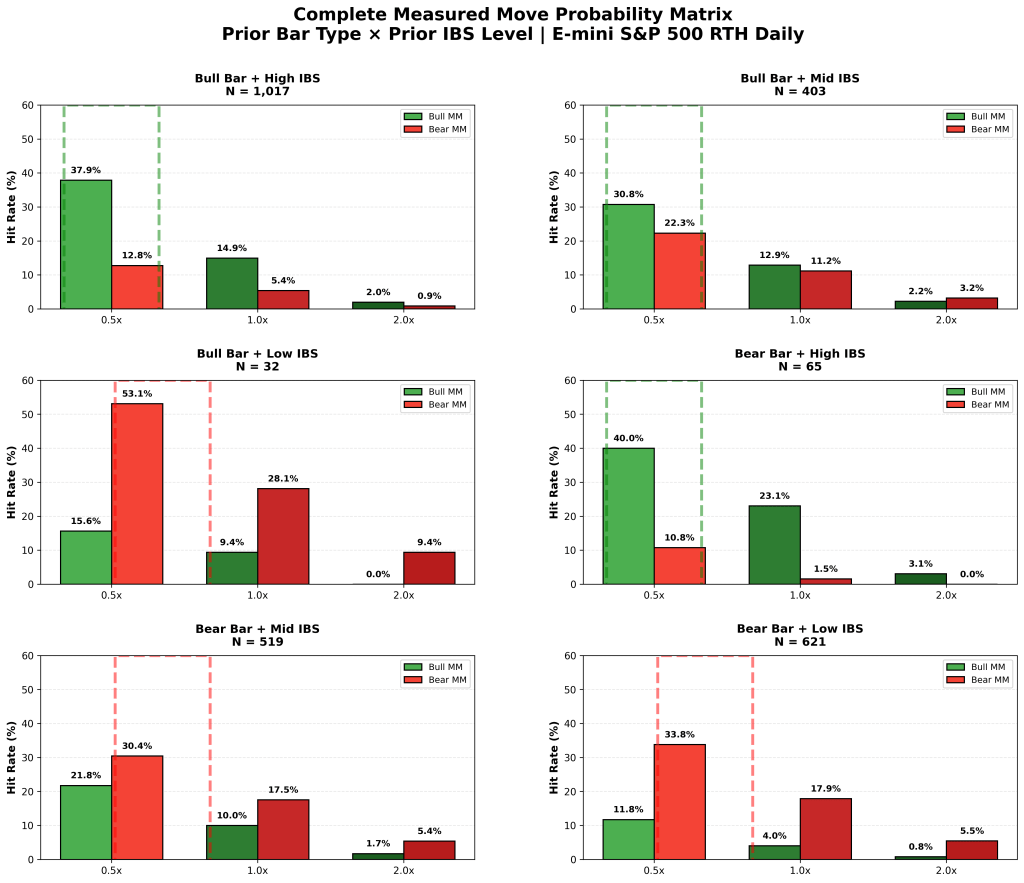
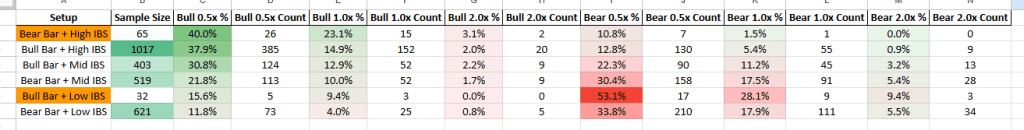
Putting it all together
- When we split it again with bull and bear bars and IBS it is now more useful for finding swing targets (40% hit rate)
- Stats below.
- It wasn’t what I thought
- Actually the best predictor was a REVERSAL bar. A bear bar yesterday with HIGH IBS. or a BULL bar yesterday with a LOW IBS
- But still 50% measured move of yesterday seems common enough to use as a target
- But that research can be for another day!


Leave a reply to barryde Cancel reply