
– One of the key skills I need to day trade is the ability to distinguish between a trending environment and a trading range environment.
– One way to do this is using Al’s inertia concept
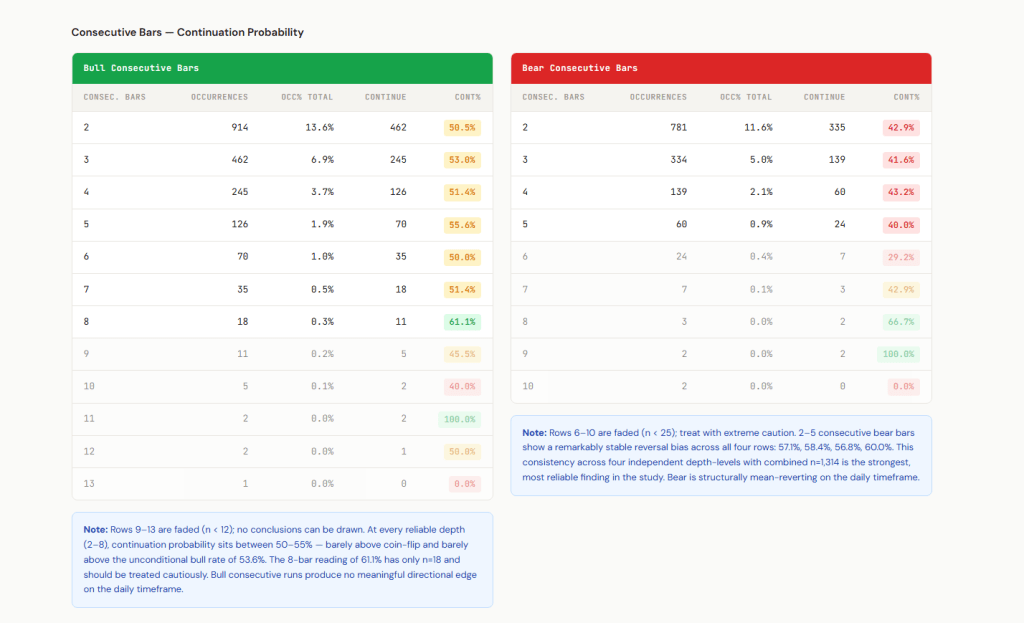
“In a trend, 80% of reversals fail. In a trading range, 80% of breakouts fail.”
That means we can take a continuation signal (H1 and H2) and when they start failing, we can assume a trading range is starting.
On the other hand in a trading range, if those start working (bull continuation at the top of the range and bear continuation at the bottom of a range” then the trading range is likely coming to an end.
Let’s research further
Summary of work below
– When continuation signals work, trend continues. When they fail, TR likely.
– Opposite surprise breakouts and FT often switch the market and get 2nd legs in that direction.
– Triangles are BOM and indicate shifting regime
– B and BB, S and SA are good strategies.
– Spike breaks are good place to look for limit order trades
Examples
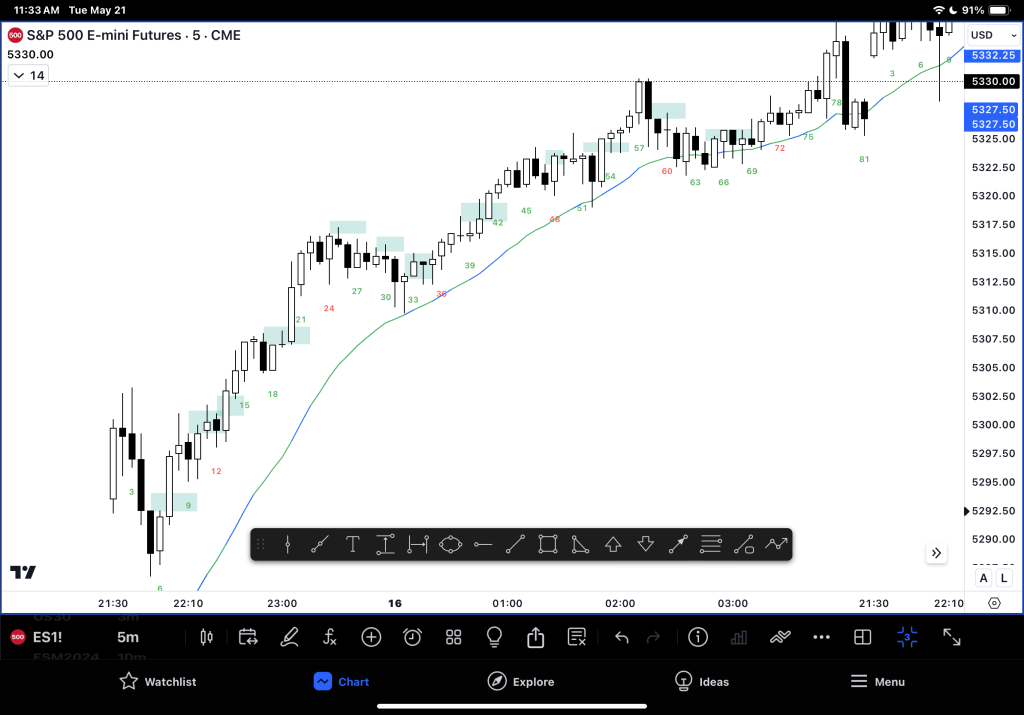
– Classic trend all day, H1 and H2 always work with minimal stress
– Classic trading range day, pullback trading a sure loser today, fading was the correct way to trade.
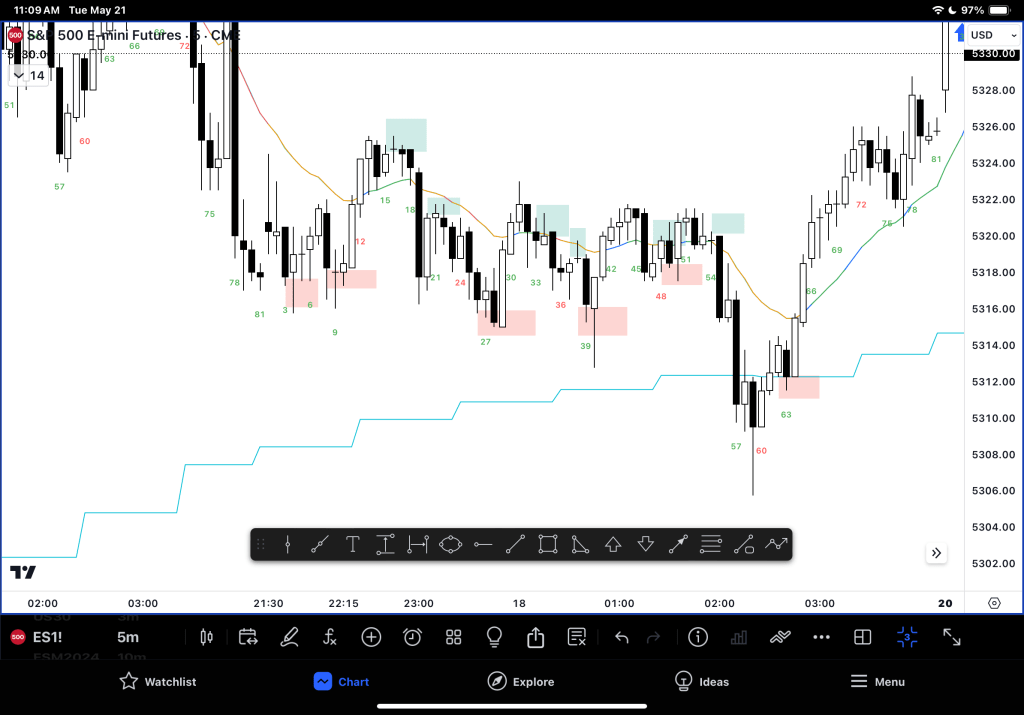
– We don’t know exactly where the top and bottom is. But we can watch and see what happens to traders who take them.
– On the above chart, the first two sells failed and got a new high – TR likely.
– That means taking that buy up there is low probability.
– Now we need to look at when a day switches
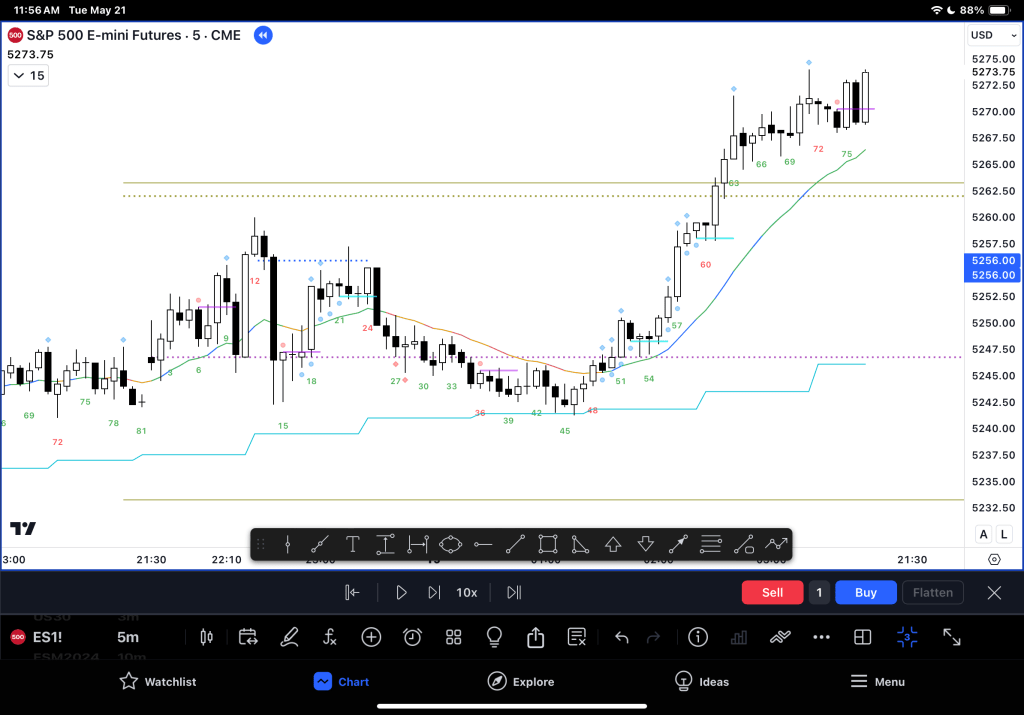
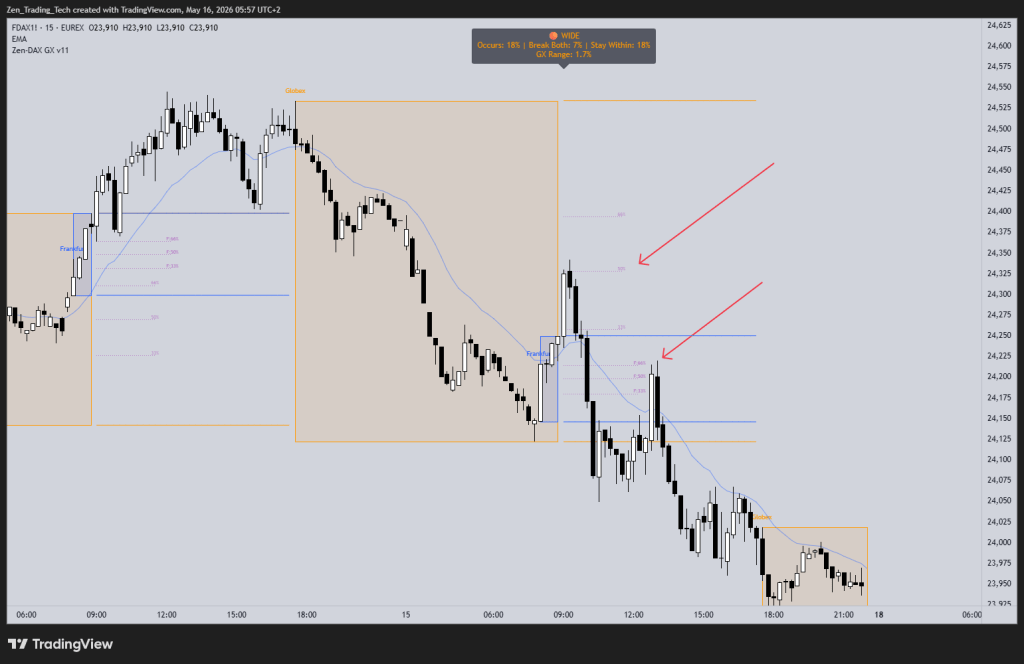
– Below, trend to TR to trend to TR

– Any H1 or H2 in the morning was pretty good although it took a long time to get any profit.
– Surprise BO and FT switched the market. First from bull trend to TR. Then from TR to bear trend.
– But the channel was broad enough for two sided trading most of the rest of the day.
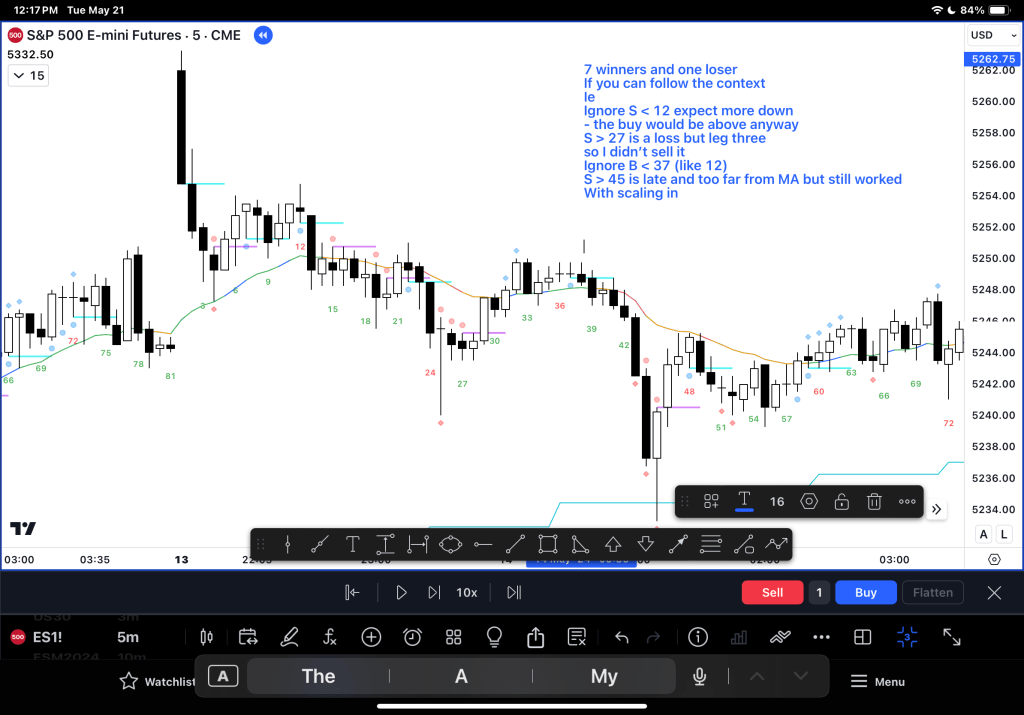
– Another example below, slightly different dynamics

– Here bulls did not get so trapped with a failed H1 high like the example before.
– Instead deep pullbacks allowed smart traders to exit safely.
– Triangles are a sign of BOM and potential regime change.
– A strategy that makes sense is a H1 – B and BB (High 1 buy and buy below) and a L1 S and SA (Low 1 sell and sell above.)
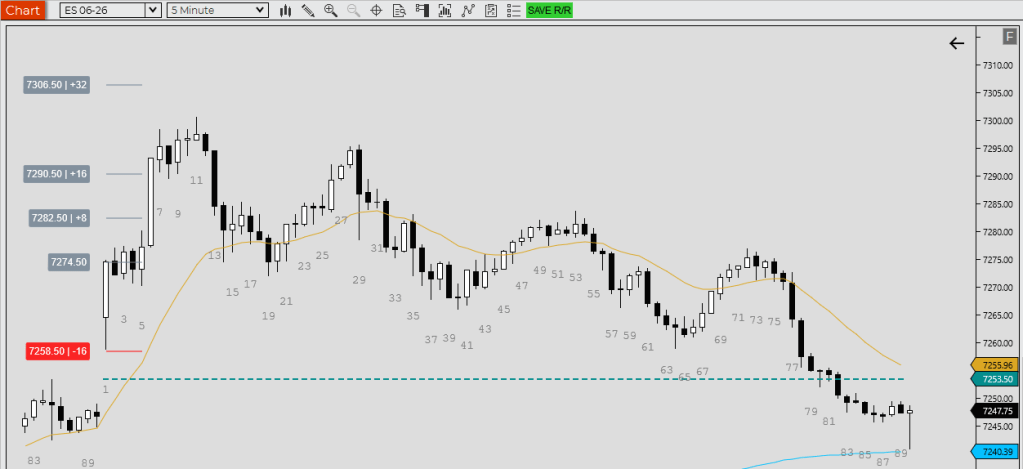
– You can also see where the spike breaks are and how often limit order trades set up there.
– Let’s explore spike breaks further
Spike Breaks
– I wrote an indicator I will post link here to find them
– 2 ways to trade them. Continuation areas, where higher lows and lower highs indicate which way to go.
– The other way is as test targets and magnets when we start closing gaps
– The best part, is when you take a loss, mark that area because you will likely make your money back when we come back there

– Above when we switch from trend to TR, they become magnets for scaling in and limit order entries

Spike break hit rate

Further research
– It’s most helpful in connection with breakout trading so I recommend using it in that way.
– Then when trend fails and becomes a TR, spike breaks are one way to use limit orders and scaling in to trade when sideways.
– Example: With overlap indicator


Leave a comment