The US voted in the midterms on Tuesday 3 November 2026. The results came in this morning, during the Asia session. So I went back and pulled every US election results day since 2010, to see what FDAX did on each one.
Eight results days. Four presidential, four midterm. Newest first.
One note on units before we start. I measure every move as a percentage of ADR (average daily range). In my own indicator the column is called ABR, an 8-bar average of the daily range. That is my own measure, not a standard one. It lets a 2010 day and a 2024 day sit side by side, even though the DAX is nearly four times the price now.
When the results land
The US votes on a Tuesday. The day session closes at 17:30 Frankfurt and the FDAX night session at 22:00. The first US polls close at 00:00 Frankfurt. So no results land during Tuesday’s trading.
- The count runs from about 07:00 to 14:00 Taipei on the Wednesday.
- The FDAX day session runs 09:00 to 17:30 Frankfurt (16:00 to 00:30 Taipei). It opens about two hours after the count ends.
- So the day session opens with the result known, and the reaction shows as the opening gap. Two exceptions: 2020 (Biden called on the Saturday) and 2022 (House called the next week).
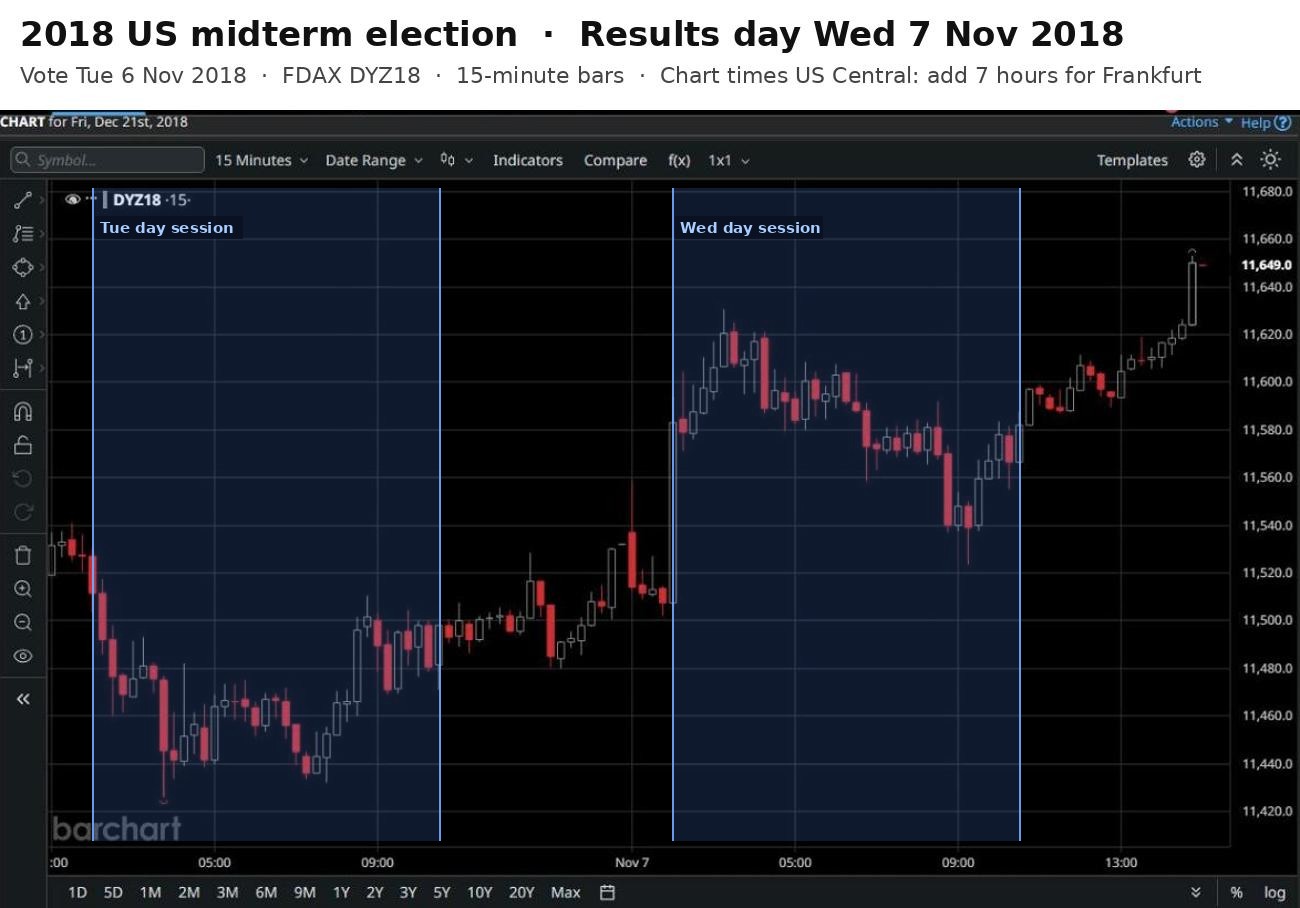
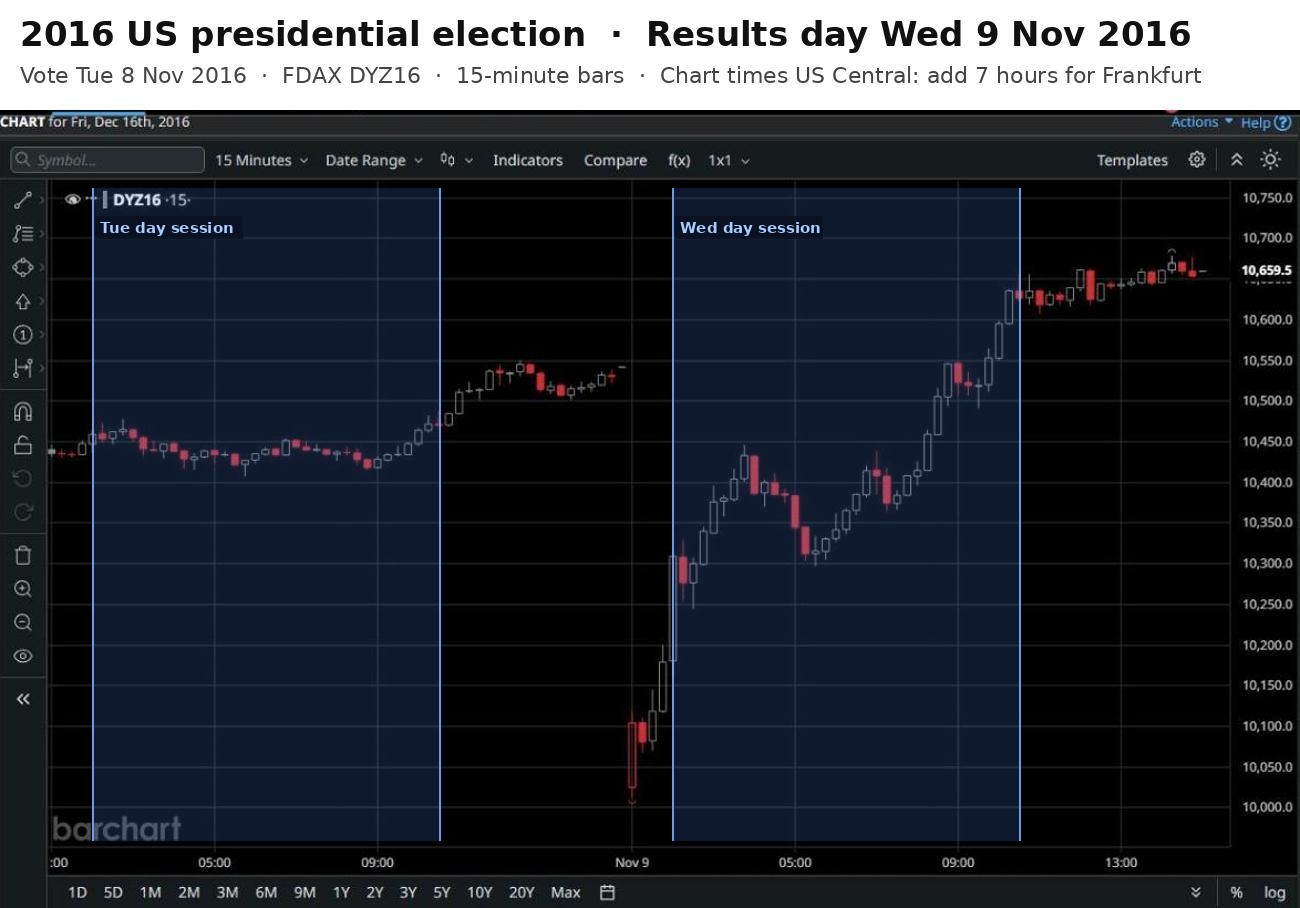
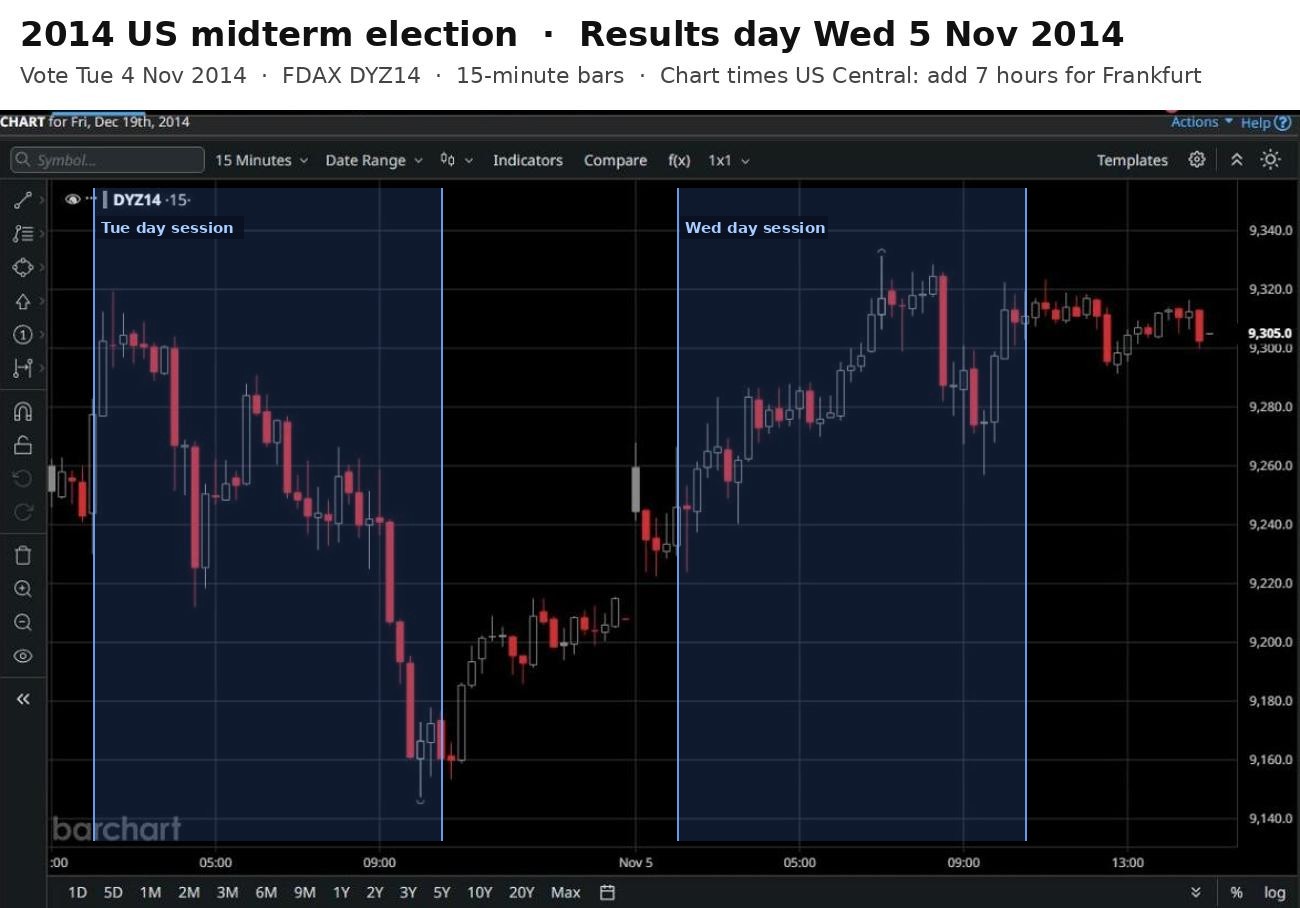
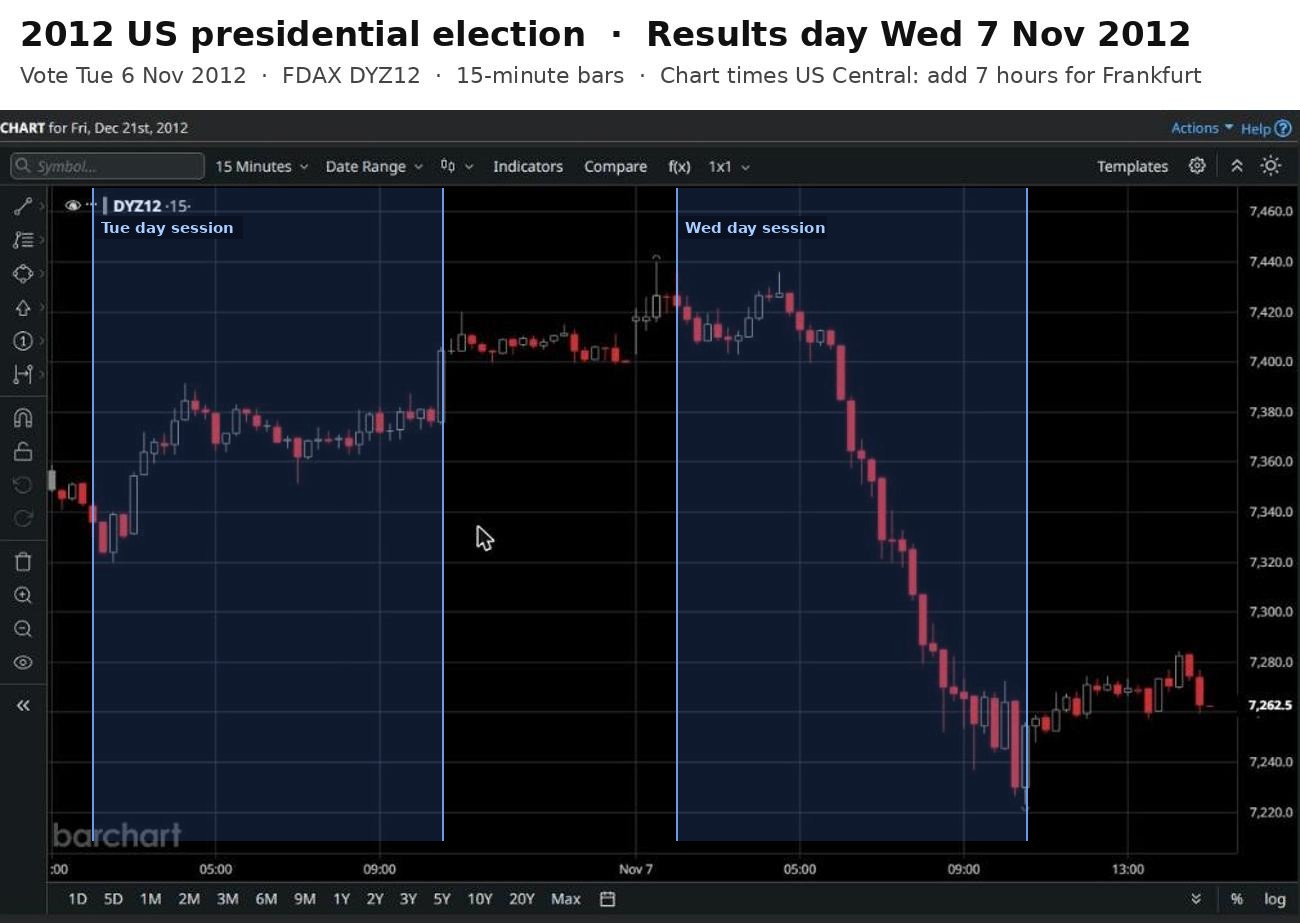
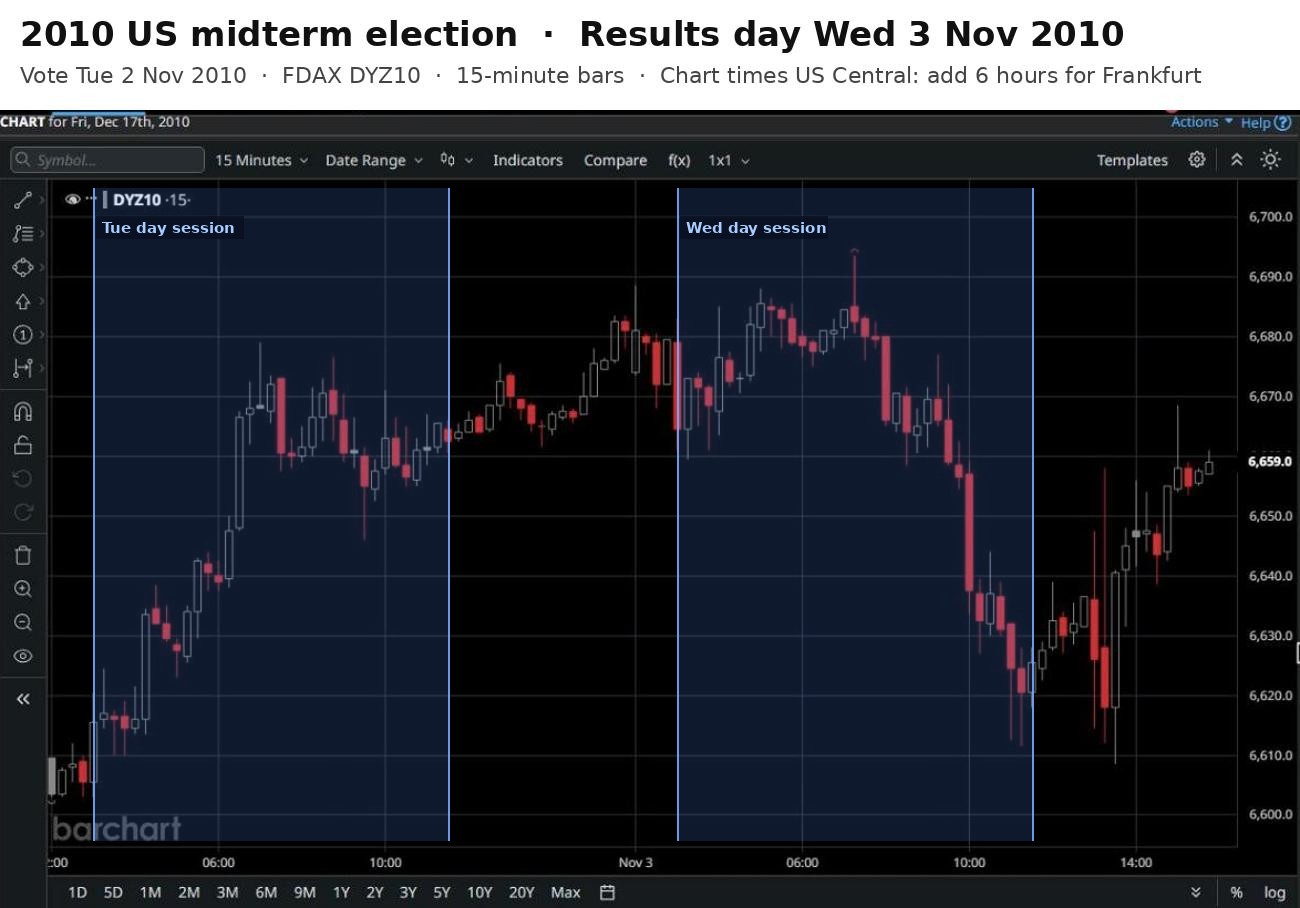
Everything below is the day session only. The 2010 to 2020 charts come from Barchart and include the night session, so I have marked the two day sessions in blue. The gap is the move from the right edge of the Tuesday band to the left edge of the Wednesday band. On most of these charts the night bars fill that space, so it does not look like an empty gap. 2016 does, because FDAX was closed from 22:00 to 08:00 back then and price moved a long way while it was closed.
The eight results days
Day session (09:00 to 17:30 Frankfurt). Gap = Wednesday’s open against Tuesday’s close. Close = Wednesday’s close against Tuesday’s close. All in % of ADR.
| Results day | Election | Gap | Range | Close |
|---|---|---|---|---|
| Wed 6 Nov 2024 | Presidential | +43% | 316% | −124% |
| Wed 9 Nov 2022 | Midterm | −29% | 69% | −3% |
| Wed 4 Nov 2020 | Presidential | −68% | 189% | +87% |
| Wed 7 Nov 2018 | Midterm | +18% | 82% | +56% |
| Wed 9 Nov 2016 | Presidential | −278% | 454% | +157% |
| Wed 5 Nov 2014 | Midterm | +40% | 71% | +90% |
| Wed 7 Nov 2012 | Presidential | +65% | 274% | −192% |
| Wed 3 Nov 2010 | Midterm | +21% | 126% | −69% |
For comparison, across all 4,727 FDAX days from March 2008 to October 2026: the average gap is 34% of ADR (up or down) and the average range is 103% of ADR.
What stands out
Simply: presidential results days were big days. Midterm results days were normal days.
- Presidential: ranges of 189% to 454% of ADR, average 308%. Only 5% of all FDAX days reach even 189%. All four presidential results days did.
- Midterm: ranges of 69% to 126% of ADR, average 87%. That is a little smaller than an average day (103%).
- Against the gap: on all four presidential days, the day session went the opposite way to the gap. 2024 gapped up and closed down. 2016 gapped down and closed up. 2020 and 2012 did the same. On the midterm days it happened 2 times out of 4. Across every FDAX day with a gap of 40% of ADR or more, the session went against the gap 47% of the time. Coin flip.
- Direction: no lean. Four results days closed up and four closed down.
Caveat going in: four presidential days is thin. Four out of four against the gap is a pattern worth watching, not a finding.
2024 presidential — Wed 6 Nov
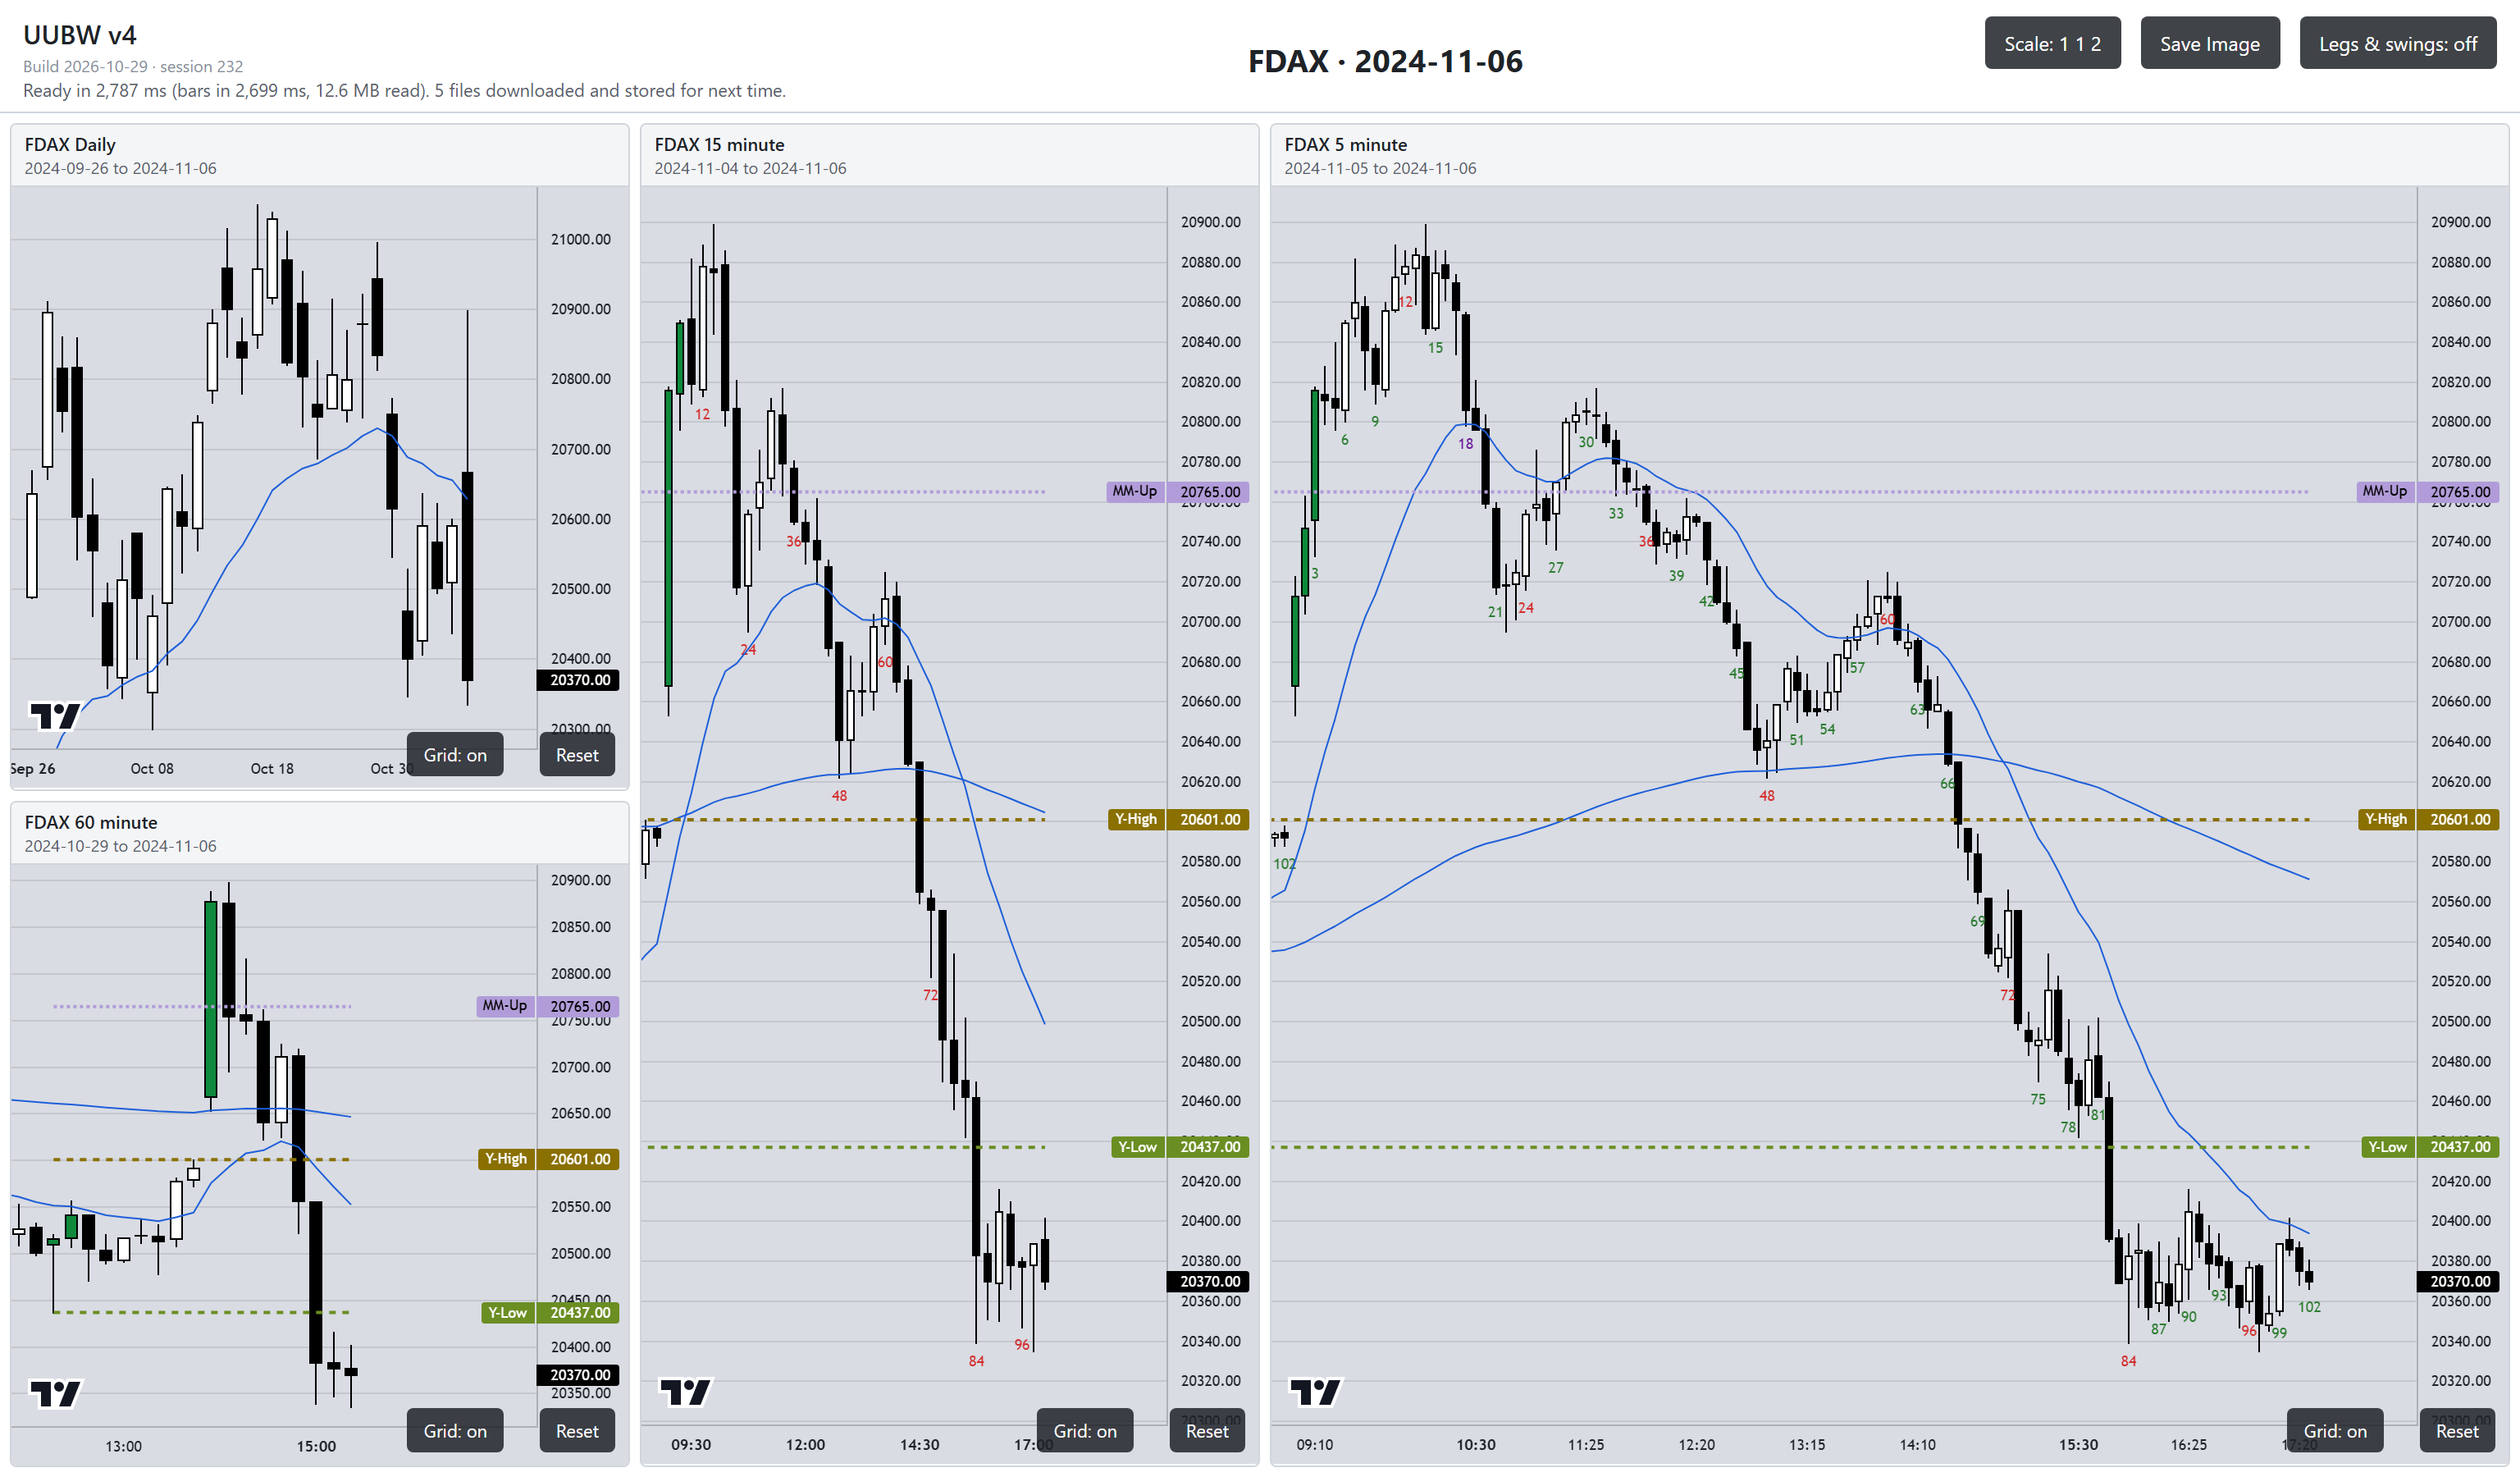
Background. Trump (Republican) beat Harris (Democrat), the sitting Vice President. Trump was projected the winner overnight. Republicans took the Senate. The House was still being counted that week.
FDAX day session. It opened above yesterday’s high, with a gap of +43% of ADR. It rallied in the first hour, then sold off for the rest of the day. It broke yesterday’s low after 15:30 and closed near the low. Range 316% of ADR.
2022 midterm — Wed 9 Nov
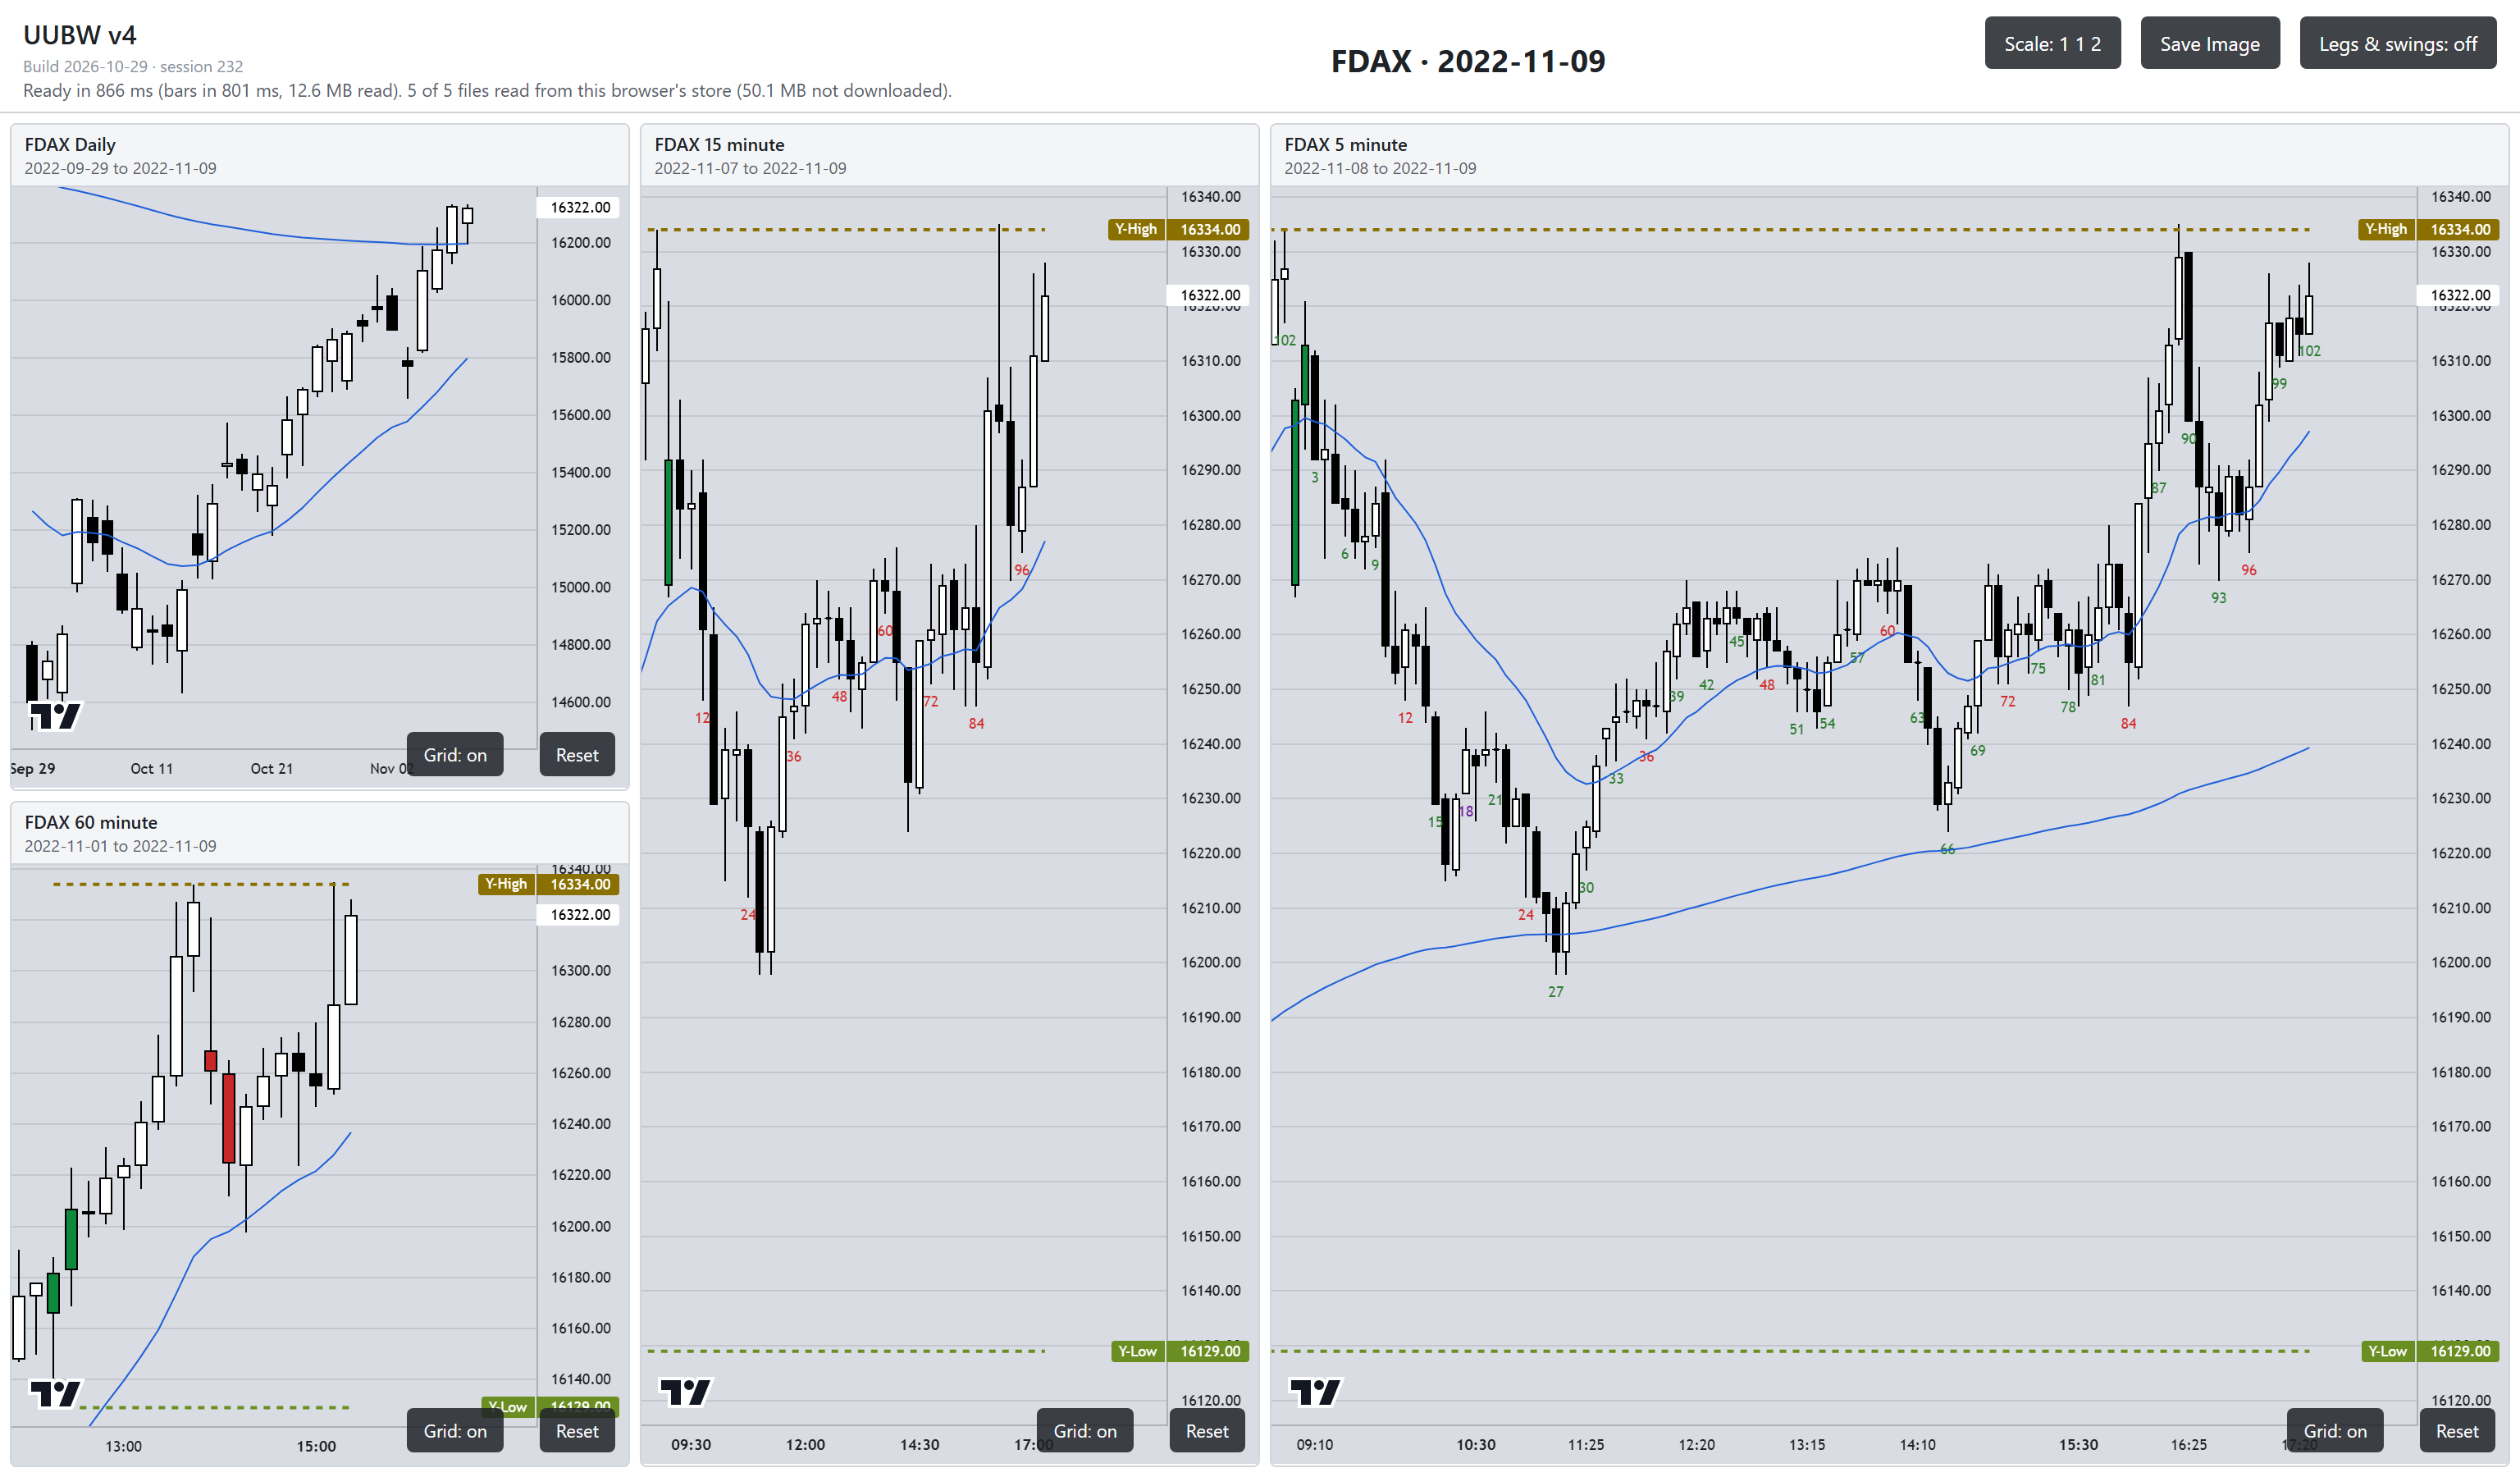
Background. Biden (Democrat) was President. The polls pointed to a Republican “red wave”. It did not come. Democrats kept the Senate, sealed on Saturday 12 November. Republicans took the House by a thin margin the next week. On the results day neither house was settled.
FDAX day session. It gapped down 29% of ADR and opened inside yesterday’s range. It made its low around 11:25, then climbed all afternoon to test yesterday’s high. Range 69% of ADR. A small day. The big move that week came on Thursday 10 November, on the US inflation report, not on the vote.
2020 presidential — Wed 4 Nov
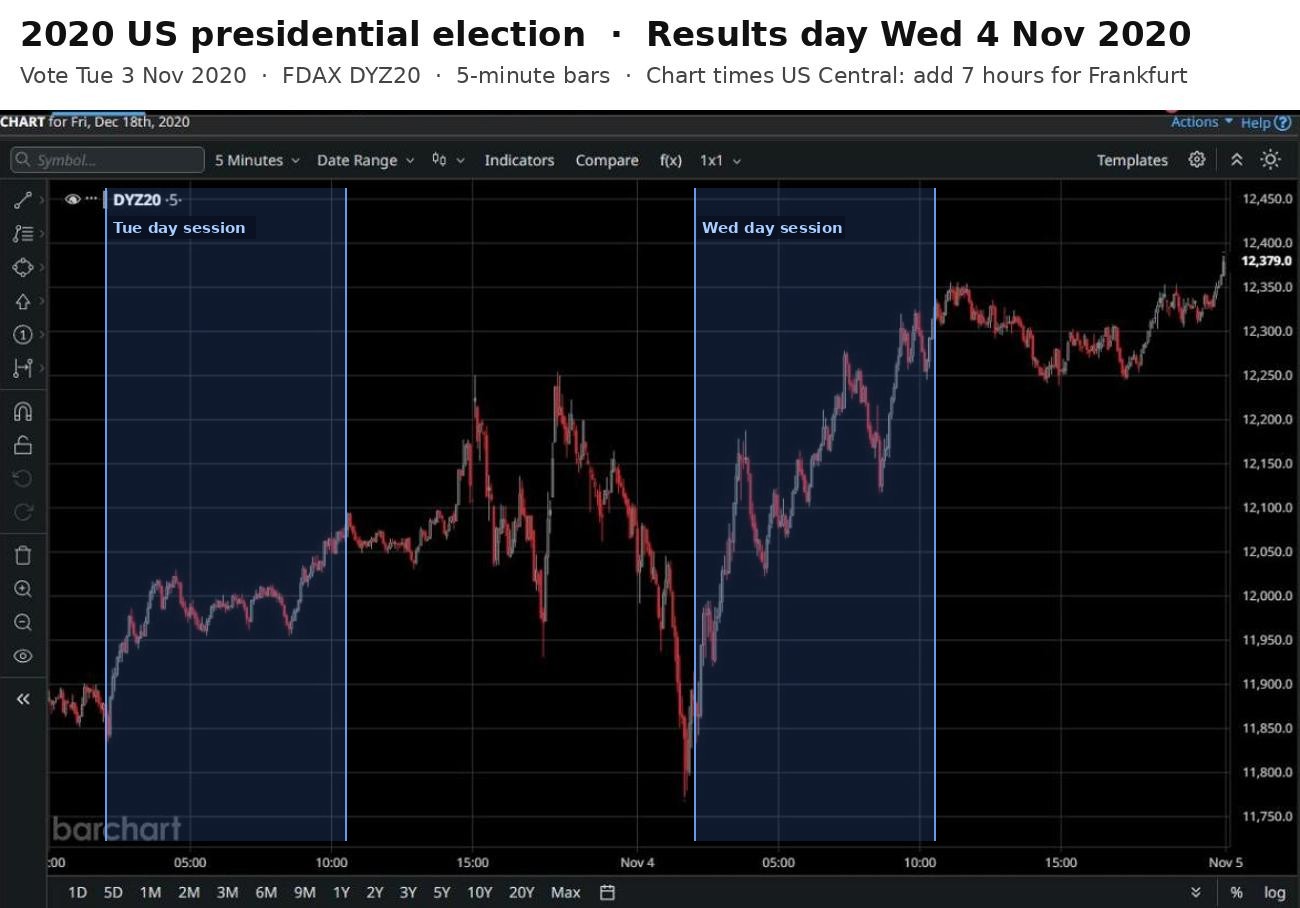
Background. Trump (Republican, the sitting President) against Biden (Democrat). There was no winner on the day. The count ran until Saturday 7 November, when Biden was called.
FDAX day session. Gap −68% of ADR. The night session swung both ways and made its low just before the open. The day session climbed all day and closed near the high. Range 189%, close +87% of ADR.
2018 midterm — Wed 7 Nov
Background. Trump was President. Democrats won the House. Republicans kept the Senate and gained seats.
FDAX day session. Gap +18% of ADR. It jumped in the first 15 minutes, dipped in the afternoon, and recovered by the close. Range 82%, close +56% of ADR. A quiet day.
2016 presidential — Wed 9 Nov
Background. Trump (Republican) beat Clinton (Democrat), against the polls. US futures fell hard overnight as Trump took the lead, then recovered. The Dow closed near a record high the same day.
FDAX day session. Gap −278% of ADR: it opened below yesterday’s low. It rallied all day and closed on the high. Range 454% of ADR, the biggest day of the eight. Close +157%.
2014 midterm — Wed 5 Nov
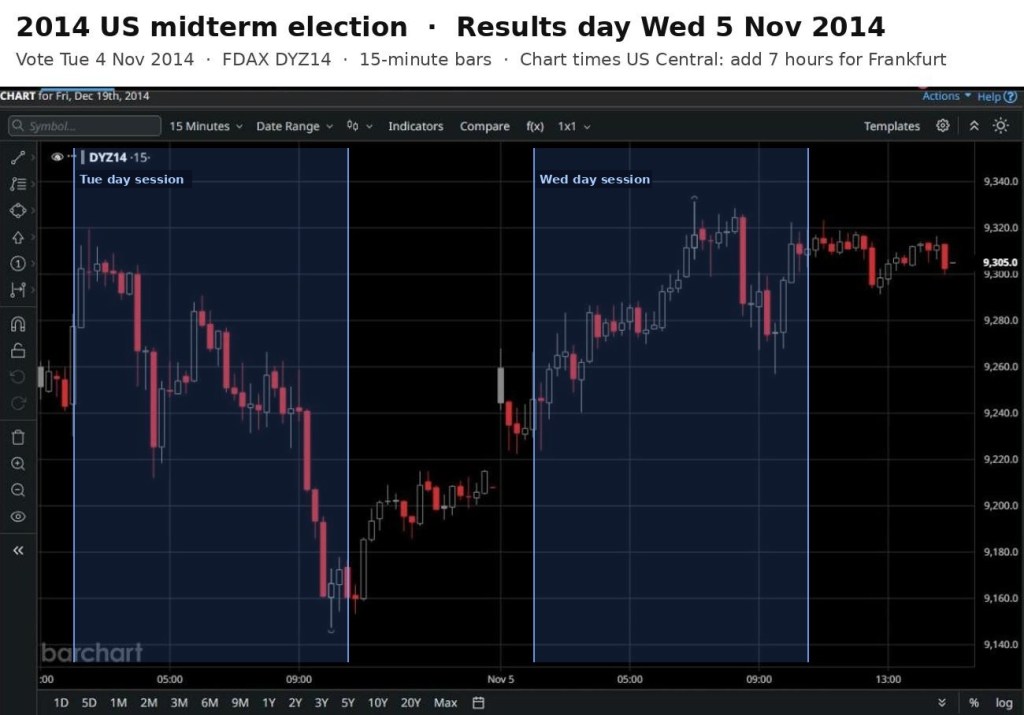
Background. Obama (Democrat) was President. Republicans took the Senate and kept the House.
FDAX day session. Gap +40% of ADR. It rose to the high in the early afternoon, sold back, then recovered and closed near the high. Range 71%, close +90% of ADR.
2012 presidential — Wed 7 Nov
Background. Obama (Democrat) beat Romney (Republican). US stocks fell about 2% of price that day, on worry about the “fiscal cliff”: tax rises and spending cuts due in January.
FDAX day session. Gap +65% of ADR: it opened above yesterday’s high. It went sideways for about three hours, then sold off from about 12:00 and closed on the low. Range 274%, close −192% of ADR.
2010 midterm — Wed 3 Nov
Background. Obama was President. Republicans gained 63 House seats and took the House. Democrats kept the Senate.
FDAX day session. Gap +21% of ADR. It held near the high through the morning, sold off from about 14:00, and closed near the low. Range 126%, close −69% of ADR. That evening, after the day session, the Fed announced QE2 (its second round of bond buying) at 19:15 Frankfurt.
Today
Today is a midterm results day. On these eight, midterm results days were normal-size days and presidential ones were big. Today’s goes into the table once the data is in.
Pull up the same days on FDAX, or whatever you trade, and check my numbers.
Sources: FDAX numbers from my own FDAX daily data (day session). 2010 to 2020 charts from Barchart. Election results: OPB (2024), The Peninsula (2022), CGTN (2020), PBS (2018), UPI (2016), Wikipedia (2014), NPR (2012), Wikipedia (2010), Calculated Risk (QE2). FDAX trading hours: Trading-Treff.
Happy trading!
Tim
Zen Trading Tech



Leave a Reply