This is part 5 in a research series called My First Trading Edges.
Commonly quoted trading statistics. Each one is something you can check for yourself, with free data and one prompt. No indicator needed.
The series started with Research Kit #1: Daily Range Distribution.
This is Research Kit #5: bar 1 is the high or the low of the day.
The statistic
A commonly quoted trading statistic: bar 1 on the 5-minute chart is the high or the low of the day about 20% of the time. One day in five.
Bar 1 is the first bar every trader sees. So I wanted a number on it.
It’s low probability, and hence a reasonable scalp target. But I want every part of my trading system to have research behind it. I advise other traders to do the same.
What I tested
- ES (E-mini S&P 500 futures): day session only, 08:30 to 15:15 Chicago time. Bar 1 is 08:30 to 08:35. January 2016 to October 2026.
- FDAX (DAX futures): Xetra session only, 09:00 to 17:30 Berlin time. Bar 1 is 09:00 to 09:05. September 2021 to October 2026.
- Full sessions only. Short holiday sessions are left out.
- Bar 1 is the high of the day when bar 1’s high equals the highest price of the session. If a later bar only matches it, bar 1 still counts. It printed that price first.
- The same rule applies to the low.
The result
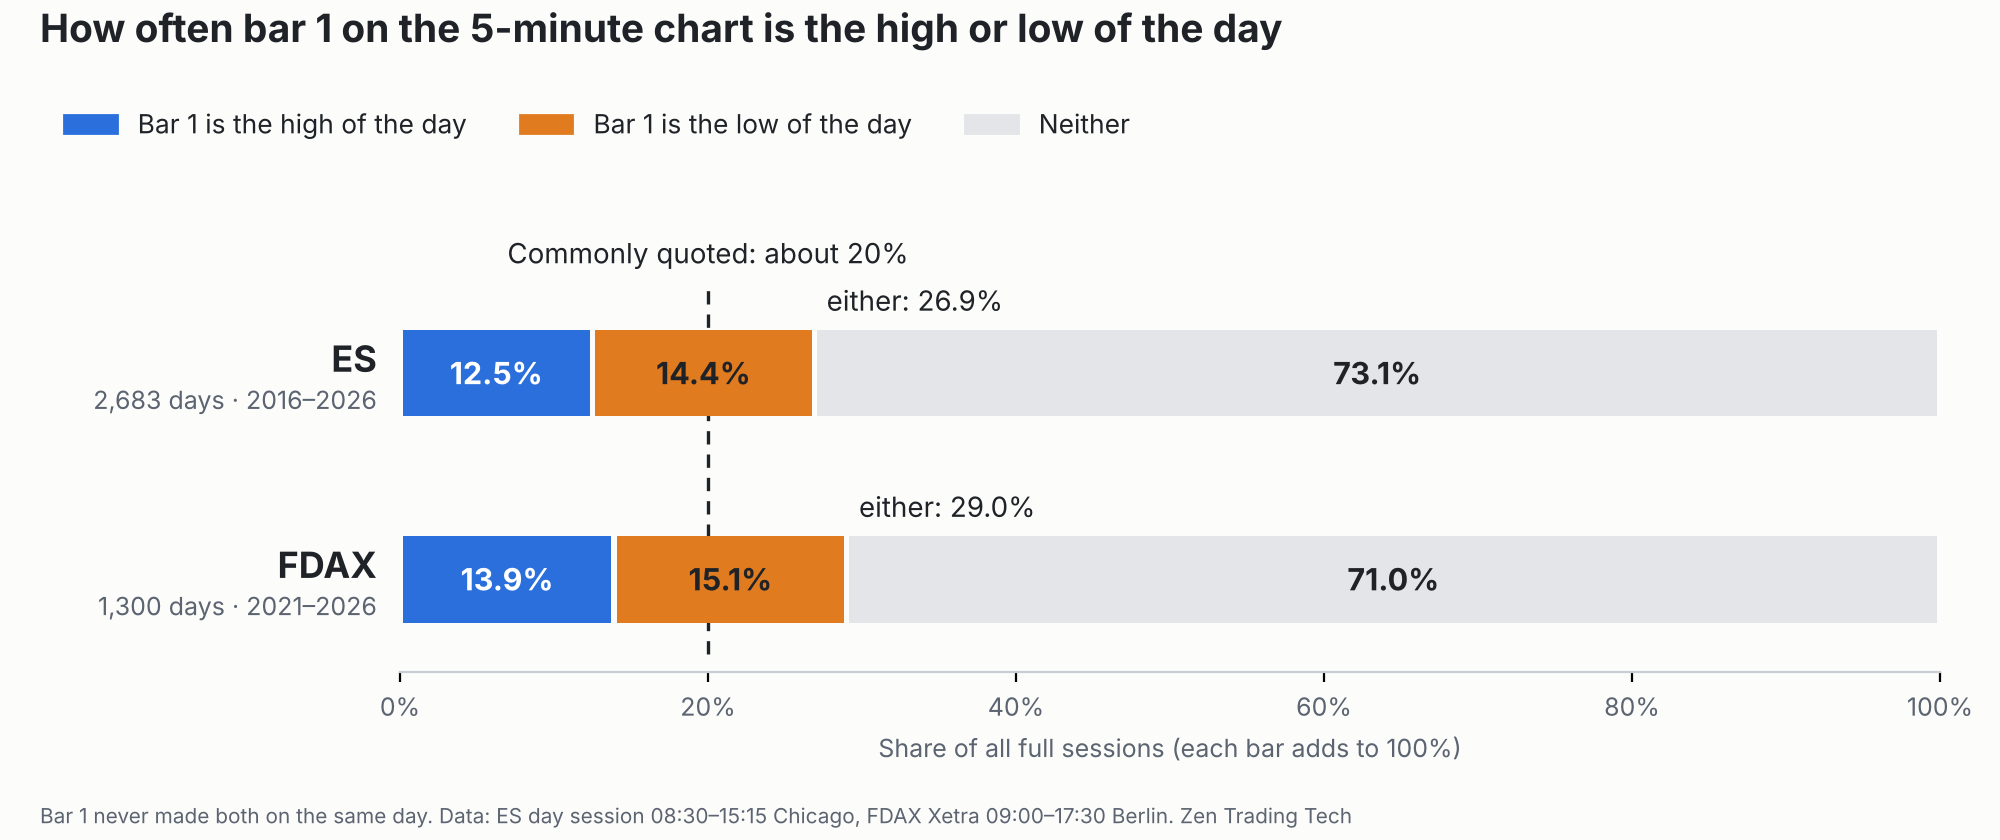
| Bar 1 is… | ES (2,683 days) | FDAX (1,300 days) |
|---|---|---|
| The high of the day | 12.5% | 13.9% |
| The low of the day | 14.4% | 15.1% |
| Neither | 73.1% | 71.0% |
| Total | 100% | 100% |
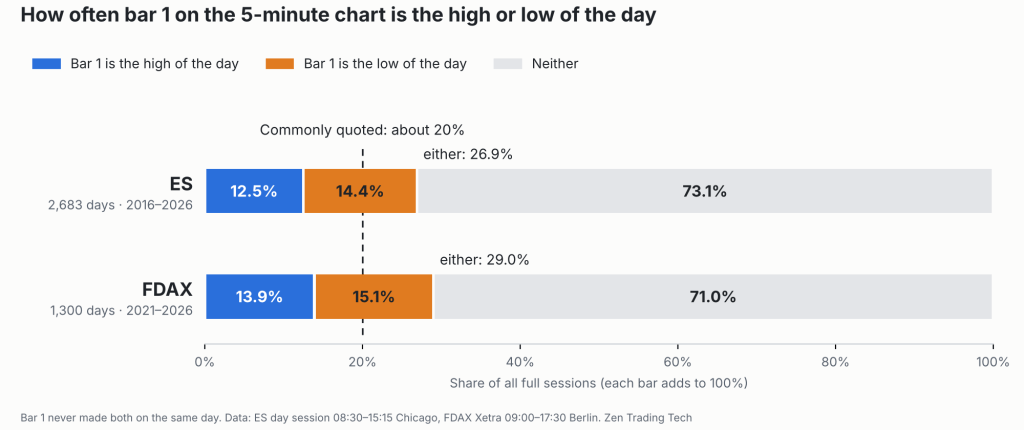
Simply: bar 1 is the high or the low of the day on 26.9% of ES days and 29.0% of FDAX days. Closer to one day in four than one day in five.
It held year to year too. ES never dropped below 20% in any year of the data. The lowest year was 2024, at 21.3% of days.
Here’s the other side of it. On about 3 days in 4, price trades above bar 1’s high and below bar 1’s low before the close.
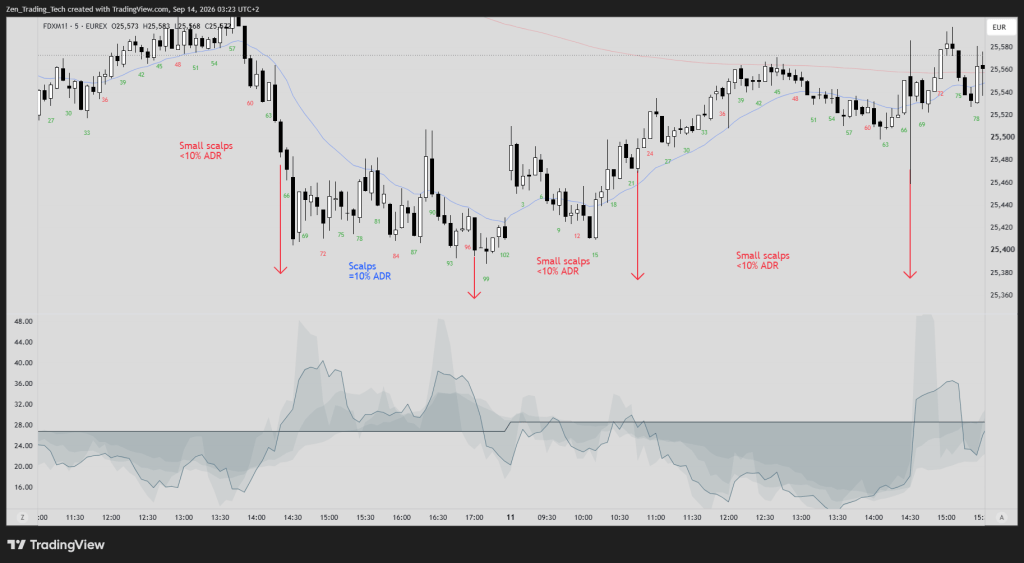
Two examples
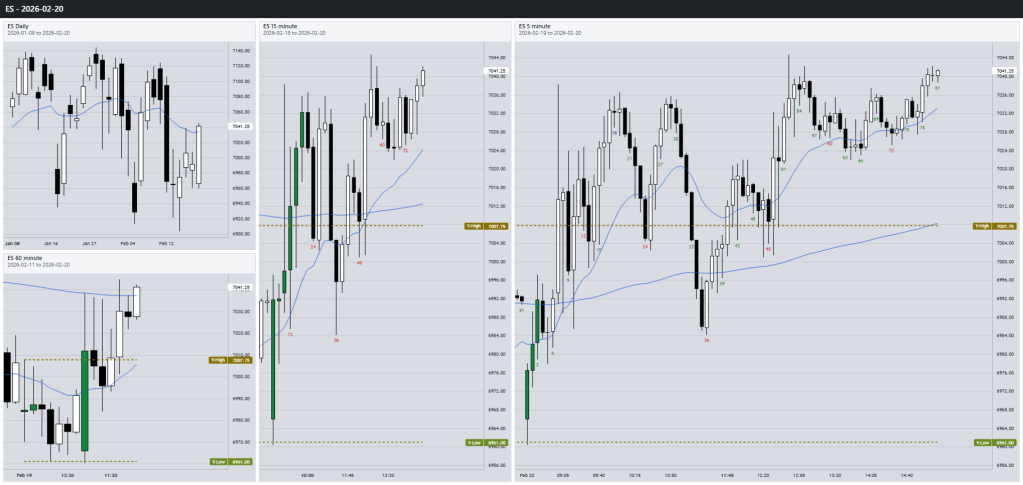
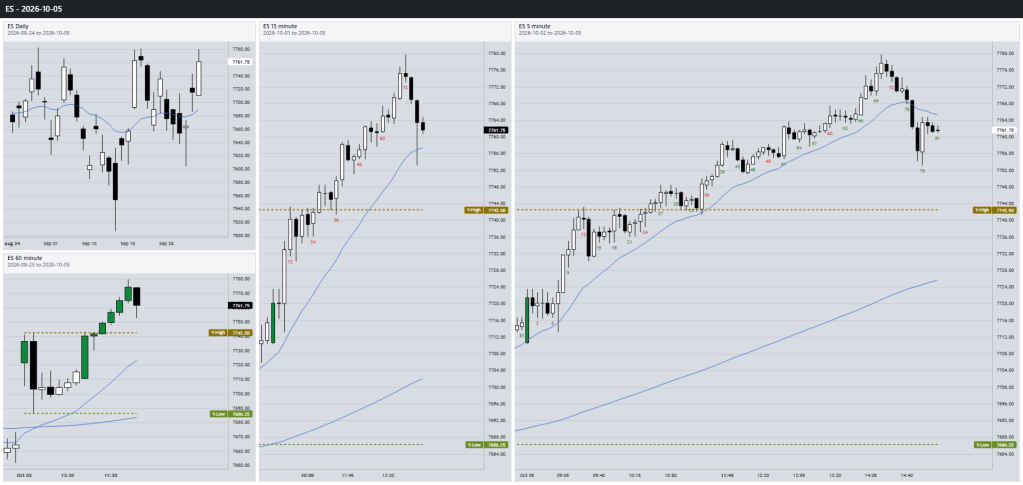
Bar 1 Low of the day
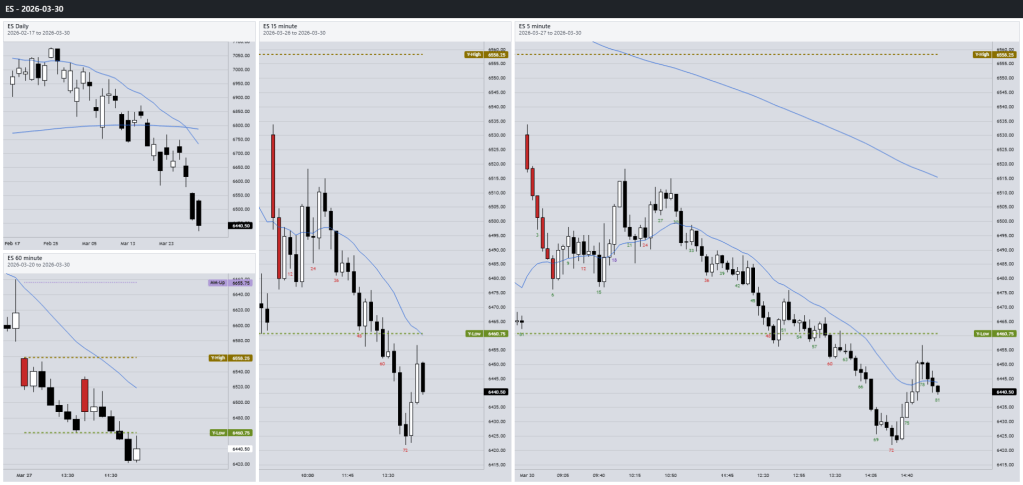
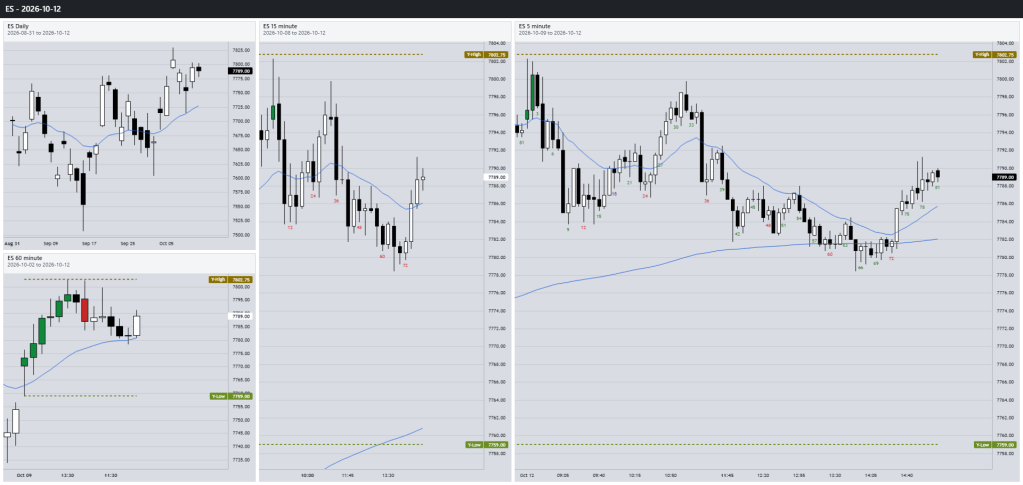
Bar 1 High of the day
What this number is, and what it isn’t
It’s a base rate. How often something happens on an ordinary day, with no setup and no filter.
It doesn’t tell you which days. And a probability on its own isn’t a trade. You still need the risk and the reward to go with it. That part is yours.
Run it yourself
Everything is on my GitHub: the data, the rules, the prompt and a Python script. Free.
Bar 1 High or Low of the Day: Research Kit
- Download the file from the kit’s
datafolder. It holds only date, time, bar number and price. - Open a new chat in Claude, attach the file and paste the prompt from the kit.
- Check your result against mine. On the ES file you should get 26.9% of 2,683 days.
Or run it on whatever you trade. The kit explains how to export your own data from TradingView.
Feel free to check the numbers for yourself.
Next in the series: Research Kit #6: The high or low of the day in the first 90 minutes.
My First Trading Edges: Research Kits #5 to #8
- Research Kit #5: Bar 1 is the high or low of the day (this post)
- Research Kit #6: The high or low of the day in the first 90 minutes
- Research Kit #7: The day session breaks the Globex high or low
- Research Kit #8: Price touches the 20 EMA
Happy trading!
Tim
Zen Trading Tech



Leave a Reply