This is part 7 in a research series called My First Trading Edges. Commonly quoted trading statistics. Each one is something you can check for yourself, with free data and one prompt. No indicator needed.
Missed the last one? The high or low of the day in the first 90 minutes (link coming soon).
This one: the day session breaks the Globex high or the Globex low.
The statistic
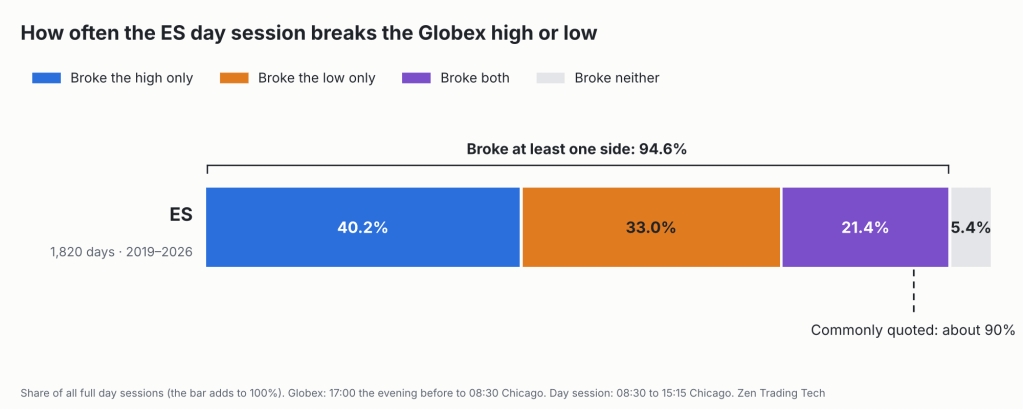
A commonly quoted trading statistic: the day session trades above the Globex high or below the Globex low about 90% of the time.
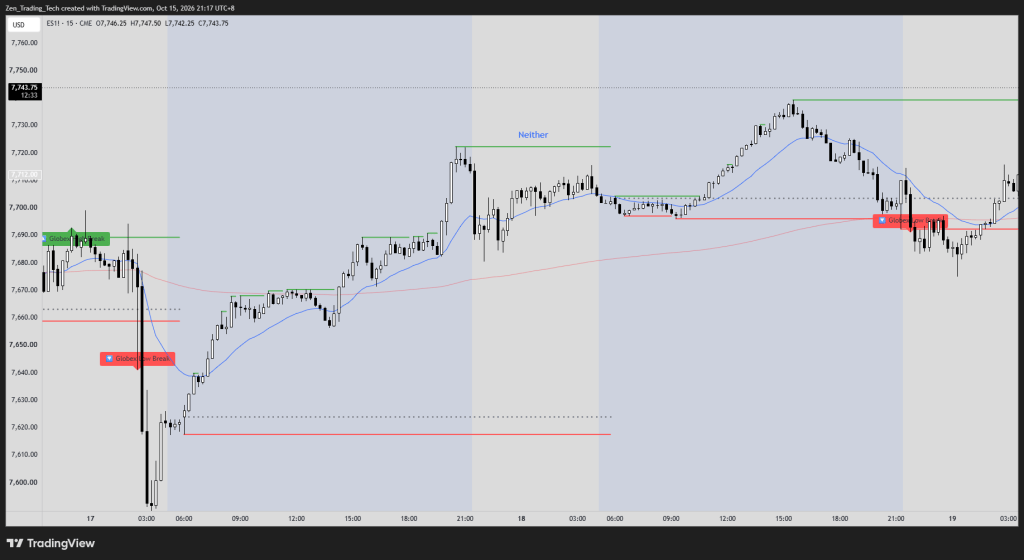
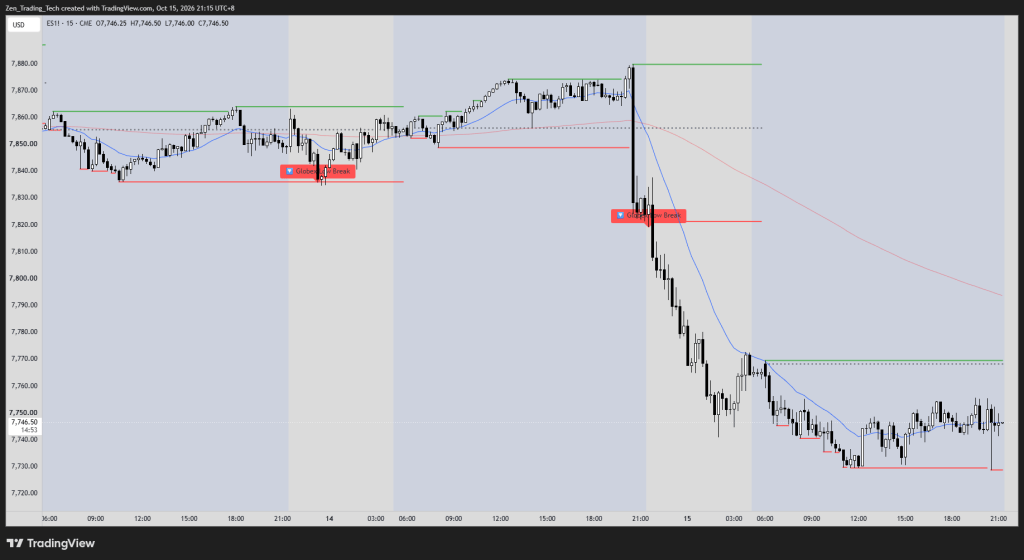
Globex is the overnight session. On ES it runs from 17:00 Chicago time the evening before until the day session opens at 08:30. Its high and its low are two levels you can mark before the open.
What I tested
- ES (E-mini S&P 500 futures), 15-minute bars covering the full 24 hours. June 2019 to September 2026.
- Globex: 17:00 the evening before to 08:30 Chicago time. Sunday evening counts towards Monday.
- Day session: 08:30 to 15:15 Chicago time.
- Broke the Globex high means the day session traded above it. Matching it does not count. The same rule applies to the low.
- Full day sessions only. Short holiday sessions are left out.
The result
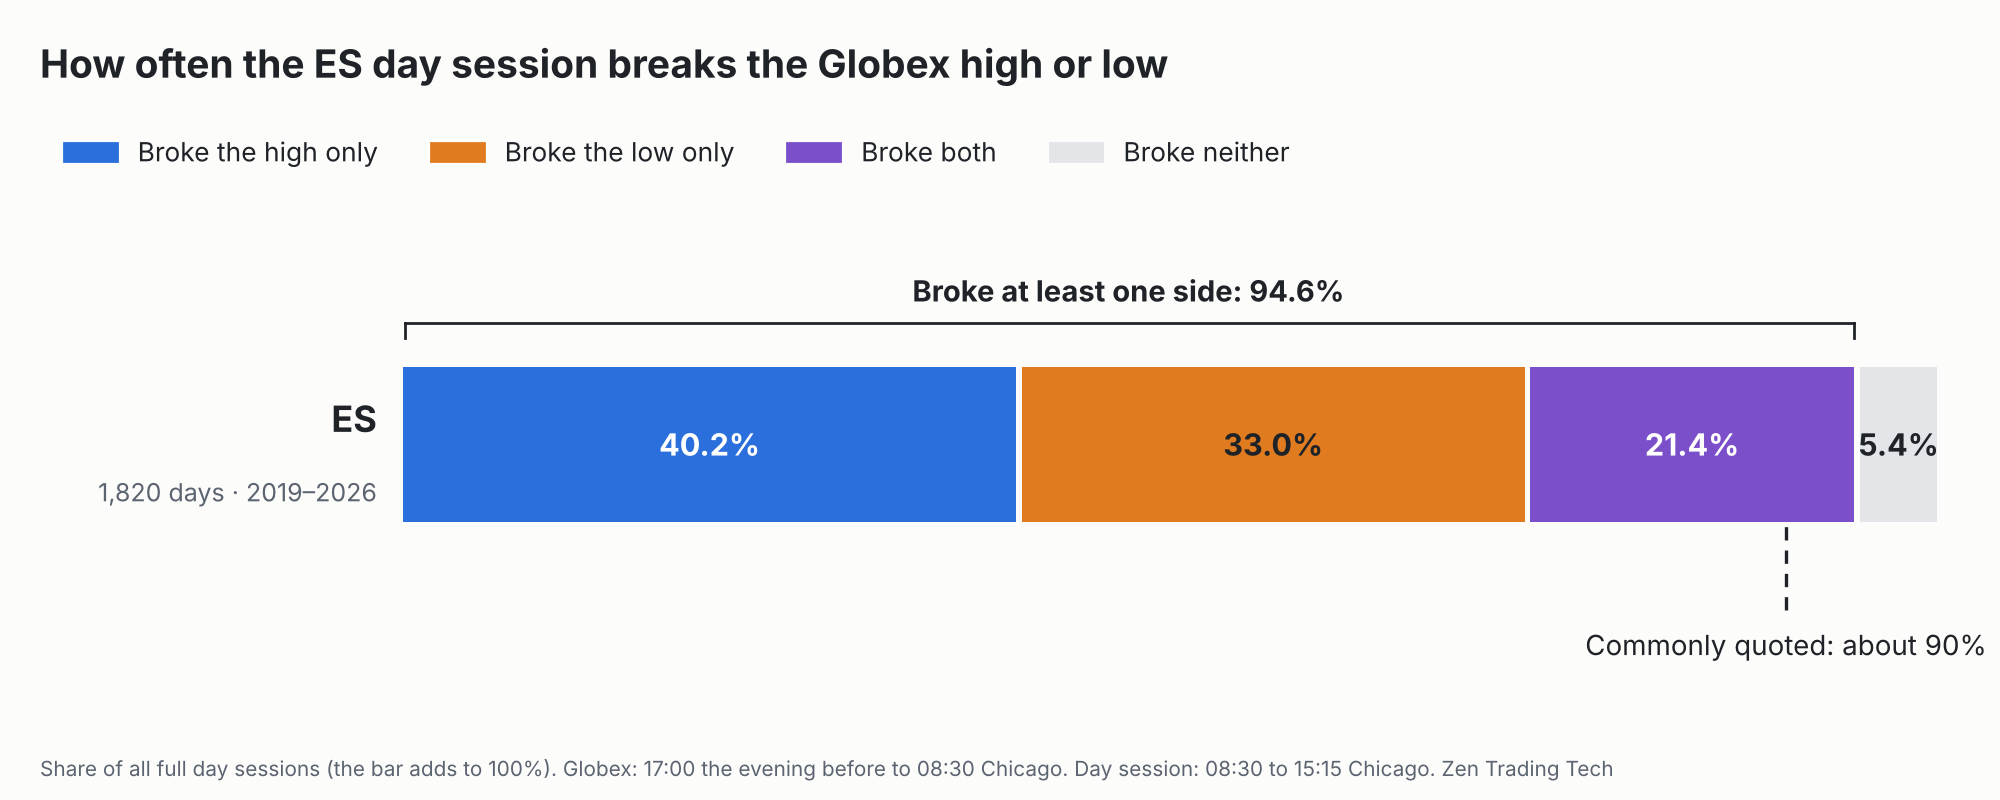
| The day session… | ES (1,820 days) |
|---|---|
| Broke the high only | 40.2% |
| Broke the low only | 33.0% |
| Broke both | 21.4% |
| Broke neither | 5.4% |
| Total | 100% |
Simply: the ES day session breaks at least one side of the Globex range on 94.6% of days.
Year by year it moves. 2019 and 2020 came in at about 89% of days. 2021 to 2026 ran between 94.7% and 97.6%.
Here’s the other side of it. On 5.4% of days, the whole day session stayed inside the overnight range.
I ran the same test on FDAX earlier. Xetra broke at least one side of the Globex range on 94.1% of days. That’s here: Research Kit #2: The DAX Pre-Market Stat That Changed How I Trade the Euro Open, with its own research kit.
More Examples
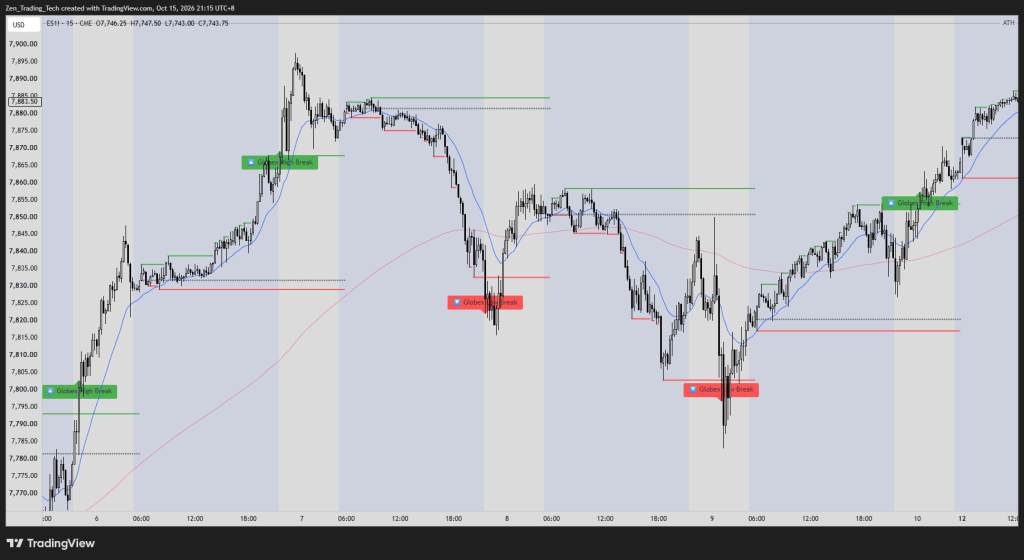
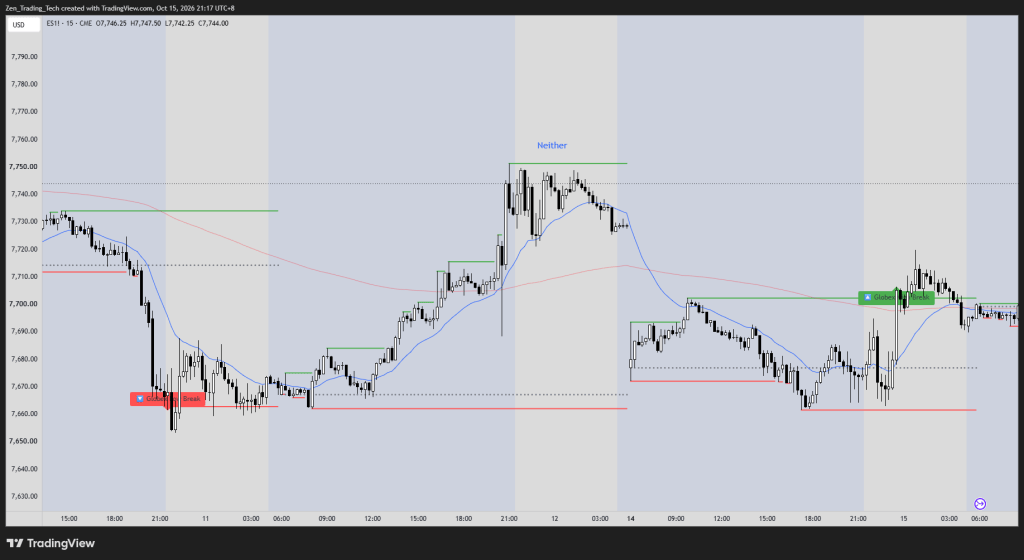
What this number is, and what it isn’t
It’s a base rate. How often something happens on an ordinary day, with no setup and no filter.
It doesn’t tell you which days. And a probability on its own isn’t a trade. You still need the risk and the reward to go with it. That part is yours.
Run it yourself
Everything is on my GitHub: the data, the rules, the prompt and a Python script. Free.
ES Pre-Market Breakout: Research Kit
- Download the file from the kit’s
datafolder. It holds only time and price, and it includes the overnight bars. - Open a new chat in Claude, attach the file and paste the prompt from the kit.
- Check your result against mine. On the ES file you should get 94.6% of 1,820 days.
Or run it on whatever you trade. The kit explains how to export your own data from TradingView.
Check my numbers. Data beats opinion.
If you want the Globex high and low drawn on your chart, I have a free indicator for that: Globex H/L Breaks.
Next in the series: Research Kit #8: Price touches the 20 EMA.
My First Trading Edges: Research Kits #5 to #8
- Research Kit #5: Bar 1 is the high or low of the day
- Research Kit #6: The high or low of the day in the first 90 minutes (link coming soon)
- Research Kit #7: The day session breaks the Globex high or low (this post)
- Research Kit #8: Price touches the 20 EMA
Happy trading!
Tim
Zen Trading Tech



Leave a Reply