This is part 6 in a research series called My First Trading Edges. Commonly quoted trading statistics. Each one is something you can check for yourself, with free data and one prompt. No indicator needed.
Missed the last one? Bar 1 is the high or low of the day.
This one: the high or the low of the day is in by the end of the first 90 minutes.
The statistic
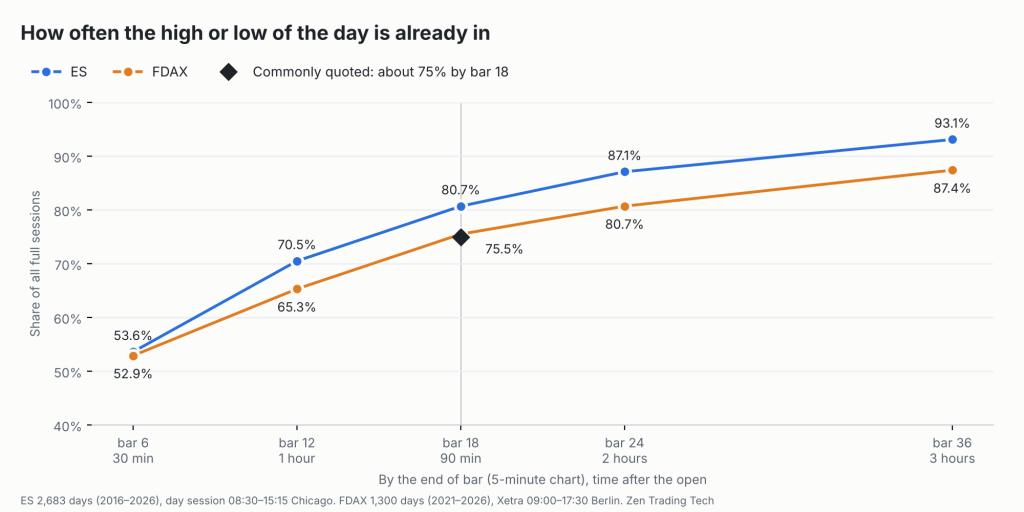
A commonly quoted trading statistic: the high or the low of the day is in by the end of bar 18 on the 5-minute chart about 75% of the time. Bar 18 ends 90 minutes after the open.
So after 90 minutes, one end of the day is usually already on the chart. You just don’t know which end yet.
What I tested
- ES (E-mini S&P 500 futures): day session only, 08:30 to 15:15 Chicago time. Bar 18 ends at 10:00. January 2016 to October 2026.
- FDAX (DAX futures): Xetra session only, 09:00 to 17:30 Berlin time. Bar 18 ends at 10:30. September 2021 to October 2026.
- Full sessions only. Short holiday sessions are left out.
- A day counts when the high, the low, or both were made in bars 1 to 18.
The result
| By the end of… | ES (2,683 days) | FDAX (1,300 days) |
|---|---|---|
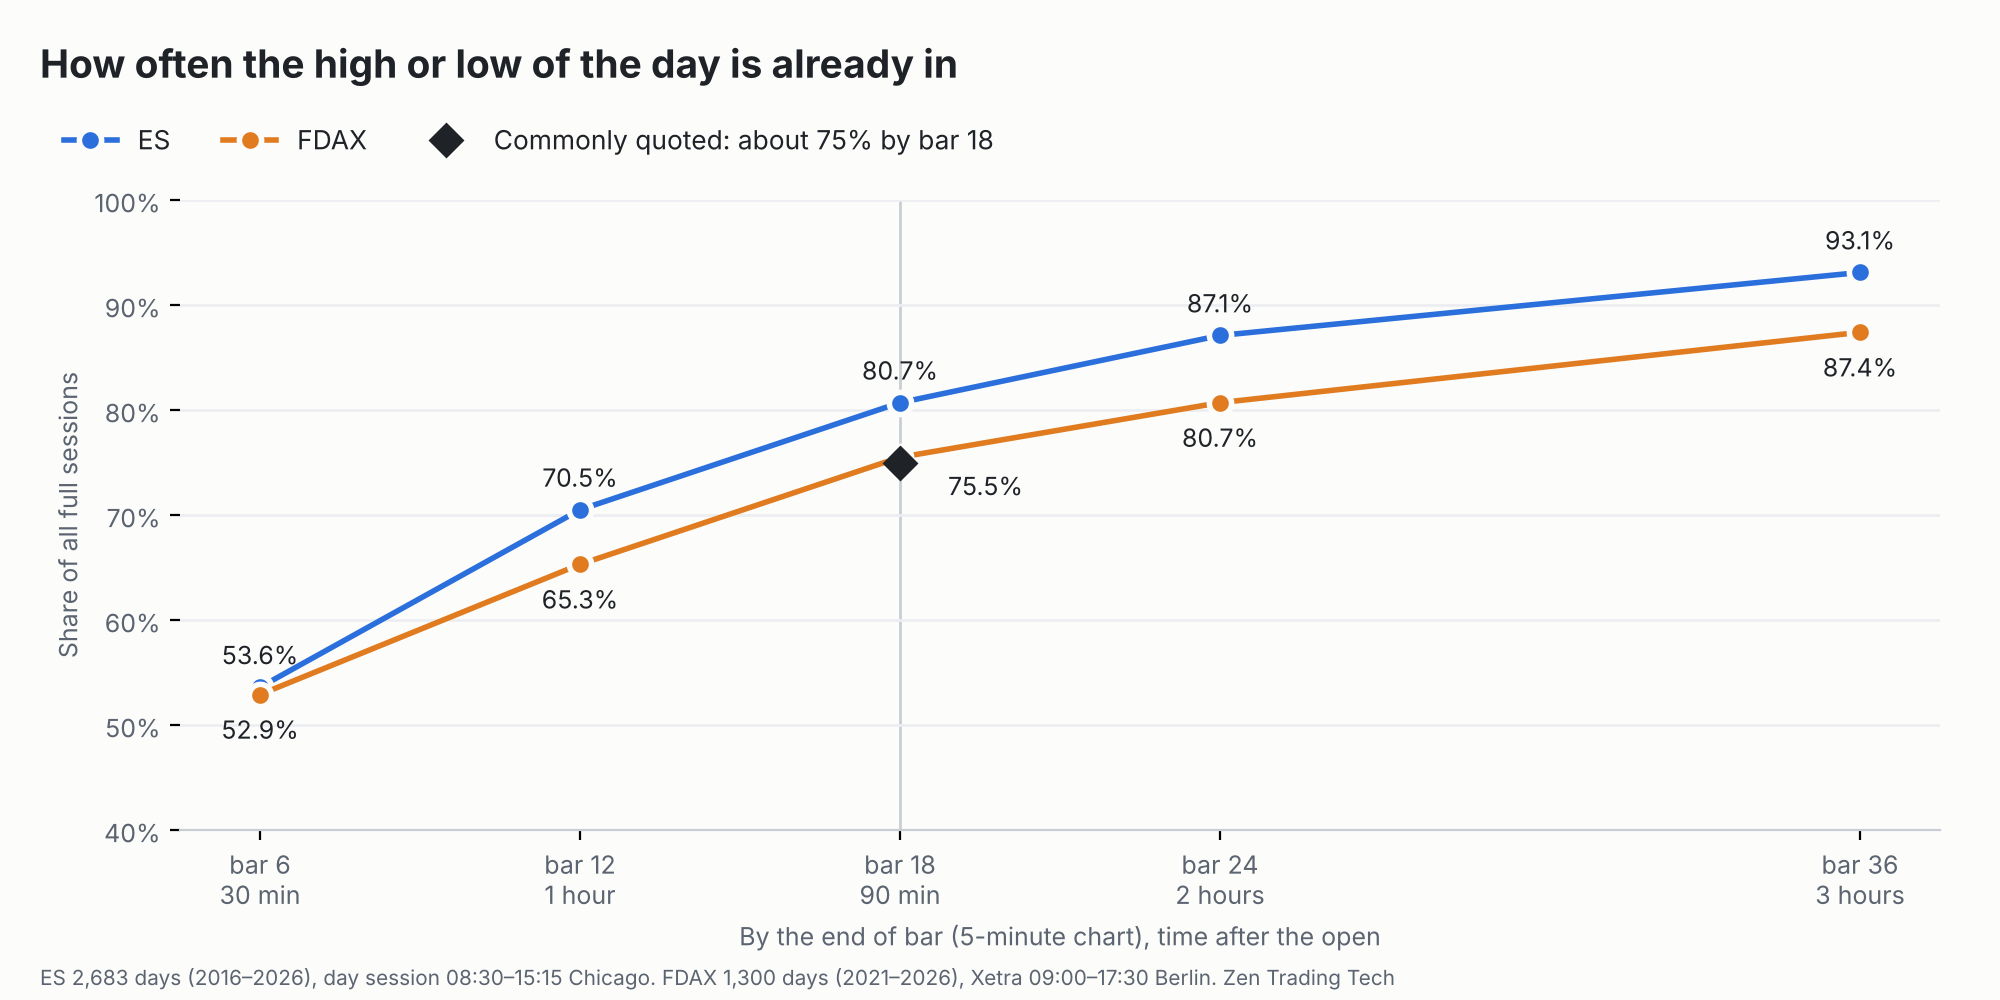
| Bar 6 (30 minutes) | 53.6% | 52.9% |
| Bar 12 (1 hour) | 70.5% | 65.3% |
| Bar 18 (90 minutes) | 80.7% | 75.5% |
| Bar 24 (2 hours) | 87.1% | 80.7% |
| Bar 36 (3 hours) | 93.1% | 87.4% |
Simply: by the end of bar 18, the high or the low of the day is in on 80.7% of ES days and 75.5% of FDAX days.
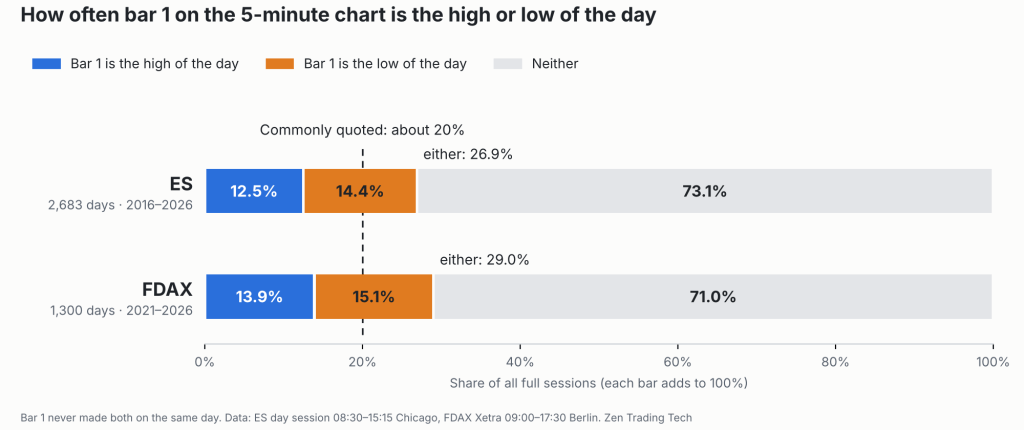
Bar 1 alone is one end of the day on about 27% of ES days (that was Research Kit #5). By bar 18 it’s about 4 days in 5.
Which end comes first? The low, a little more often. By the end of bar 18, the low of the day is in on 47.4% of ES days. The high is in on 38.5%. FDAX leans the same way: 41.1% against 36.9%.
Two examples
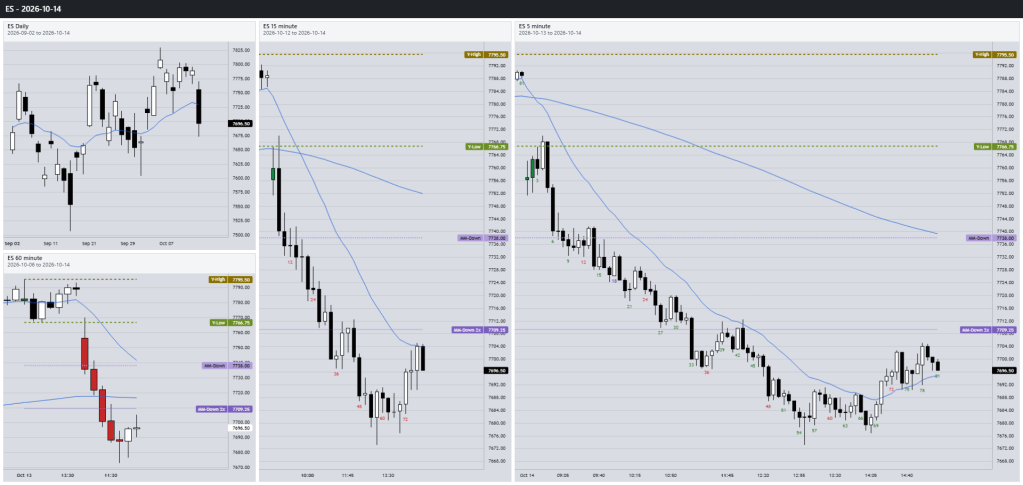
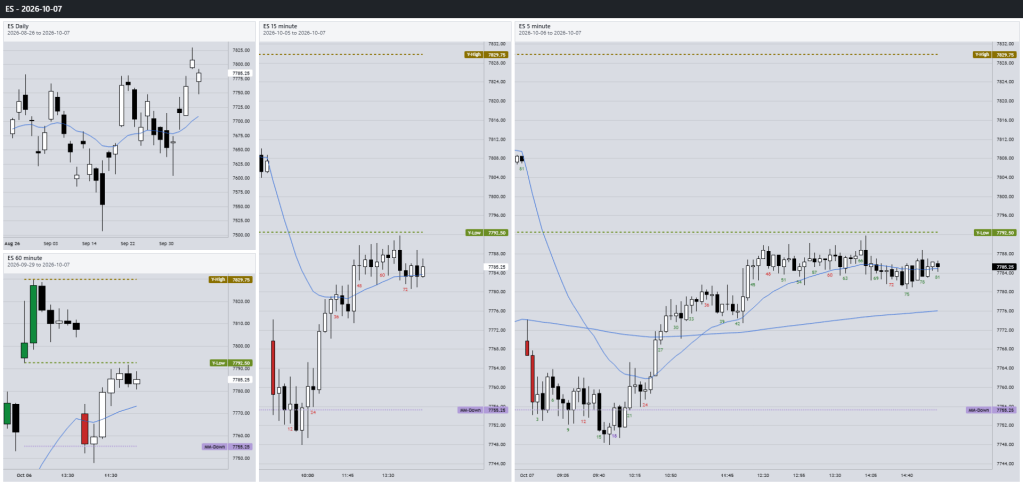
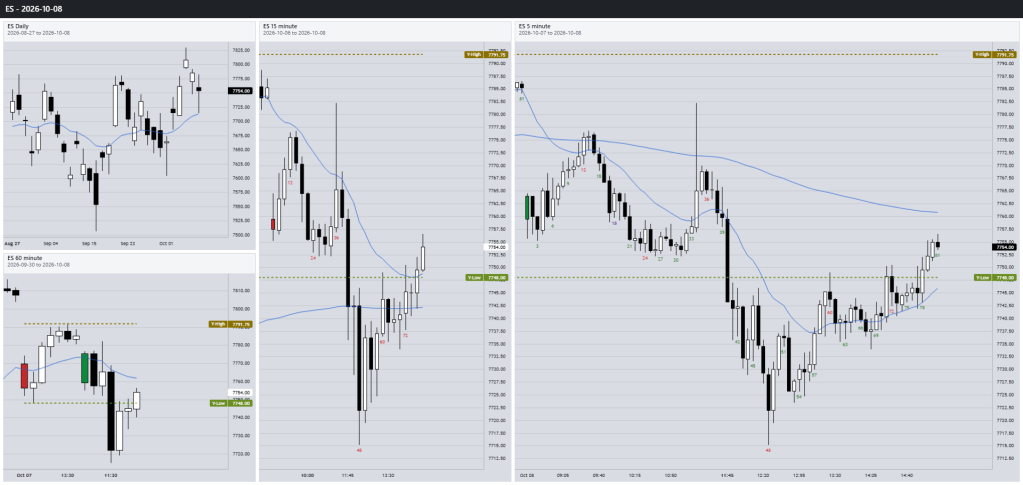
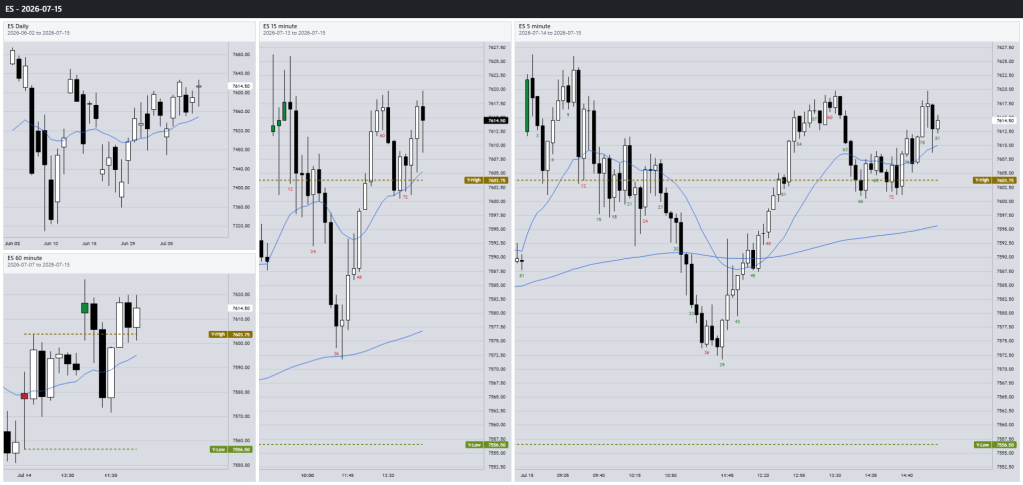
Rare days have HOD or LOD in the middle
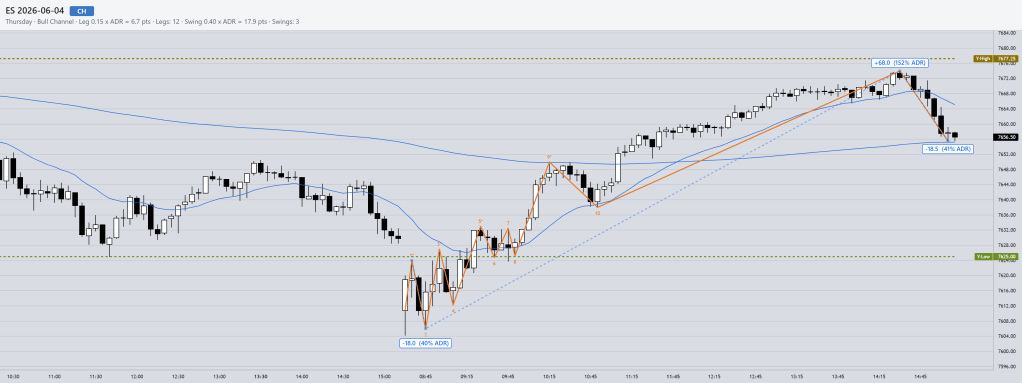
High of day in the middle of the day
Low of the day in the middle of the day
What this number is, and what it isn’t
It’s a base rate. How often something happens on an ordinary day, with no setup and no filter.
It doesn’t tell you which days. And a probability on its own isn’t a trade. You still need the risk and the reward to go with it. That part is yours.
Run it yourself
Everything is on my GitHub: the data, the rules, the prompt and a Python script. Free.
First 90 Minutes High or Low: Research Kit
- Download the file from the kit’s
datafolder. It holds only date, time, bar number and price. - Open a new chat in Claude, attach the file and paste the prompt from the kit.
- Check your result against mine. On the ES file you should get 80.7% of 2,683 days.
Or run it on whatever you trade. The kit explains how to export your own data from TradingView.
Check my numbers. Data beats opinion.
If you want the first 18 bars marked on your chart, I have a free indicator for that: 18-Bar Range.
Next in the series: Research Kit #7: The day session breaks the Globex high or low.
My First Trading Edges: Research Kits #5 to #8
- Research Kit #5: Bar 1 is the high or low of the day
- Research Kit #6: The high or low of the day in the first 90 minutes (this post)
- Research Kit #7: The day session breaks the Globex high or low
- Research Kit #8: Price touches the 20 EMA
Happy trading!
Tim
Zen Trading Tech



Leave a Reply