Thursday 5 November 2026 was a big day on ES. The S&P 500 cash index closed down -4.36%.
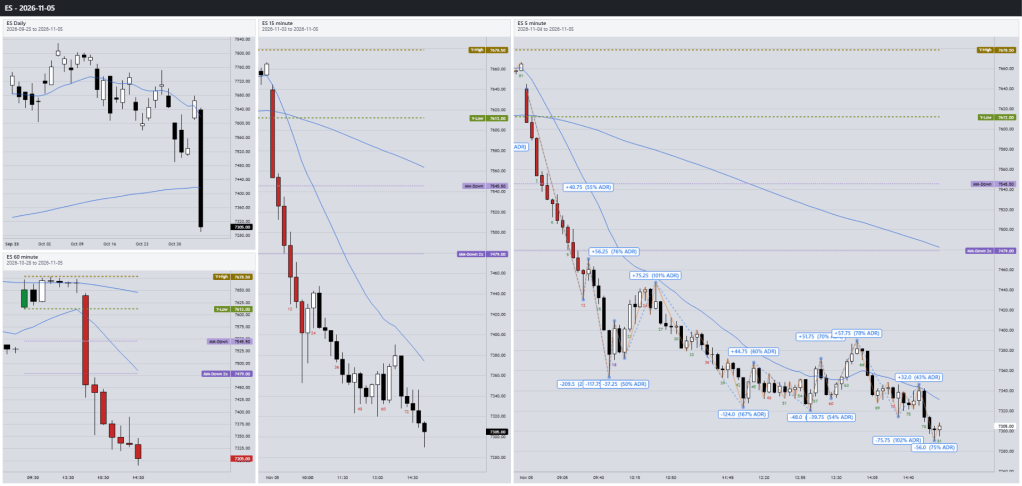
It wasn’t the biggest day I have on record. But it had the biggest opening range in my database. Here’s what stood out, and a few things you could research yourself.
My database is ES day-session data (08:30–15:15 Chicago) on 5-minute bars, from 1 December 2015 to 5 November 2026. Almost 11 years. 2,723 full days.
How I measure a day
I don’t use points. The index has more than tripled since 2015, so the same number of points means less every year. I use two rulers instead:
- % ADR — the move as a % of the average daily range of the last 8 days. 100% ADR = one average day.
- % of price — the move as a % of the S&P 500 cash close the day before. The number you see on the news.
% ADR tells you how big the day was for the market at the time. They don’t always agree — and that’s part of what made this day interesting.
Chart
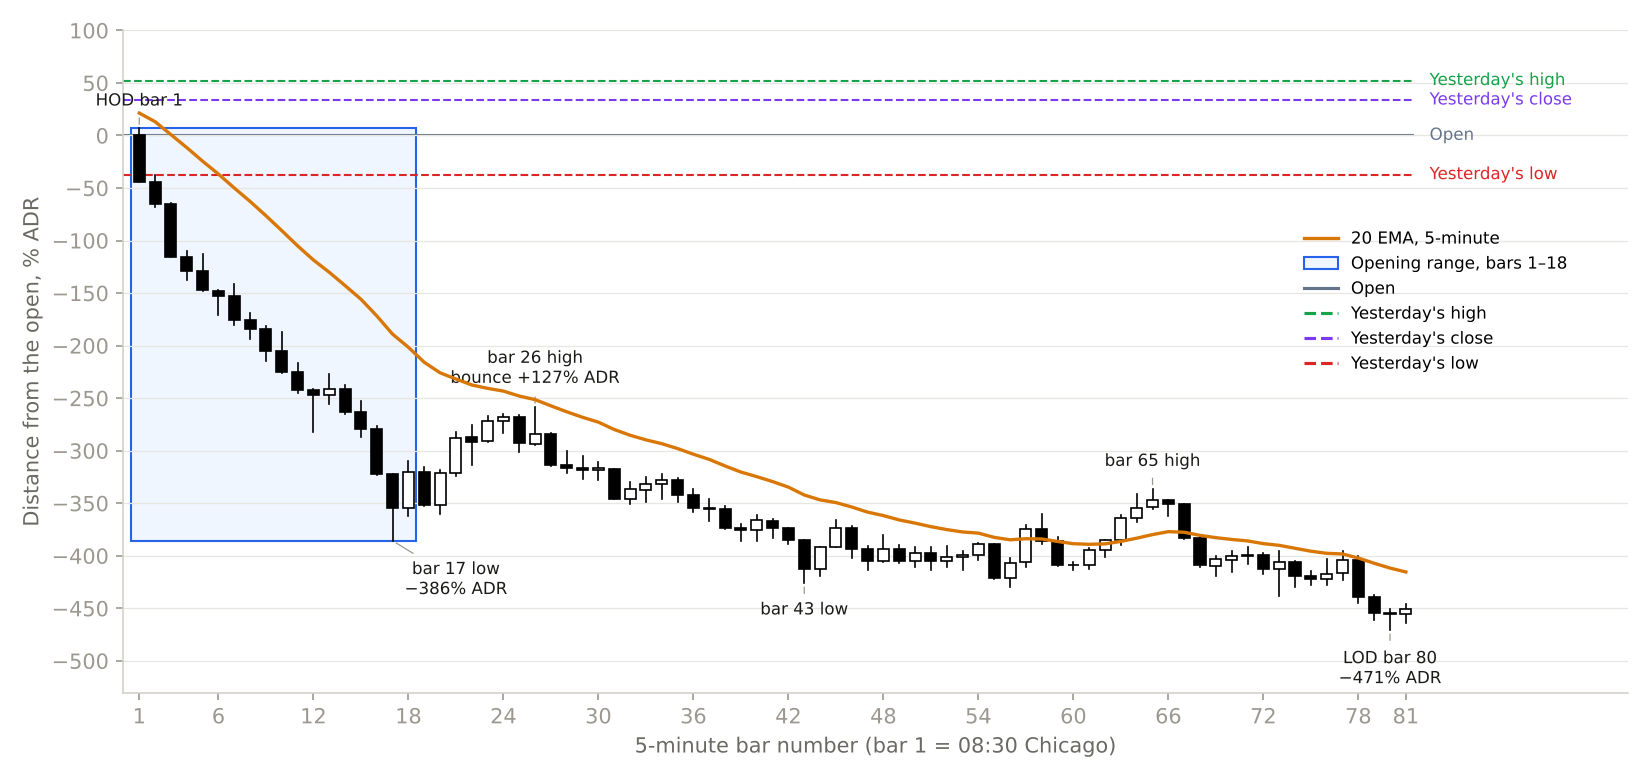
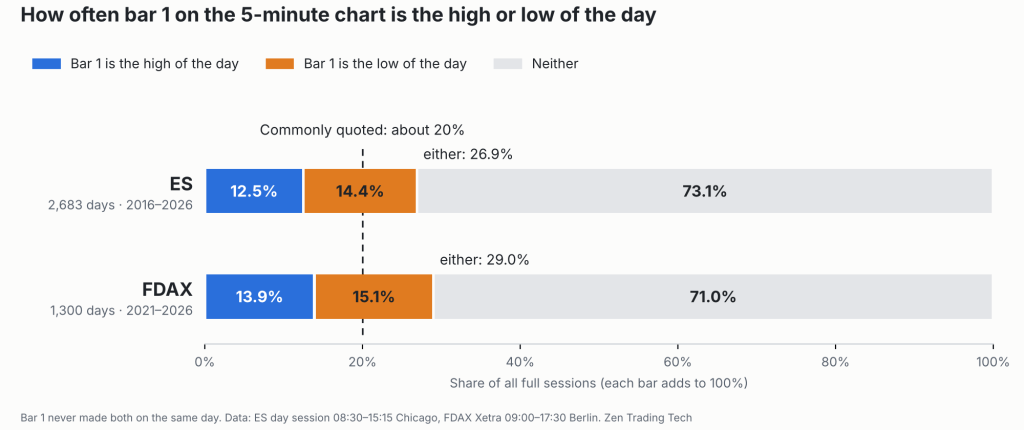
- Opened a little below the prior close. Bar 1 was the high of the day.
- First 17 bars: 16 bear bars, down 386% ADR. Nearly four average days in 85 minutes.
- Bars 18–26: a bounce of 127% ADR. Bigger than a normal whole day.
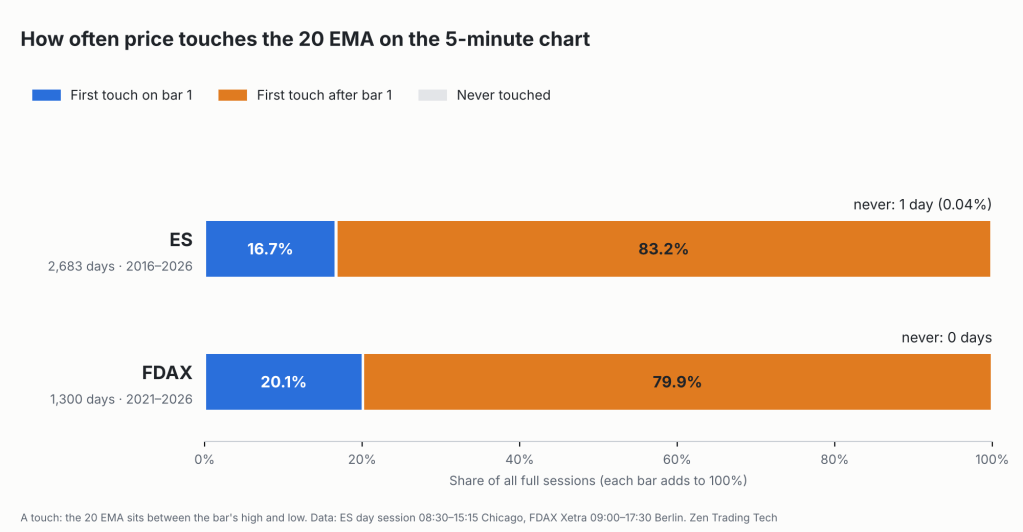
- Price didn’t touch the 20 EMA until bar 57.
- A last leg down into bar 80, the low of the day. Closed near the low.
The opening range
The opening range — the first 18 bars, 08:30 to 10:00 — was 392% ADR. A normal day’s opening range is about 55%. That’s the biggest in my database. The next biggest was 7 April 2025, at 337%.
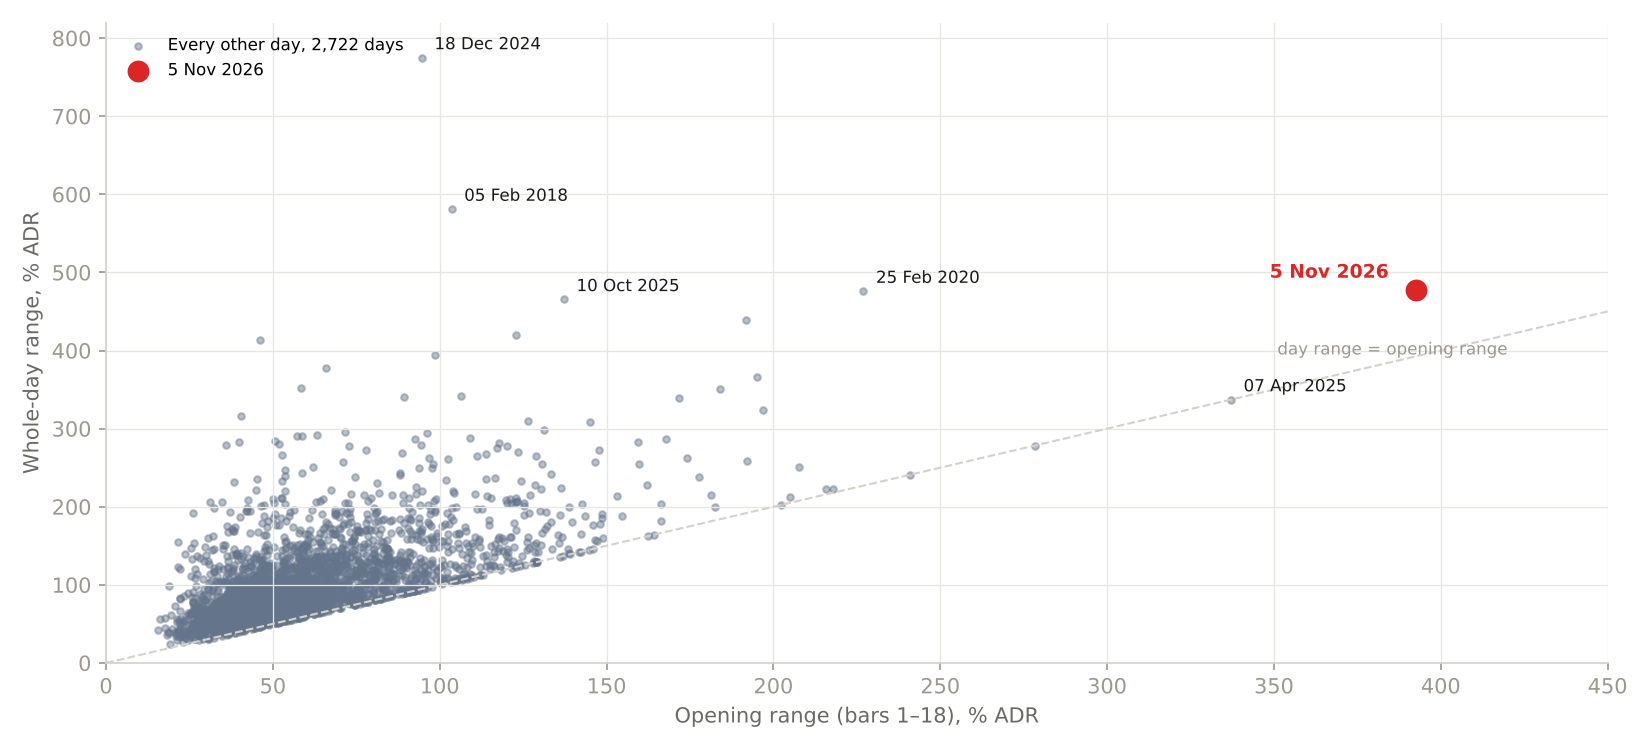
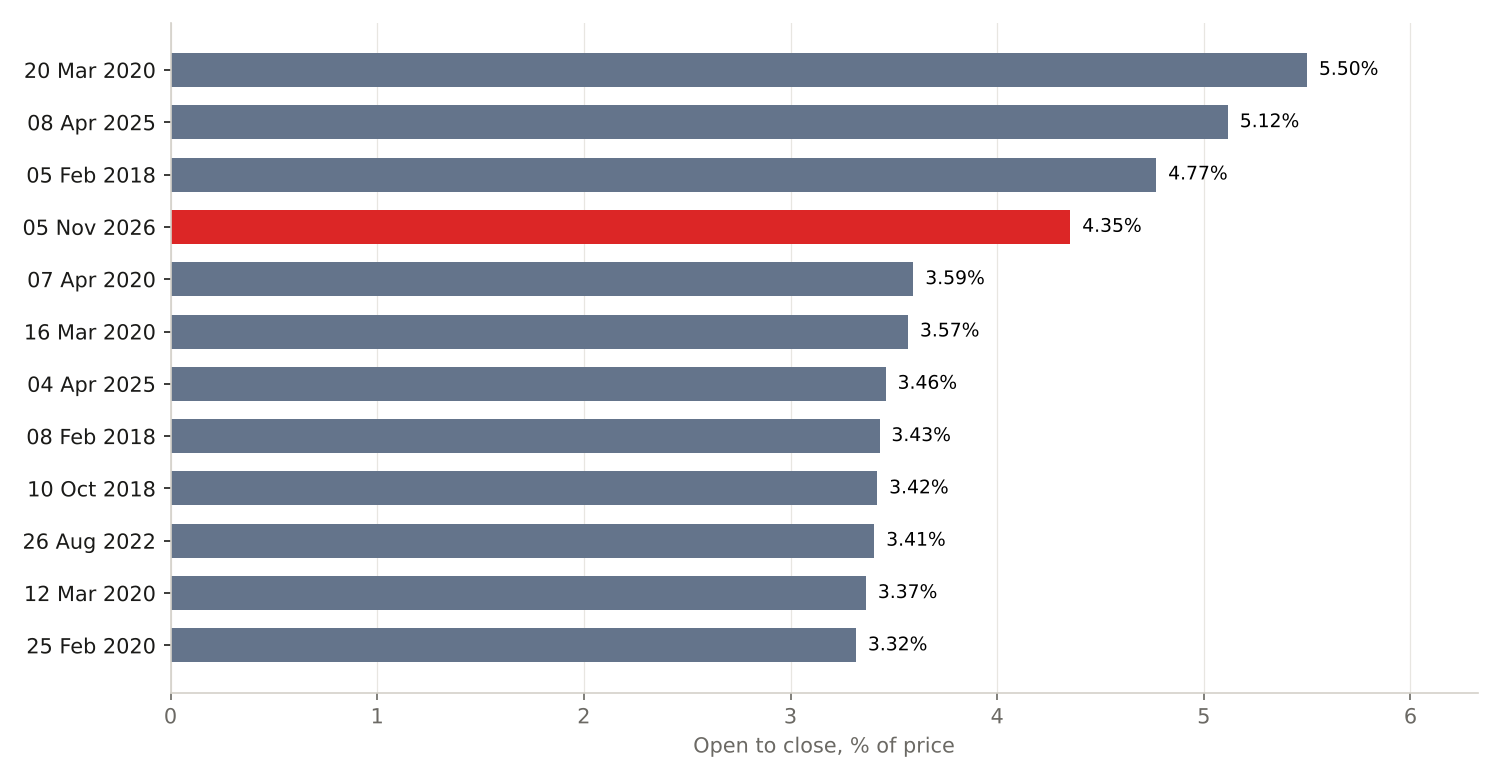
On % of price it’s 7th, not 1st. March 2020 and April 2025 pass it.
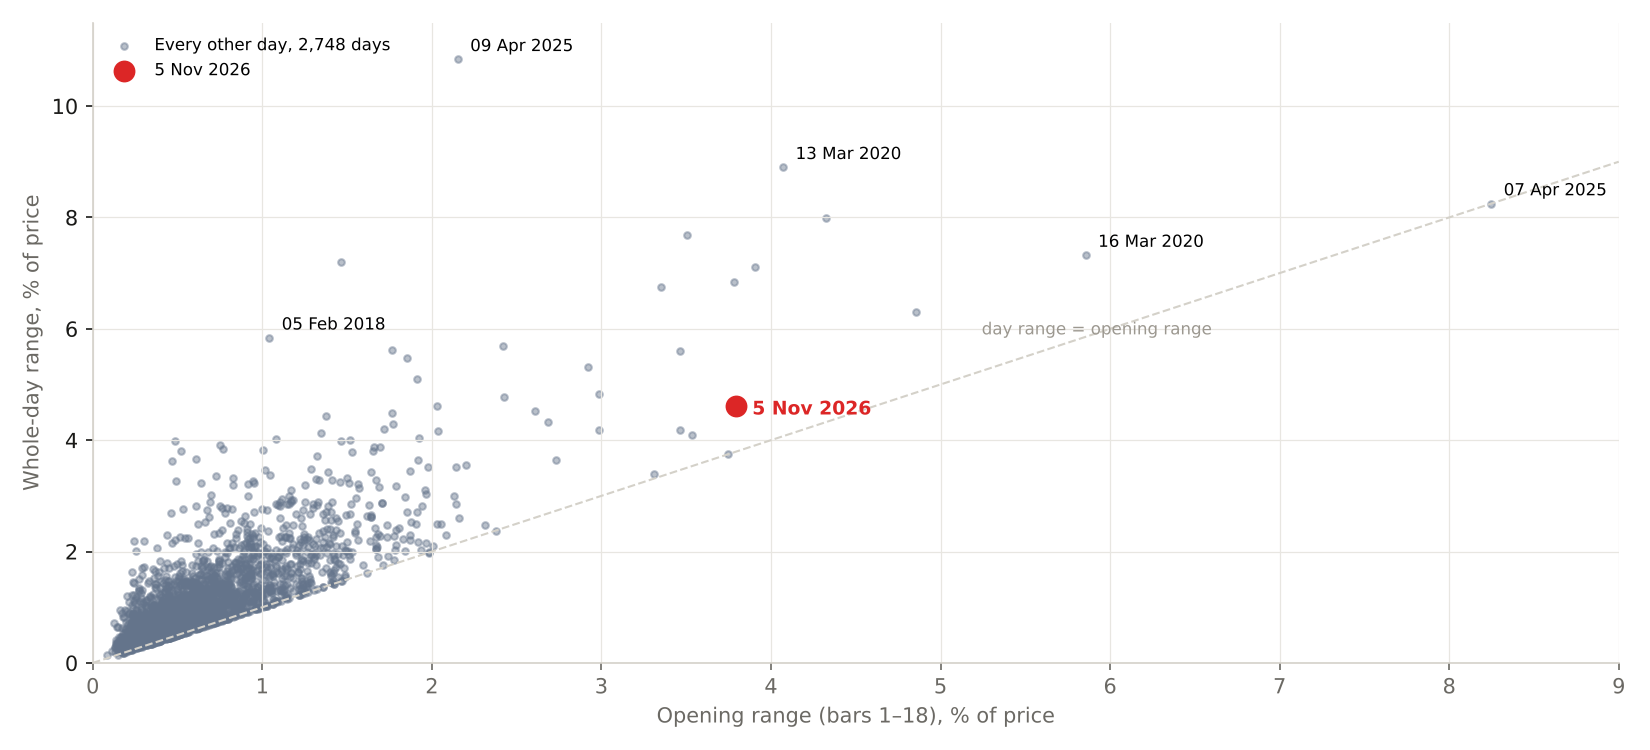
The reason: in those months the market was already moving about 5% a day, so a big open was normal for the time. Before 5 November the average day was about 1%. A big move out of quiet days ranks higher on % ADR.
When the range was made
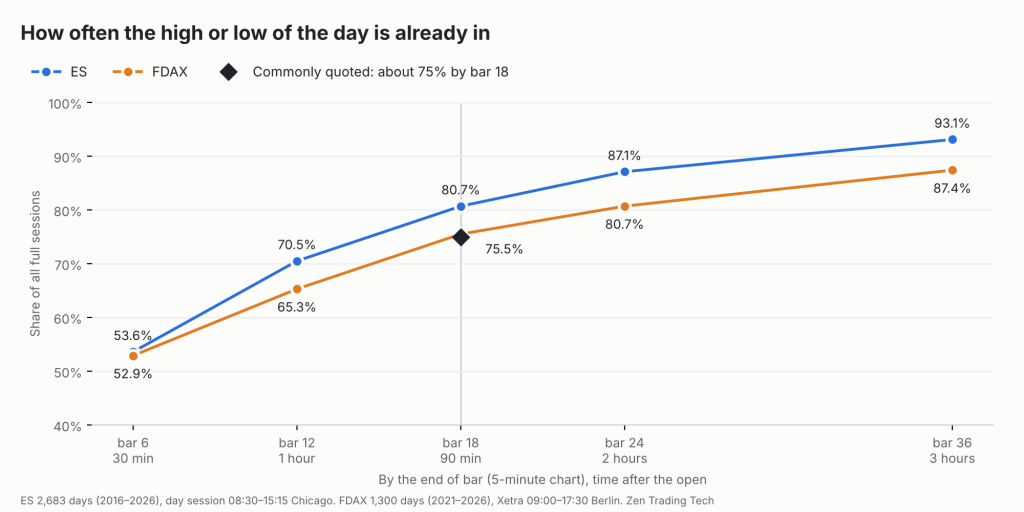
By bar 18, the day had made 82% of its whole range. A normal day has made about 62% by then.
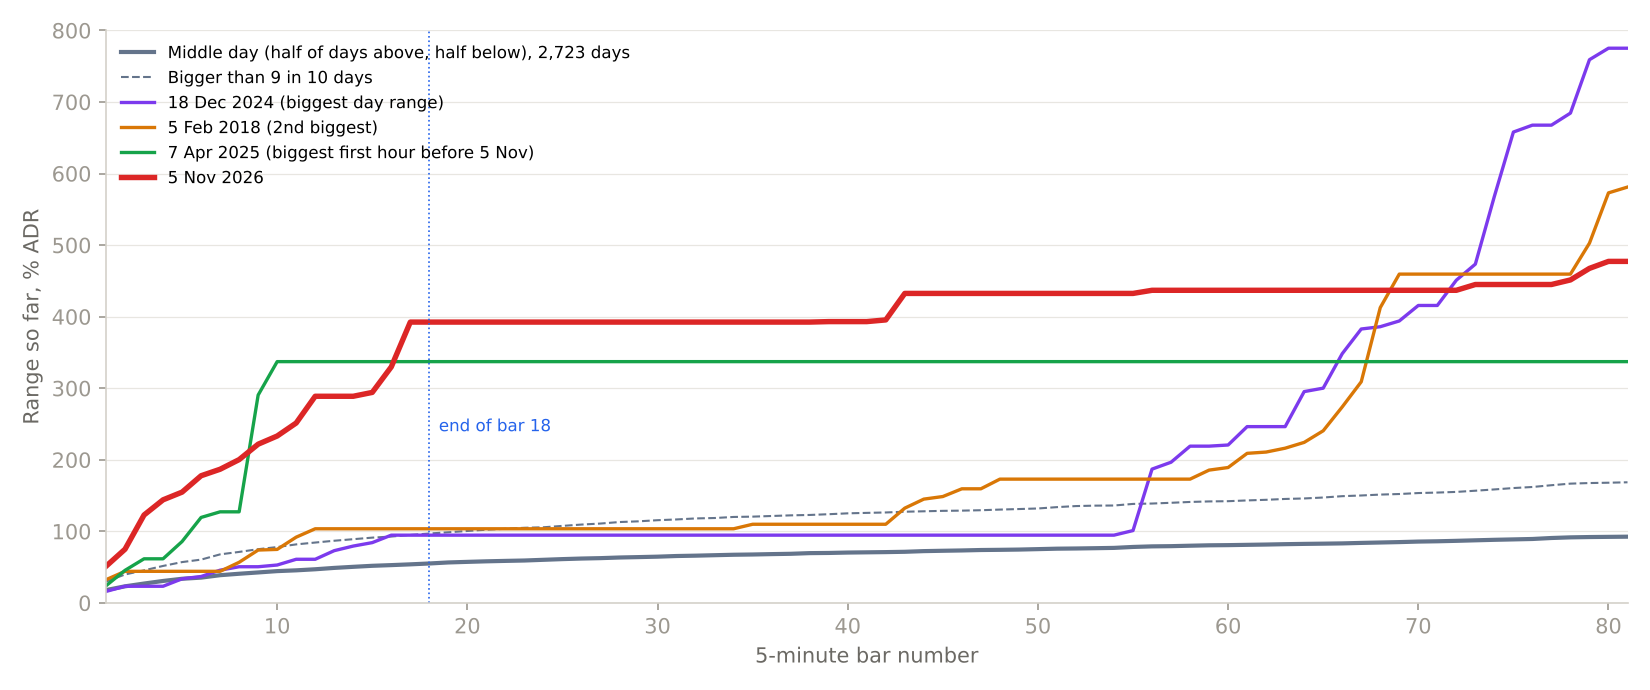
The two biggest days in my database by % ADR — 18 December 2024 and 5 February 2018 — did the opposite. They made most of their range late in the day.
Big, but not the biggest
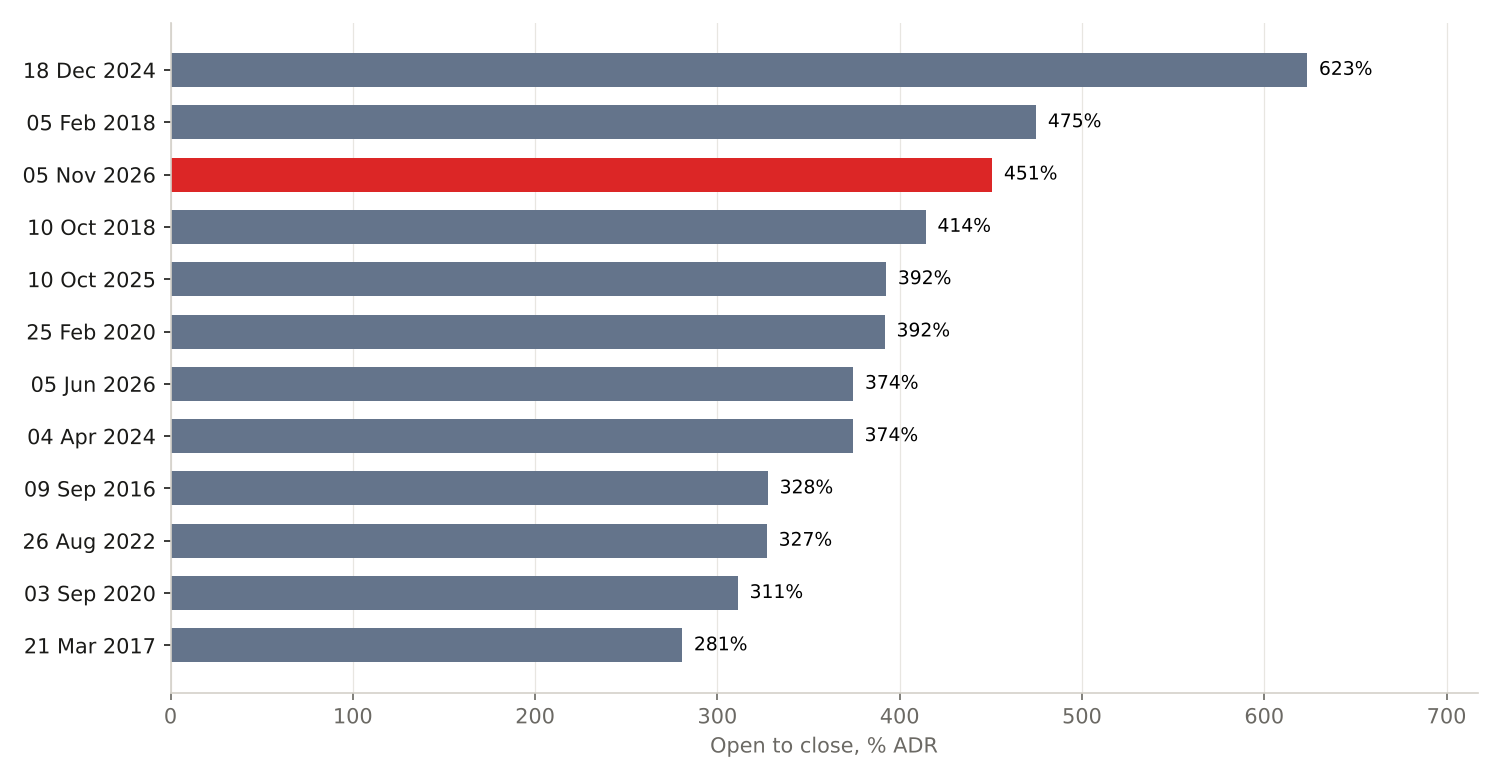
Open to close, 5 November was the 3rd biggest fall on % ADR and the 4th biggest on % of price. Here are the biggest down days and up days on both rulers.
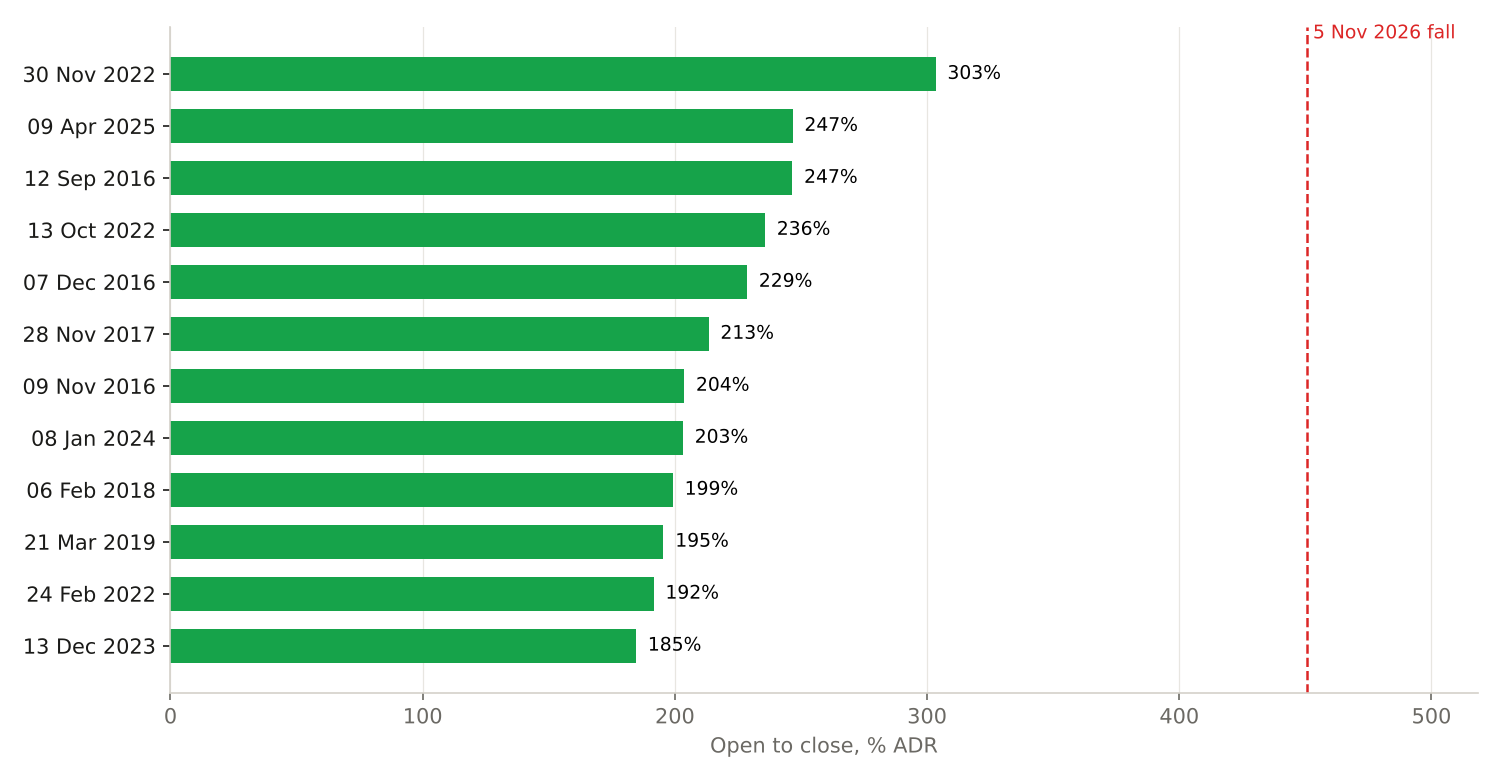
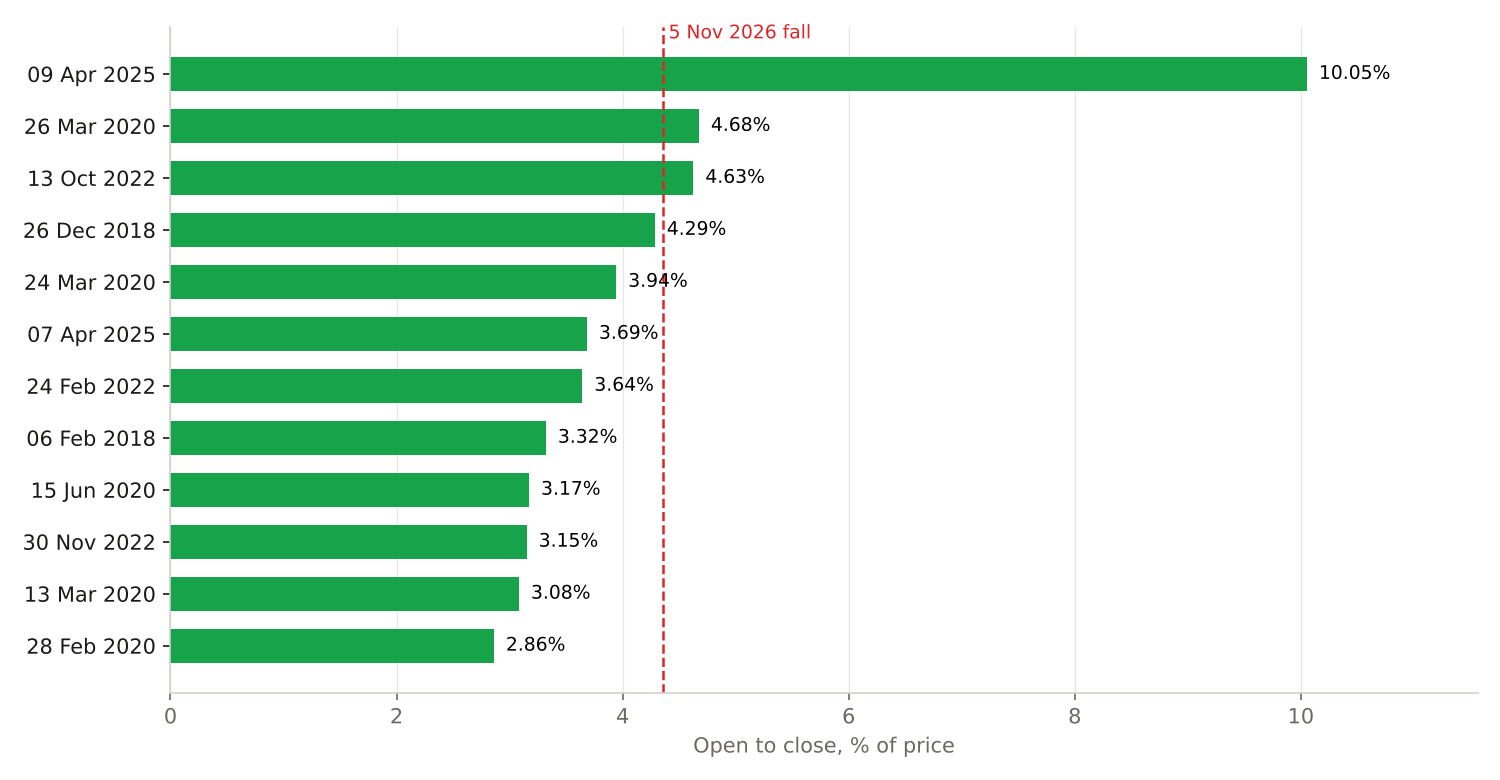
One thing I noticed: on % ADR, no up day in my database was as big as this fall. The biggest up day was 30 November 2022, at 303%. On % of price, three up days were bigger — March 2020, October 2022 and April 2025, all in fast markets.
What happened after big down days?
The obvious next question after a day like this: what happens next? I took the 20 biggest down days before 5 November and checked if ES was higher 1 day, 1 week and 1 month later.
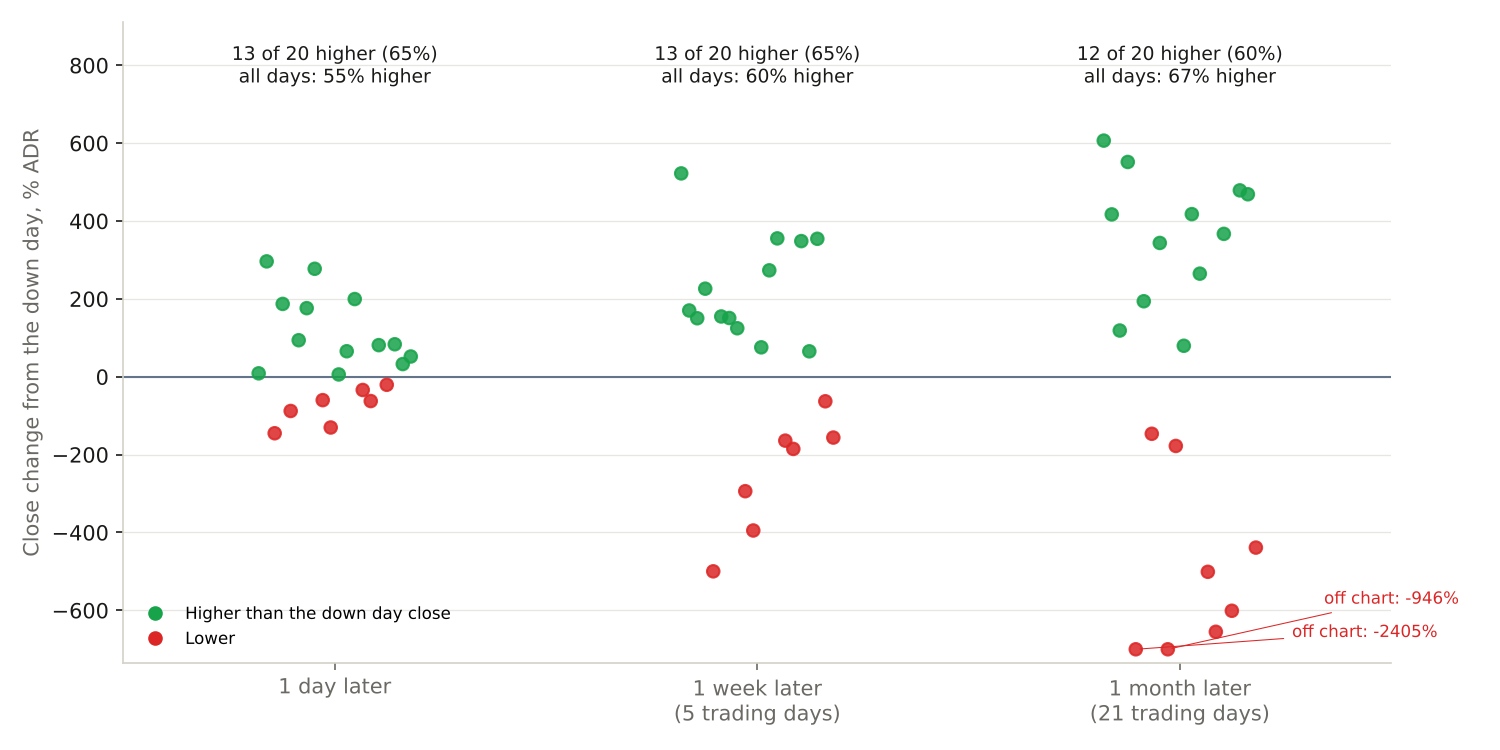
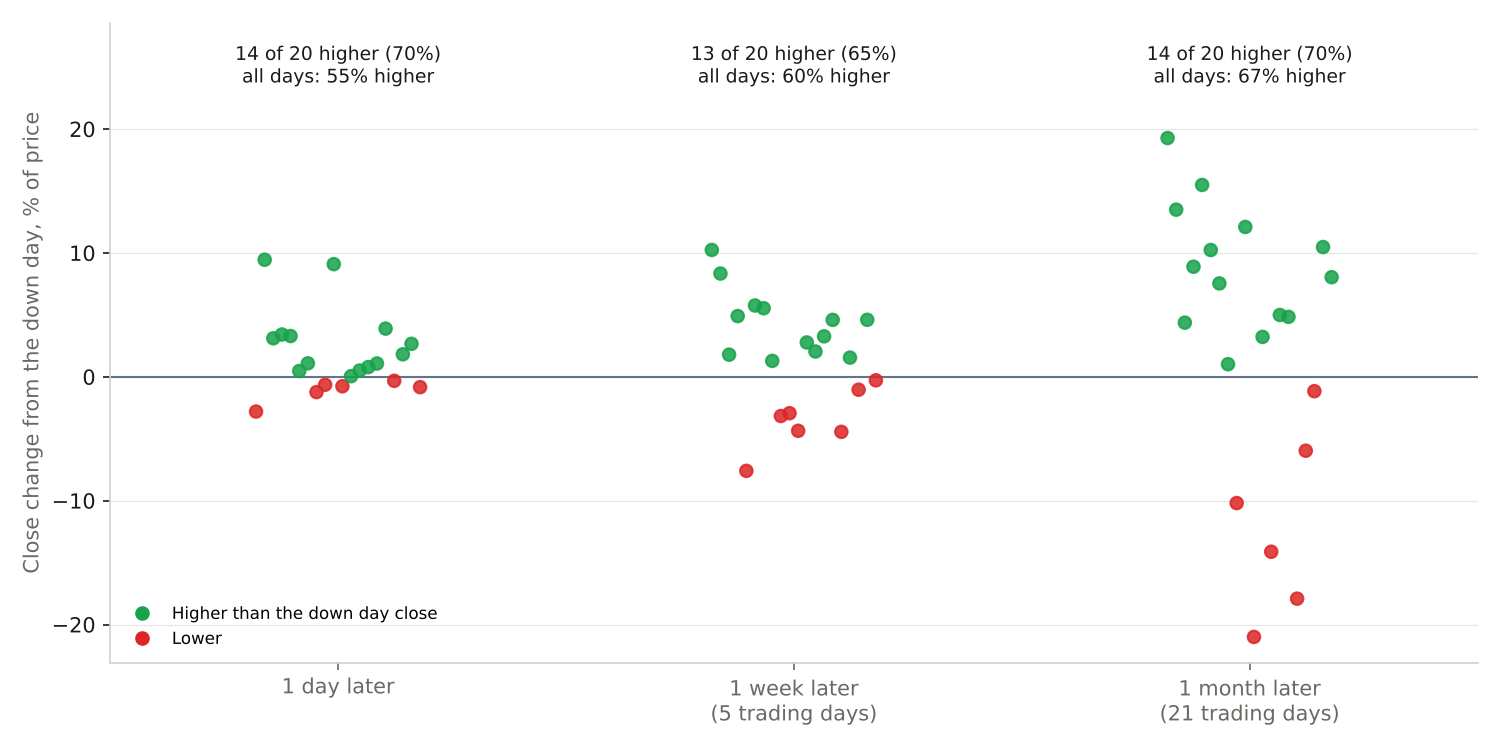
The next day closed higher about 65–70% of the time, against 55% on any day. After a week and a month, the big down days looked like any other day. Twenty days isn’t many, and several sit in February–April 2020.
The ones that kept falling fell a long way. A month after 25 February 2020, ES was another 21% lower.
Measured moves
Using yesterday’s range as the ruler, price fell 4.84 times yesterday’s range below yesterday’s low.
It hit 1x by bar 4, 2x by bar 10, 3x by bar 16 and 4x by bar 43.
Only 4 days in my database went further.
ES Days with 5 Consecutive Bear Bars on the Open
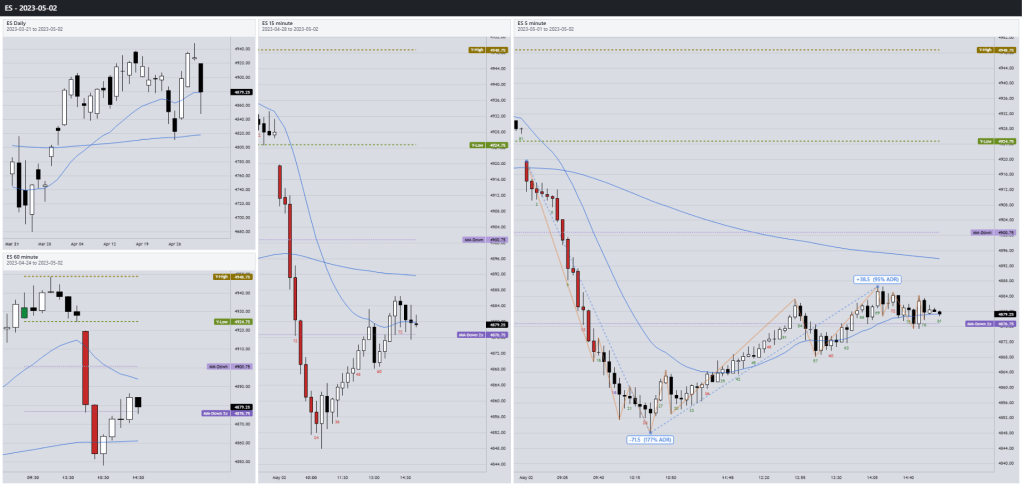
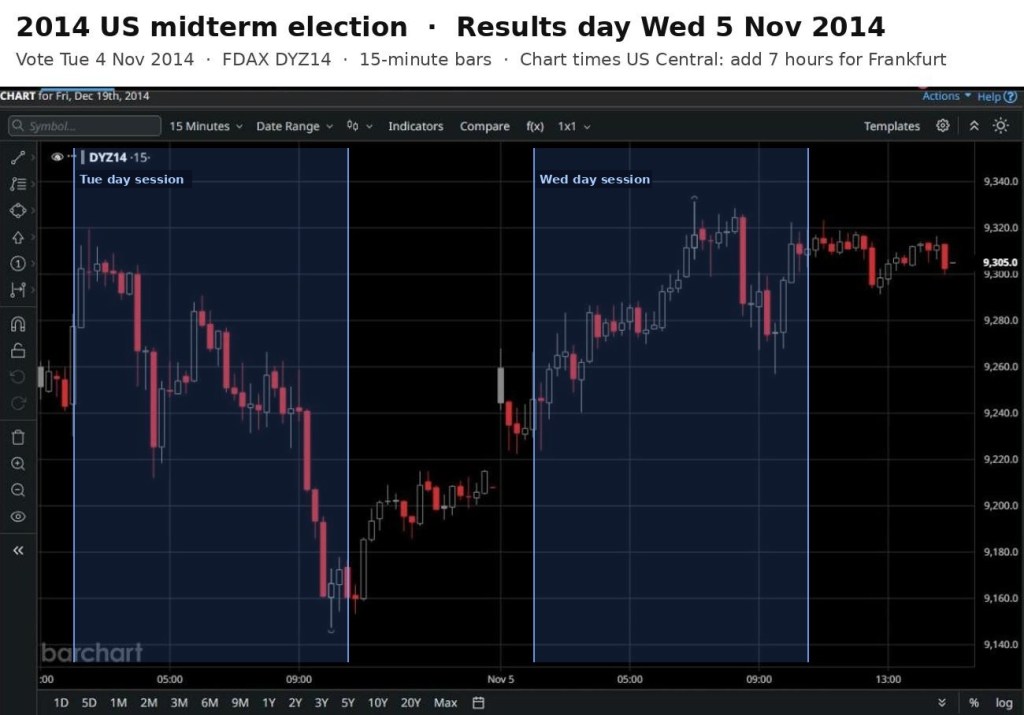
While I was trading 5 November, I pulled up past days from my database where ES opened with 5 15-min bear bars in a row. Bear spike days. Seeing how they played out helps on a day like this. Here are a few.
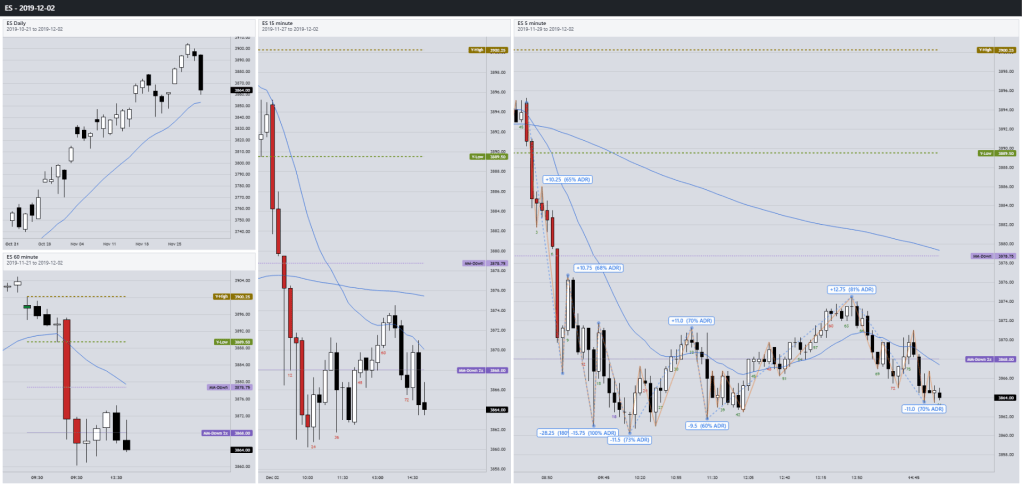
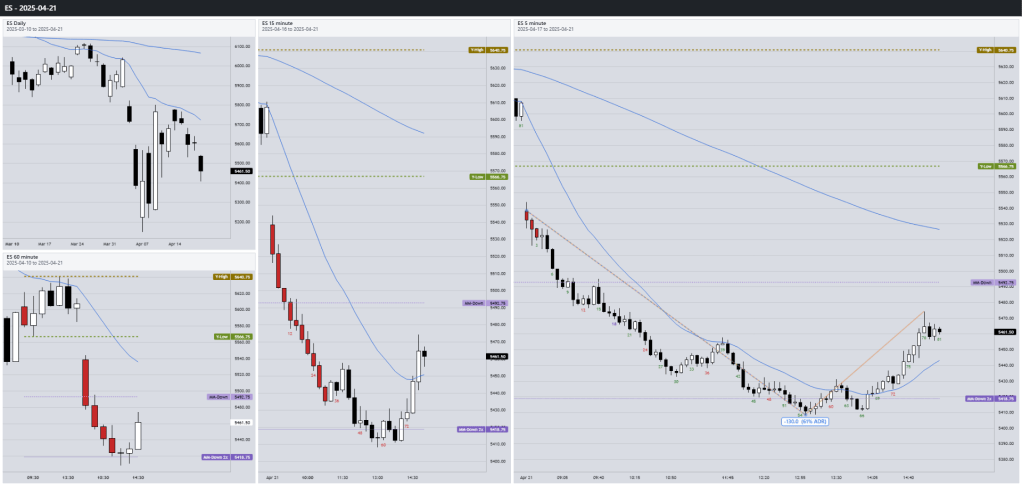
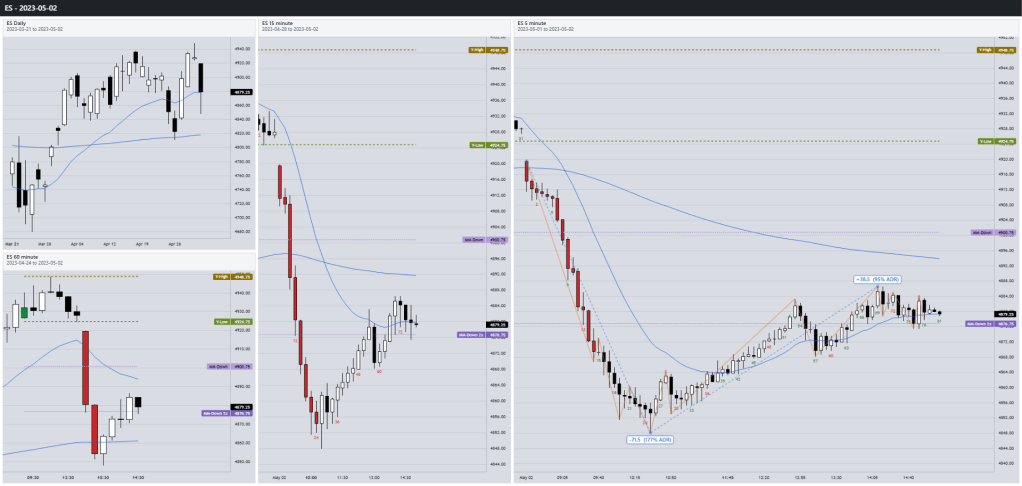
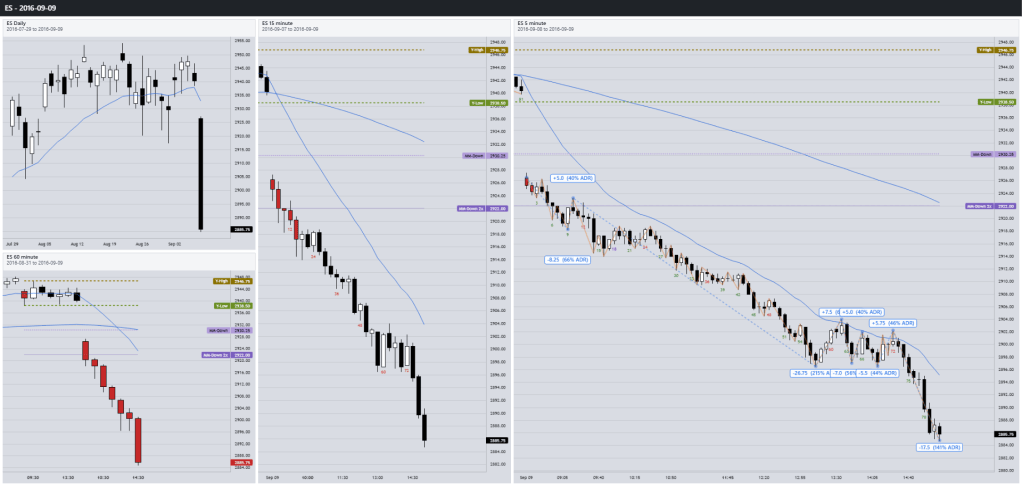
How common is it? Taking the strictest version — the first five 5-minute bars all bear bars — it happened on 66 of 2,723 days (2.4%). 80% of those days closed below the open, against 45% of all days. Part of that is built in, because those days start 25 minutes down. But it’s a good place to start.
Things you could research
- Pull up days that opened with 5 bear bars in a row. How many became big trend days, and how many reversed?
- After a huge opening range, how much further does the day go? On 5 November, not much.
- Does a big day out of quiet days behave differently from a big day in a fast market?
- What does the next day do after the biggest opening ranges?
If you look into any of these, let me know what you find.
Happy trading!
Tim
Zen Trading Tech



Leave a Reply