
Premise
This review focuses on the follow-through bar (FT) and market trends. It identifies if the market is in a trend or trading range.
Traders make decisions based on context and the signal bar. Context or the trend matters more than the signal bar for reversals, not trends.
A strong signal bar (SSB) draws in stop order traders (STP) and trend traders for breakouts.
A weak signal bar (WSB) only attracts limit order traders (LMT) to bet against breakouts.
When traders focus more on the context, they are trading differently.
Let’s see how things turn out.
Charts
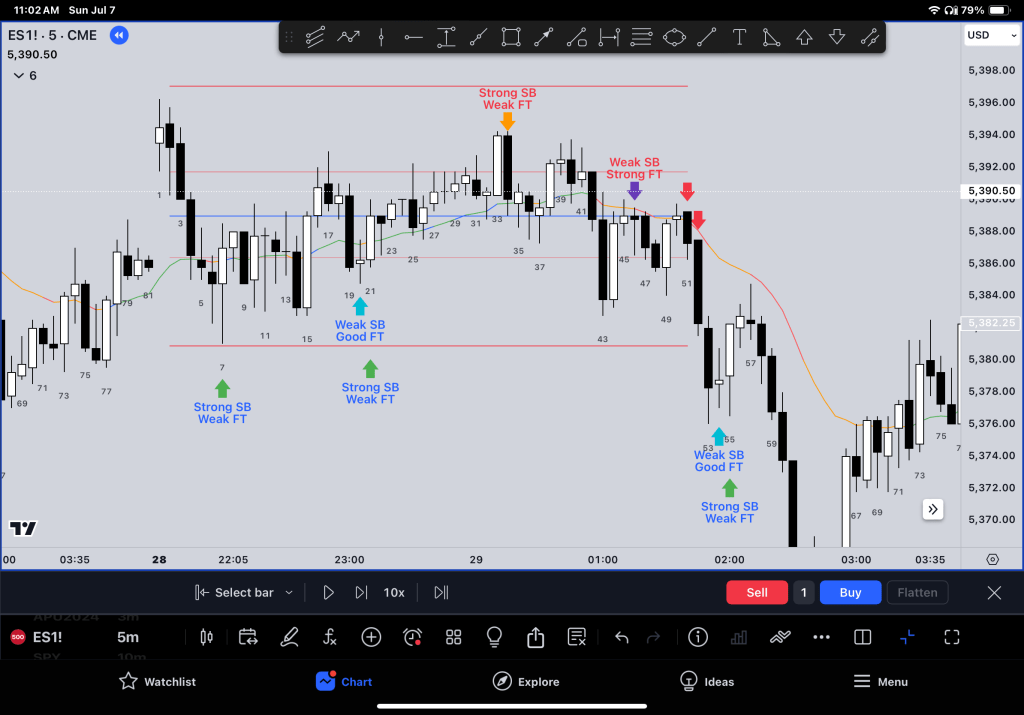
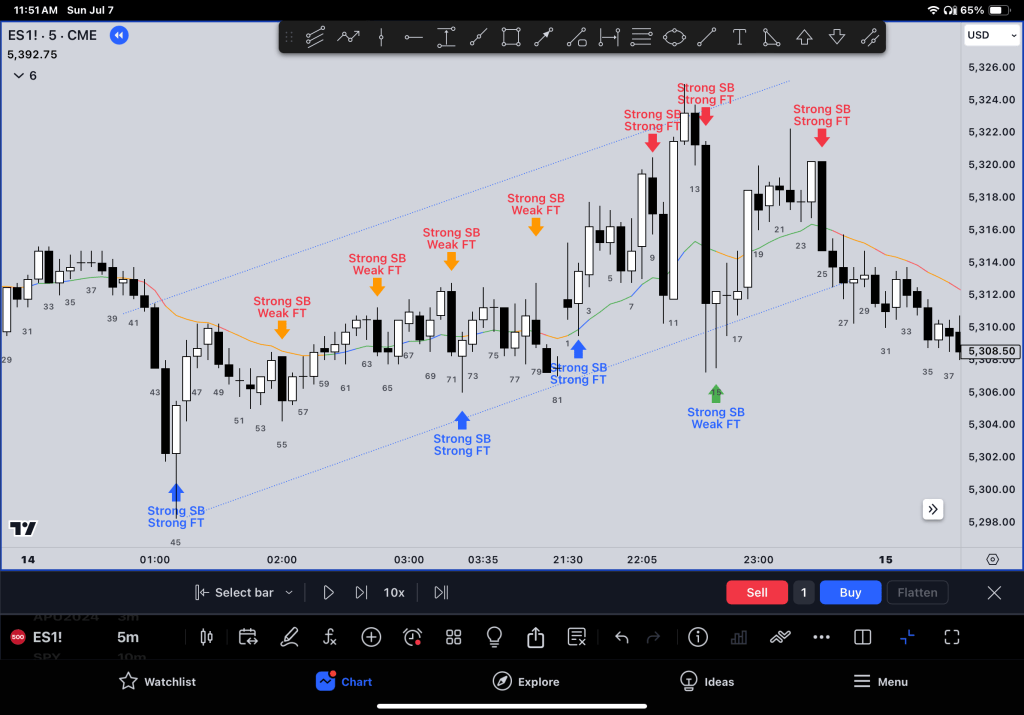
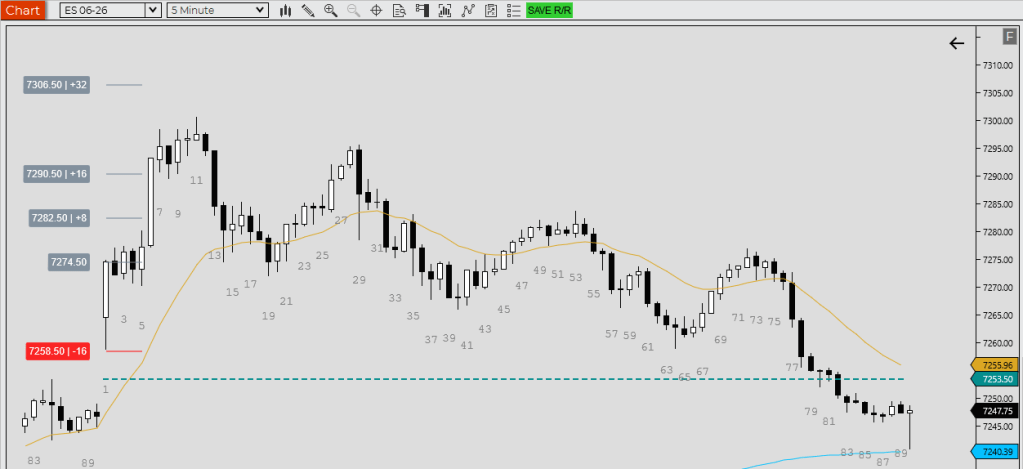
– In the chart, a second leg trader would have gone bananas trying to enter with STP.
– The best way was using midpoints and LMT fading the pullbacks.
– But you don’t know until when? End of first hour quite clear when B14 fails strongly.
– Prior to the trading range above, BL and BR got good FT.
– When the pullback was surprisingly strong – profit-taking was likely after 6 BL MC – BL trend resumption struggled from the B29 H2 onwards.
– We can see H1 and L1 failing at the top and bottom thirds – KPI of a TR!
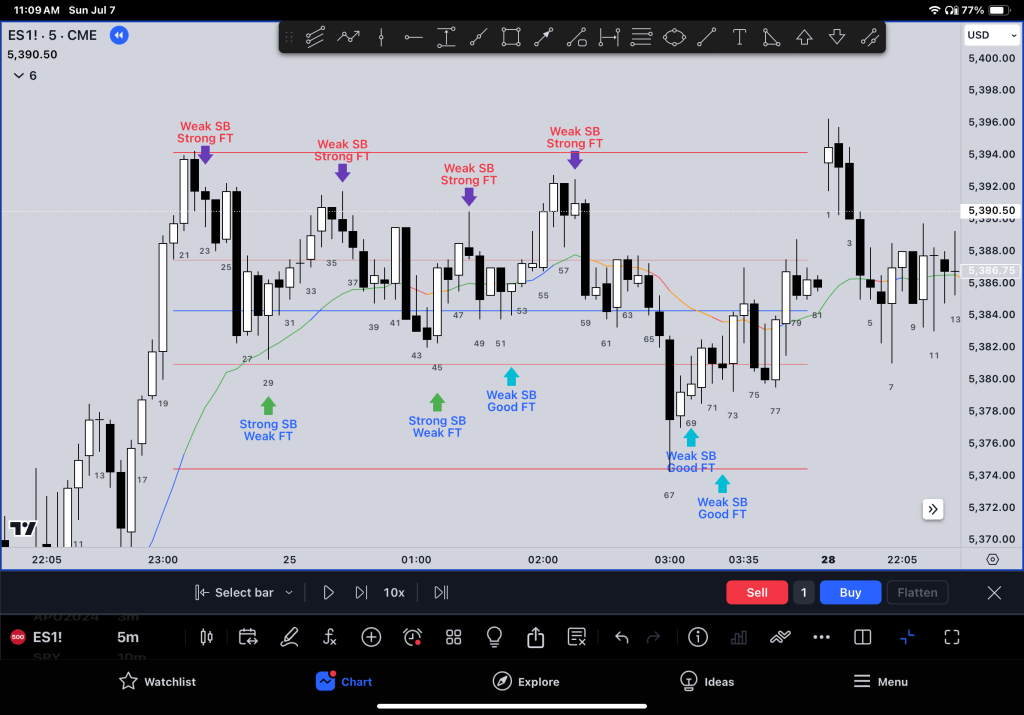
– Context was good for higher prices, but the FT said unlikely for a new H
– B22 – B29, even though it was difficult to trade did a lot of damage to the BL case
– Mean reversion, or trading back to the MA is another good technique when the FT is confusing. Apart from B18-19 the better traders were all BACK to the MA.
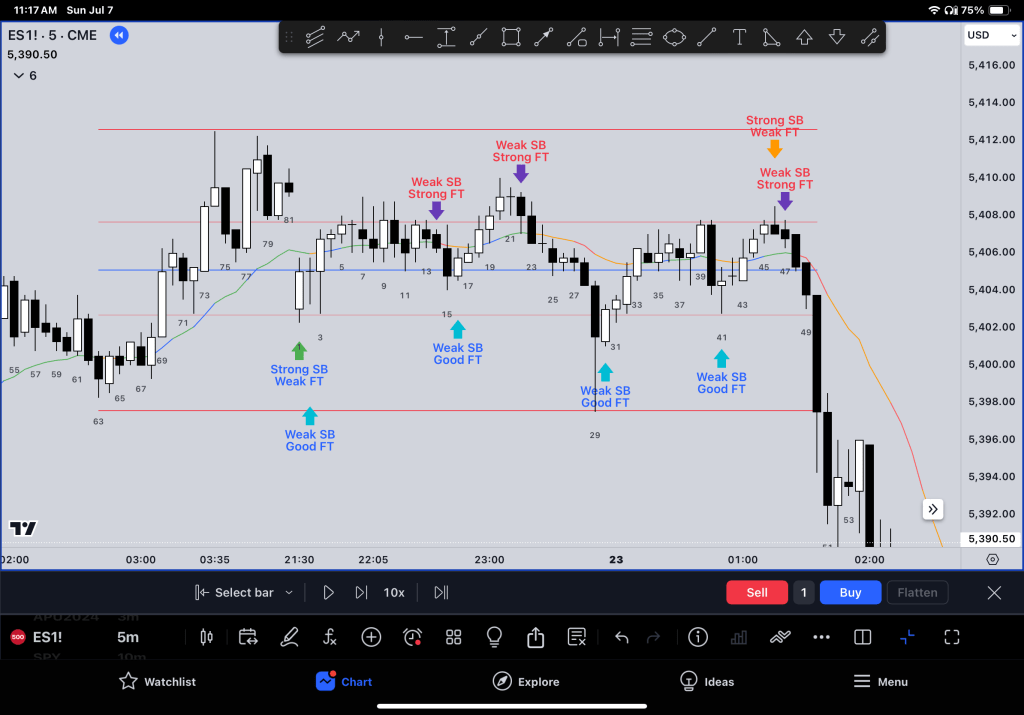
– Even the BR BO attempt forced you to take big risk and hold through bad FT.
– Using FT here helped you get and stay long in an environment where BR kept getting disappointed.
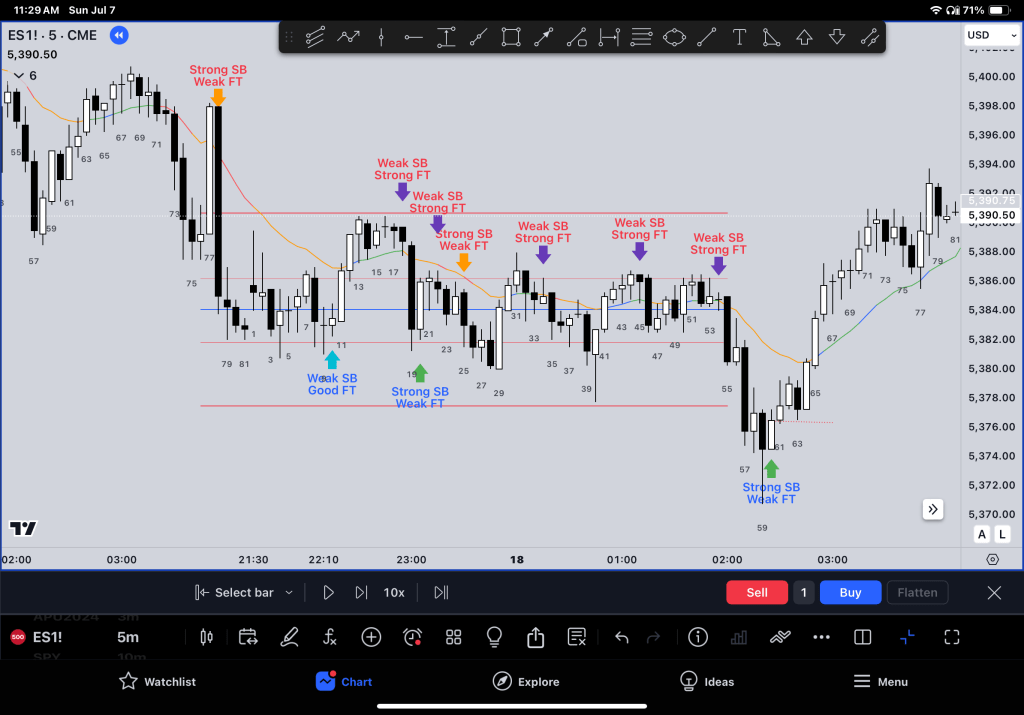
– But the moves were relatively slow until the next days open ramped the volatility up.
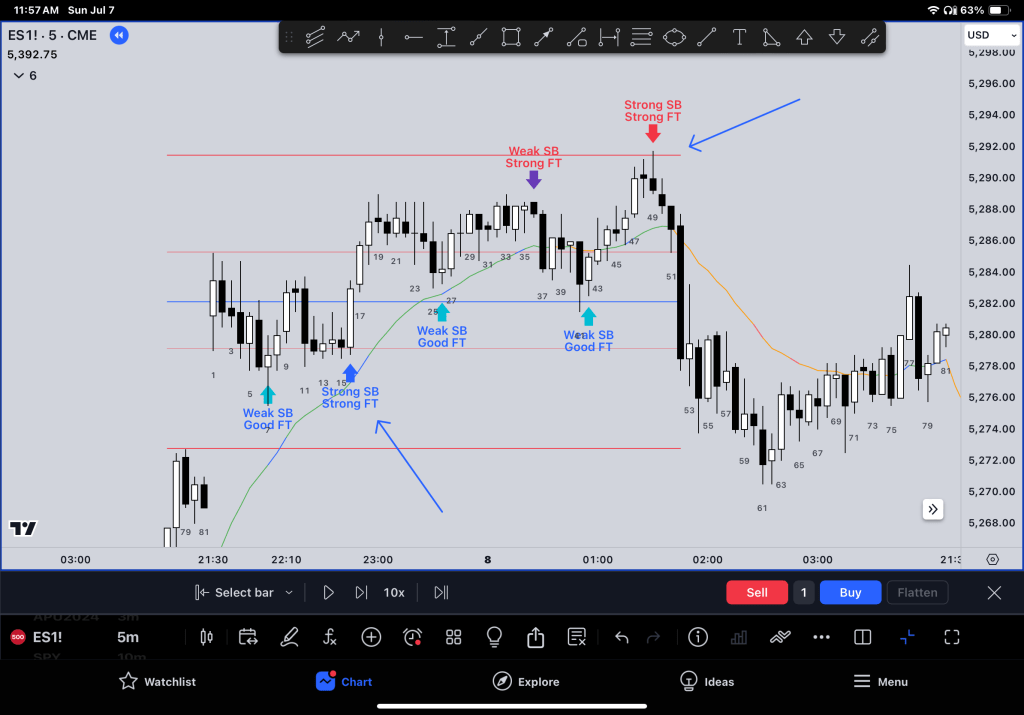
– If the rest of the market agrees this is the best trade, it will usually take off and then try and throw you off.
Closing Remarks
– I underestimated how effective FT bars are for determining context and strength!
– Hope you enjoyed the post and thanks for reading this far!


Leave a comment