Video
Intro
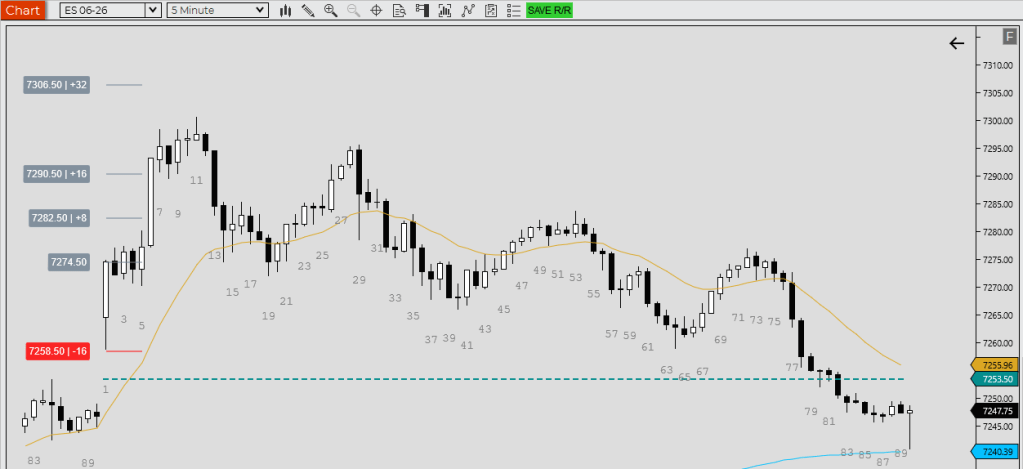
This indicator is to TRAIN the eyes to follow the direction of the strongest breakout and followthrough.
It is also a good indicator or market structure:
- when it works we are trending
- when it is failing we are in a trading range or broad channel
The Zen Breakout and Follow-through indicator is designed to identify and highlight price action relationships using simple, clear visual signals.
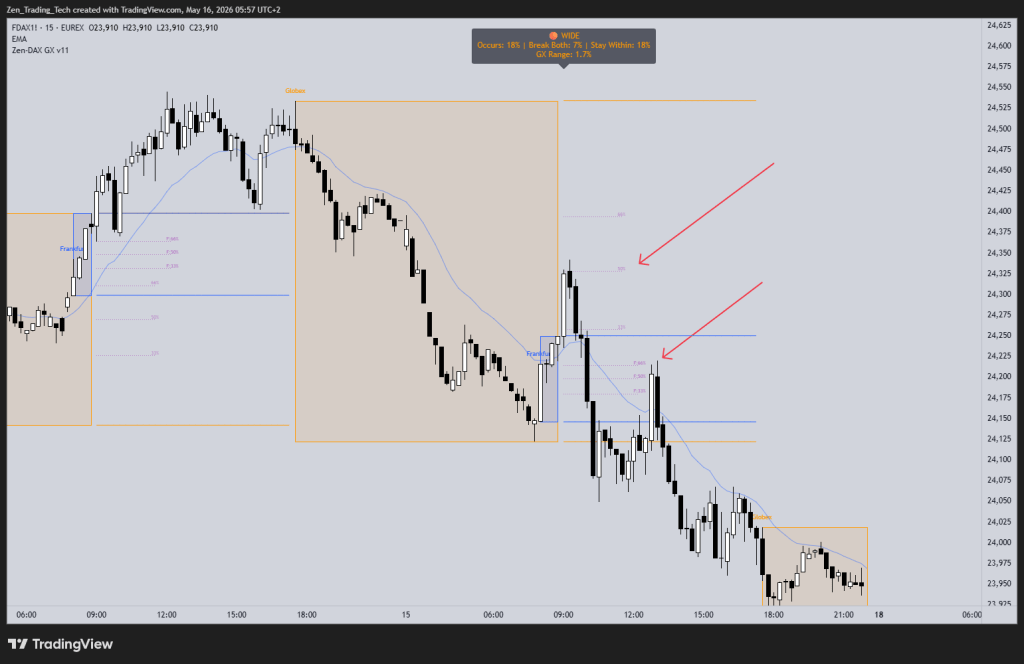
- Blue Arrows (Bullish Breakout): A blue arrow is plotted below a bull bar when it closes above the high of the previous bull bar. This indicates a potential bullish breakout or continuation, helping traders spot upward momentum early.
- Red Arrows (Bearish Breakout): A red arrow is plotted above a bear bar when it closes below the low of the previous bear bar. This highlights bearish breakouts or continuation patterns, signaling potential downward pressure.
Use this indicator to assist in identifying momentum shifts and follow-through in price action. Ideal for breakout traders looking for simple, effective signals to time their entries or exits.
Chart:

Link:
https://www.tradingview.com/script/wMX006pj-Zen-BOFT-Close-Above-High/


Leave a comment