Want to really understand a price action pattern? Don’t just memorize someone else’s notes—rebuild them yourself.
This post shows you how I do it, using “Channel Failures” as the example. Below the post I include my notes for you to kick off from.
- 📚 The Exercise
- 🎯 What Happens When It Works vs. Fails?
- 🔍 My Takeaway
- 🧠 Final Tip: This is Your Encyclopedia
- Appendix- My Draft Notes For You to Start With
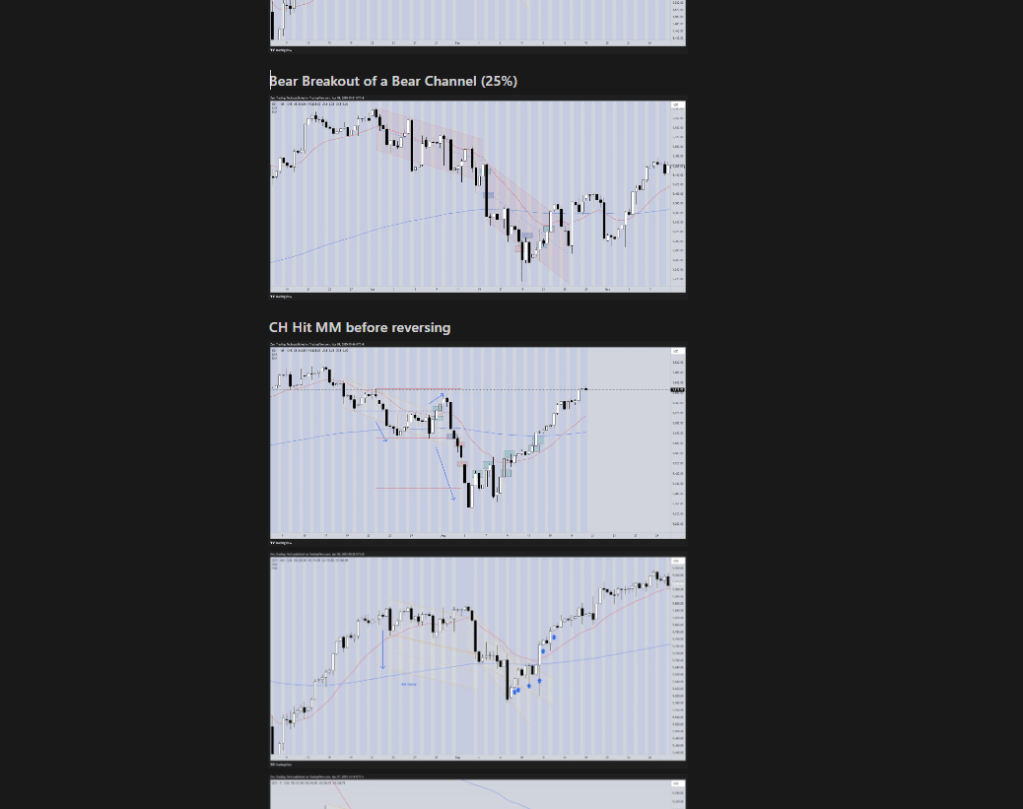
- Failed BO below BR CH – Reversals
📚 The Exercise
The goal is simple:
Take a known price action pattern and rebuild the concept from scratch.
This is how I approach it:
Step 1: Gather Reference Notes
Start with all the material you can find from Dr. Al Brooks or your own studies. In this case, I focused on:
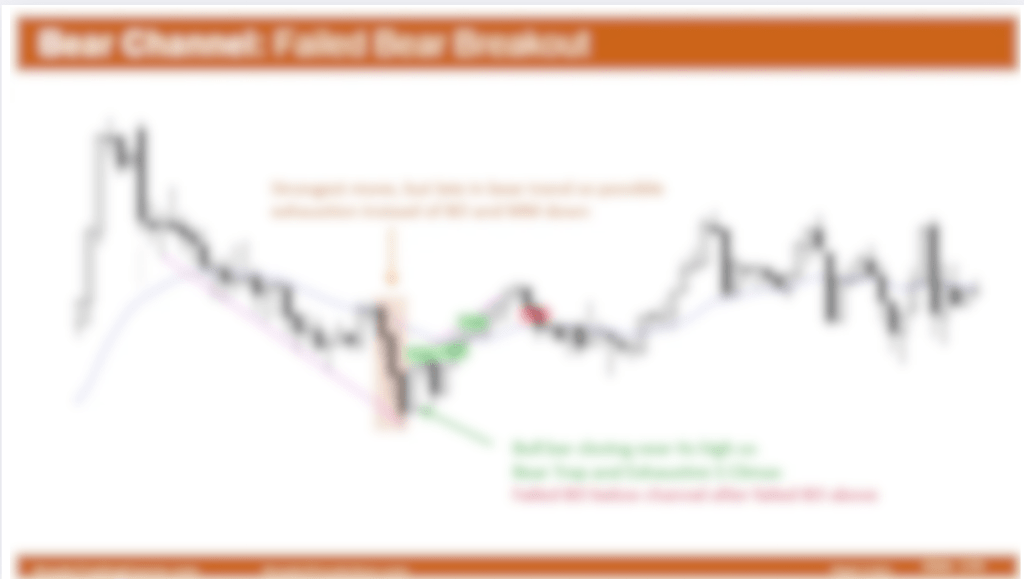
- BEAR CHANNEL – FAILED BEAR BREAKOUT
You can blur or redact any copyrighted slides if you want to share your work (like I’ve done below). But the goal isn’t to copy—it’s to recreate.
ie many of these
Step 2: Write Down Everything You Know Already
- Brainstorm it
Mine looks like this:
You can copy it from the APPENDIX at the bottom of the post

Step 3: Chart Study
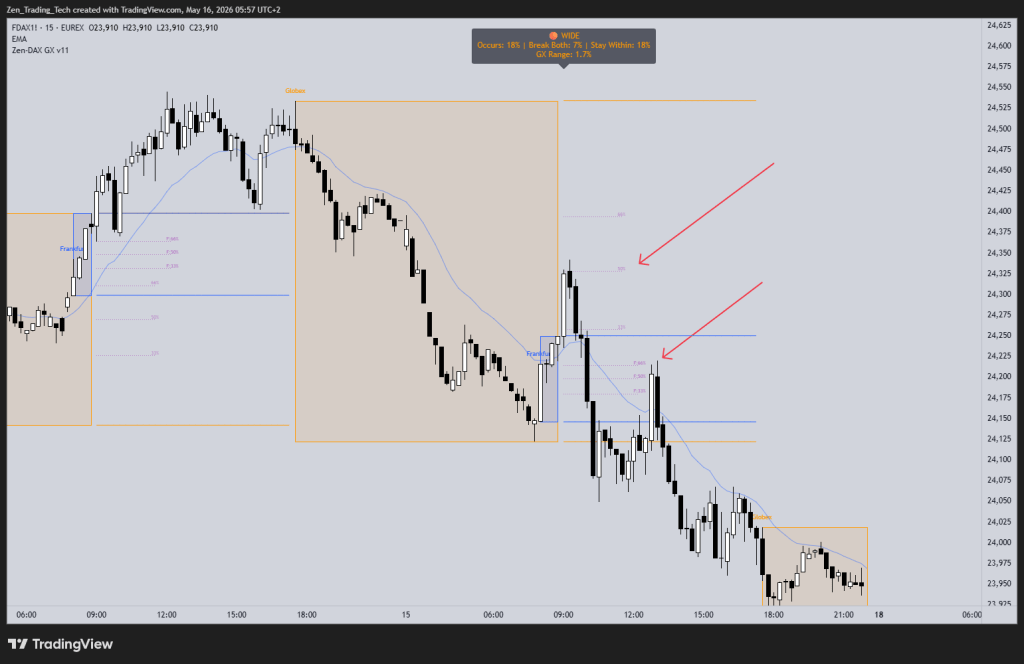
Go hunting. Look through your charts and start marking up real examples of the pattern.
📈 Timeframes I used:
- 5-min chart (intraday details)
- 60-min chart (swings and setups)
- Daily chart (ETH example shown)
🖍 What to mark:
- Spike and channel structure
- Last sell climax
- Breakout attempts (both successful and failed)
- Entries, exits, traps
- Any weird or interesting observations
For example:

Step 3: Create Your Version of the Notes
You can follow the structure I used, but use different charts.
The idea is to use my draft as a launch pad, not a crutch.
Step 4: Start exploring and expanding concepts
🧭 Channel Drawing Techniques
- Start with the initial spike, then add parallel channel lines.
- Or, draw from lower highs to capture the grind down.
- Be flexible—there’s often more than one correct way to draw a channel.
Redrawing is part of the process. Channels evolve.
⚖️ Channel Failures – What They Often Look Like
- Late breakout = exhaustion
- Often breaks the channel line before reversing.
- Might hit measured move (MM) before failing.
- ~25% chance the breakout continues.
- Typical behavior
- Reversal within 5 bars back to top of the channel (75%).
- Sometimes one more small leg (60%) before that.
- 10-bar, 2-legged pullback (10B2L) common.
- Often fills gap with prior swing low = no more breakout gap = exhaustion gap.
🧠 Further Observations
- These patterns can morph into Major Trend Reversals (MTRs).
- If the breakout leg is tight, it might act like a trend channel (TC) first.
- Breakouts often trap stop entries—good for fading.
- Bear channels can form dueling lines patterns into a HTF double bottom.
- Sometimes you get a spike breakout that fails with no channel at all.
- Breakouts can fail even within a larger bear channel (fractal structure).
- The gentler the channel slope, the longer it can last. Inertia matters.
- Channels often flatten first before reversing.
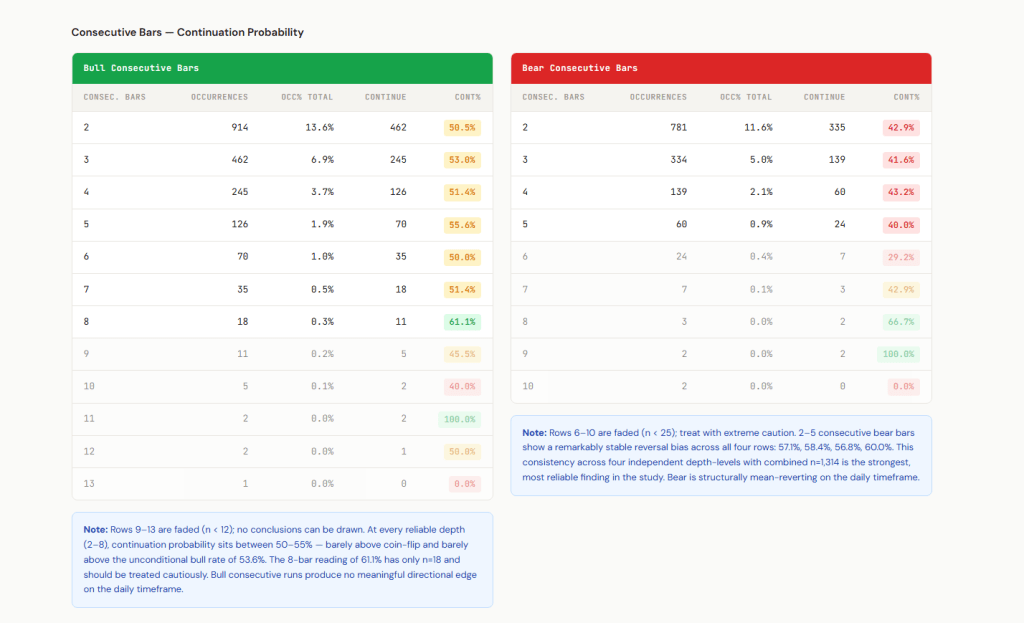
Step 5: 🧪 Track the Hit Rate
Do your own stats.
- How often does a Bear Breakout of a Bear Channel fail?
- How far does price go before it turns back?
- How clean are the reversals?
📊 Data = Confidence. This helps you trust the trade when you see it live.
🎯 What Happens When It Works vs. Fails?
Ask these:
- When the breakout works, how far does it typically run?
- When it fails, what type of reversal follows?
- Are you getting 2nd entry trades at the reversal point?
- What are the HTF conditions? Is the breakout just a pullback in a bigger TR?
🔍 My Takeaway
This process forces you to internalize the pattern, not just memorize it.
By the time you’ve gone through dozens of these examples on different timeframes, you’ll OWN the setup.
I’m intentionally not sharing all my charts here—so you can take the idea in your own direction.
You WILL find something I missed. You WILL build a better version.
That’s the point.
🧠 Final Tip: This is Your Encyclopedia
Forget endless screenshots in a folder you never open again.
Build your own trading encyclopedia:
- One pattern at a time.
- One page per setup.
- With your own charts, thoughts, and discoveries.
That’s how you become the trader who doesn’t need to ask what a Bear Channel failure looks like—you know.
Let me know if you try this process—or want to suggest a new pattern to work through.
Appendix- My Draft Notes For You to Start With
Here are some notes for you to kick off with.
Failed BO below BR CH – Reversals
- Drawing channels
- 2 options
- Take the initial SPIKE as width of channel
- Connect successive lower highs
- There are often two ways to draw it and you can redraw it – No patterns are perfect
- 2 options
- Strongest move LATE in trend – possible exhaustion (75%/25%)
- Overshoot BR Ch line
- Can go MM before reversing
- 25% Chance keeps going
- Ch is 1/2 a TR
- Test top last SX
- 75% reversal to top of CH in 5 bars
- 60% – end BR or one more small leg
- 10B2L
- Gap closed with low of CH / TR
- Can become MTR
- If BR move tight – is a TC so can minor reversal first
- Can get one more leg
- BL buy above strong BL bar for test CH – where BR can sell again
- Trend vs counter-trend (using HTF)
- Bear Channel can be DUELLING LINES pattern (ie wedge pullback to a HTF DB)
- Spike fails without a channel
- Fractal – BRBO Fails in Bigger BR Channel
- Drawing channels using MA
- More gentle the channel – longer it can go on – Inertia


Leave a comment