The Micro-Gap Reversal– A Simple and High Probability Pattern

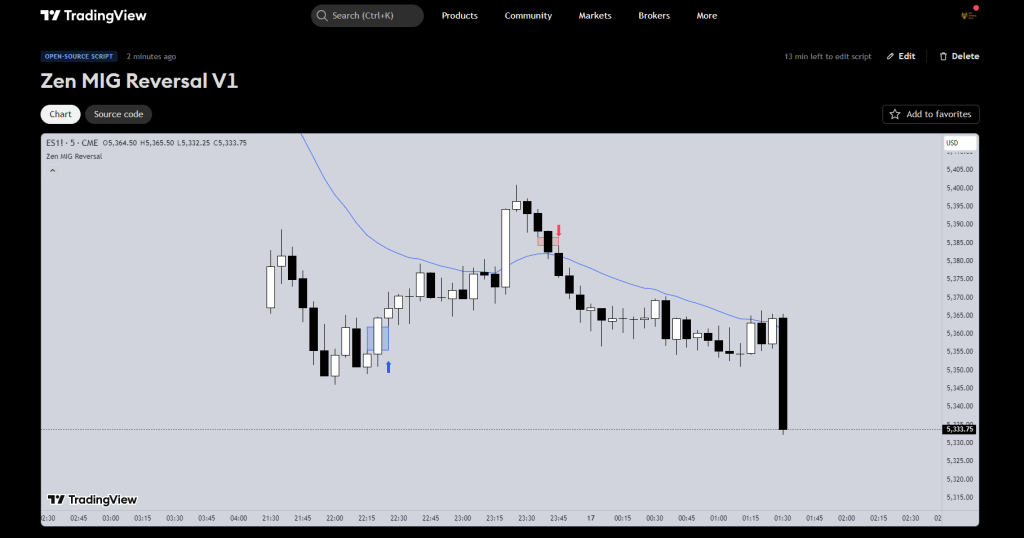
This indicator is built to highlight a specific kind of 3-bar structure — something I’ve seen repeat after momentum gaps or aggressive moves.

it is a micro-gap (gap between 3 same-colour bars) on the WRONG side of the moving average.

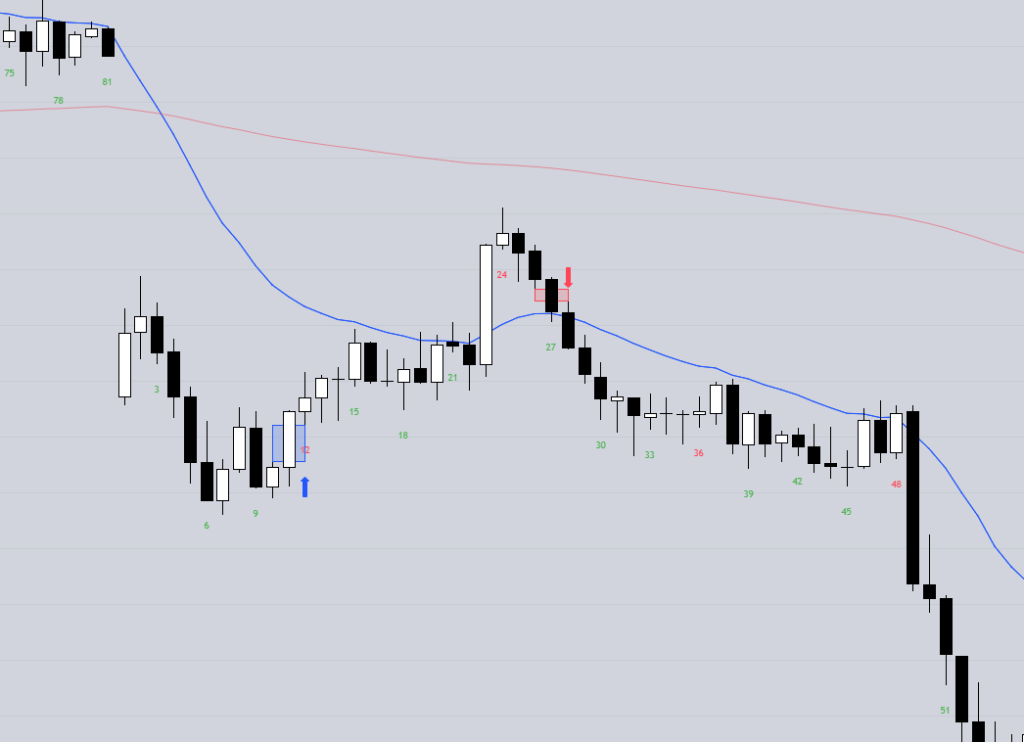
Bears getting 3 consecutive bear bars ABOVE the MA? MIG Reversal

Bulls getting 3 consecutive bear bars BELOW the MA? MIG Reversal

It doesn’t happen often, and that’s the point. It’s not designed to give you constant trades. It’s meant to mark rare spots that are worth studying.


The Setup

There are two patterns in the script: Bull Reversal and Bear Reversal.

Bull MIG Reversal:

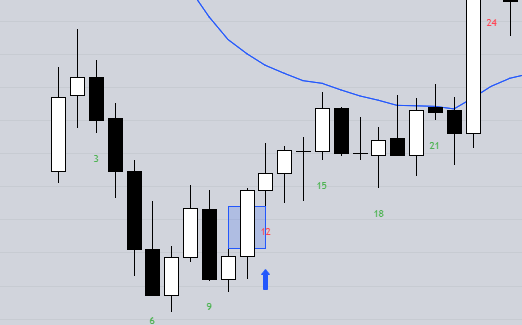
  • 3 bull bars in a row
  • The third bar’s low is above the high of the first bar – gap
  • The low is also below the 20 EMA

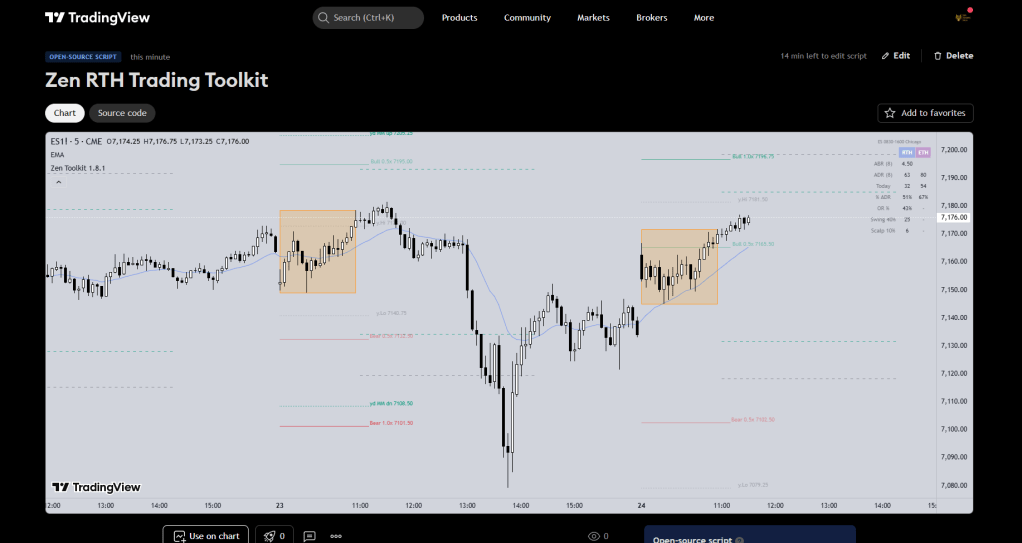
This shows strong momentum that might be extended. A box is drawn from the high of the first bar to the low of the third. A small blue arrow appears just below the bar before the signal.
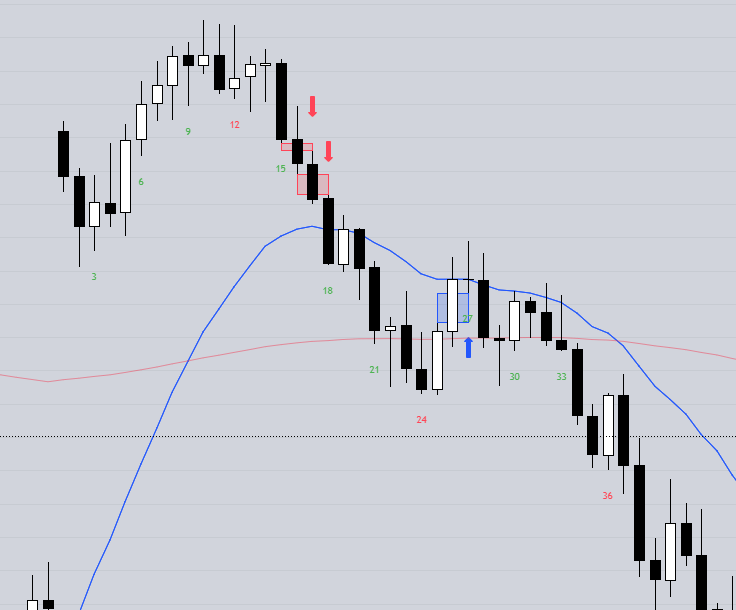
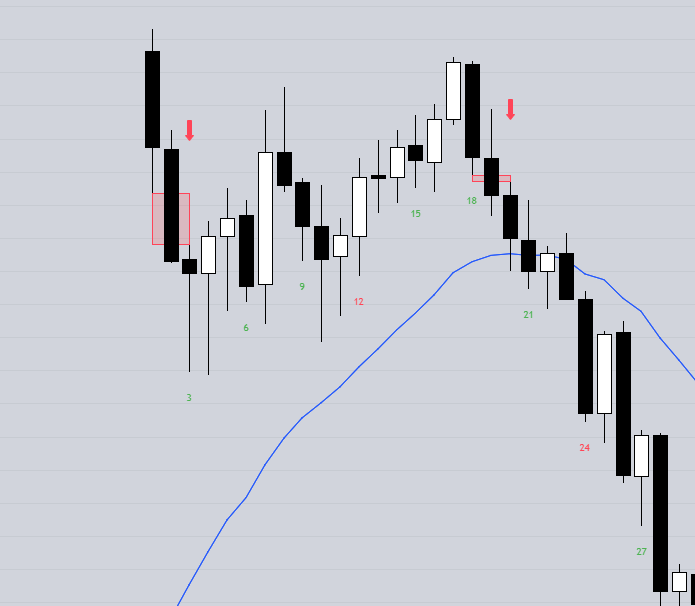
Bear MIG Reversal:

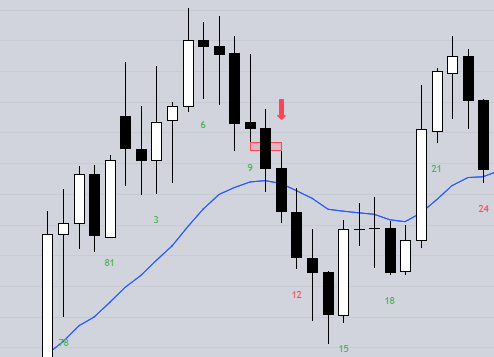
  • 3 bear bars in a row
  • The third bar’s high is below the low of the first bar – gap
  • The high is also above the 20 EMA

This marks a potential exhaustion point after a selloff. A red box highlights the zone from the low of the first bar to the high of the third. A red arrow appears just above the bar before the signal.


Filtering out Countertrend signals

  • Sometimes two legged pullbacks have one leg as a MIR Reversal – remember context and try to align yourself with the strongest move

Why Use It

It’s meant for discretionary traders who want to track clean patterns — not automate entries.

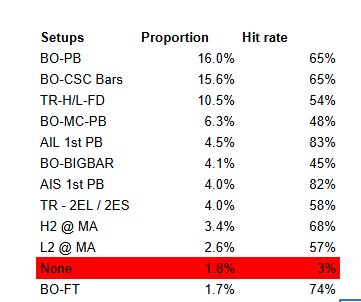
It has a very high hit rate – even more if you can exclude / filter out the counter-trend ones.


Custom Options

  • Toggle arrows on/off
  • Toggle the EMA line on/off
  • Adjust smoothing

Final Thoughts

It’s a rare setup. That’s intentional. You’ll only see it a few times per month per symbol — but when it shows up, it’s usually worth a second look.

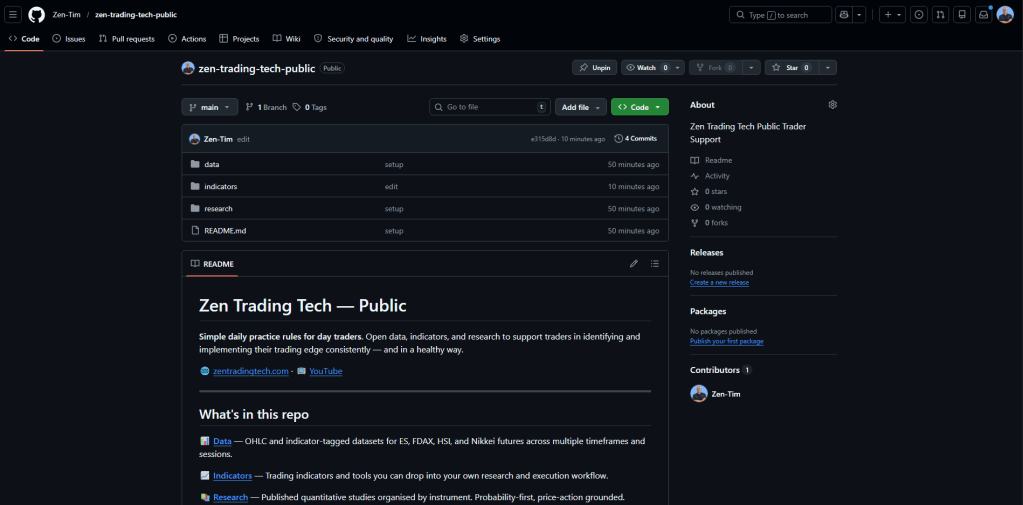
Link to the indicator:
Zen MIG Reversal V1 on TradingView

Note: This is not financial advice. Use at your own discretion. Backtest everything.

7 responses to “The Micro-Gap Reversal– A Simple and High Probability Pattern”

  1. Enkidu Avatar
    Enkidu

    Hi Tim
    Thank you for sharing your insights. I have a question: I tend to do well as long as I stick to trading the Walmart-style trade. However, I find micromanaging my trades very challenging. Weeks where I focus solely on Al’s Walmart-style trades are almost always profitable, but weeks where I spend all my time staring at the screen are mostly unprofitable. Do you have any advice?

    Thanks again for all your efforts—your YouTube channel, free indicators, and this blog have been incredibly helpful. We could really use more content in the Psychology category. By the way, I wasn’t able to post this comment directly under the Psychology category (Article: How to Reset Your Trading Mindset).

    Like

    1. Tim Fairweather Avatar

      Hi Enkidu – thanks for your reply and your feedback I really appreciate it.
      I would need to see your trades tto take a look – are you on Discord at all? I’m in the Brooks Trading Course – I’m Tim F, colour in Blue for admin – you’re welcome tto send me a msg there and perhaps we can discuss further? Thanks, T

      Like

  2. Micro-Gap Reversal– Youtube Video is up! – Zen Trading Tech Avatar

    […] The Micro-Gap Reversal– A Simple and High Probability Pattern […]

    Like

  3. cpt168 Avatar
    cpt168

    Hi Tim,

    Thanks for providing this indicator. I was doing some manual backtesting with this indicator and noticed that if I use a Regular Trading Hour’s 20 EMA vs a Electronic Trading Hour’s 20 EMA, there would be a higher occurrence of these on the RTH. So I was curious if you use the 20 EMA on RTH or ETH? Thanks!

    Like

    1. Tim Fairweather Avatar

      Hi mate, I answered your message above. It sits on my chart so I can change the time frame but on the open I often wait to see more price action before looking for entries. If you use the ETH you’re going to get additional entries potentially.

      Like

  4. cpt168 Avatar
    cpt168

    Hi Tim,

    This might be a duplicate. I was trying the indicator and doing a little manual backtesting. I noticed that the location of the 20 EMA varied between using RTH and ETH timeframes. Do you generally use it for RTH or ETH? I will continue to test and see what the results could be for either one.

    Like

    1. Tim Fairweather Avatar

      Hi mate, that makes sense because RTH is the regular trading hours and ETH is extended. That means if you’re going to use RTH on the first 19 bars of the day, it’s going to use yesterday’s price action and for some traders that’s an issue. For me I find that’s okay because on the open a common pattern is to drift to that moving average. If we have a big gap up, the market moves sideways to down while the moving average drifts sideways to up. I’m totally fine with trading in this way. If that affects the trading strategy that you have, you can just use the ETH chart for the first hour or so. Does that make sense?

      Like

Leave a comment

I’m Tim

Welcome to Zen Trading Tech.

I’m a Aussie day trader and I post trading tips, practice drills, and indicators that helped my trading get to a professional level.

Everything here is to help train the eyes and hands to trade better. If it helped me I’ll post it for others. Hope you enjoy!