-
 Continue reading →: Does a Big Gap Mean a Trading Range Day?
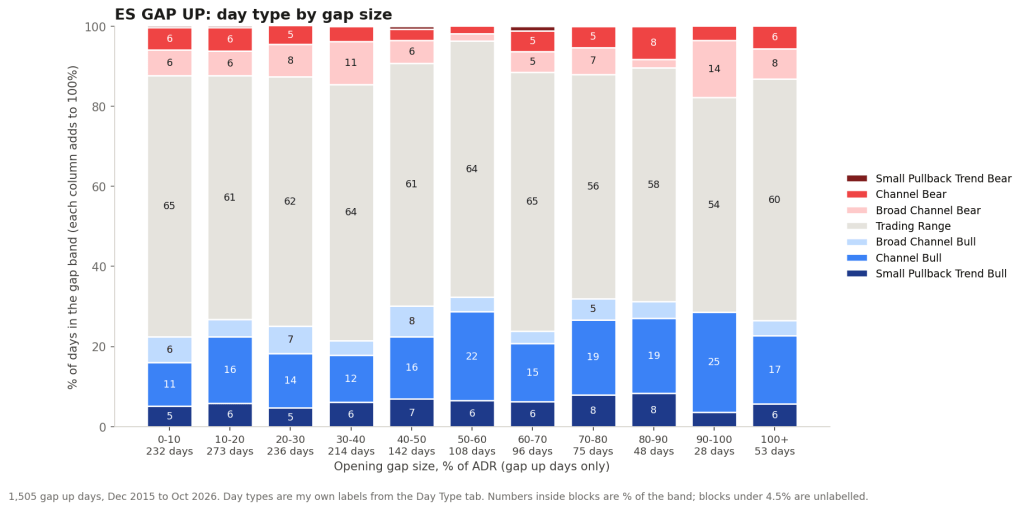
Summary (TL;DR) There’s a saying: the bigger the gap, the more chance of a trading range day. I have been trading on it. But I will show how I have changed this for myself. I uncovered a hidden bias in my trading. When I saw a big gap, I thought…
-
 Continue reading →: Legs, Swings and Day Type
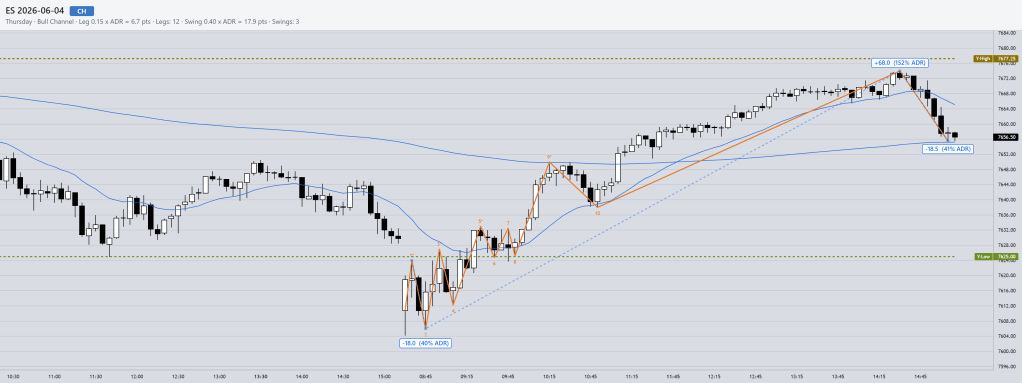
Summary (TL;DR) I wrote a post on leg counting, then a post on trend days. I should have written this one in between. I got excited. Legs alone did not separate trend days. Swings do. A swing is the link between the two posts. The average ES day: 15.6 legs…
-
 Continue reading →: What is a Trend Day?
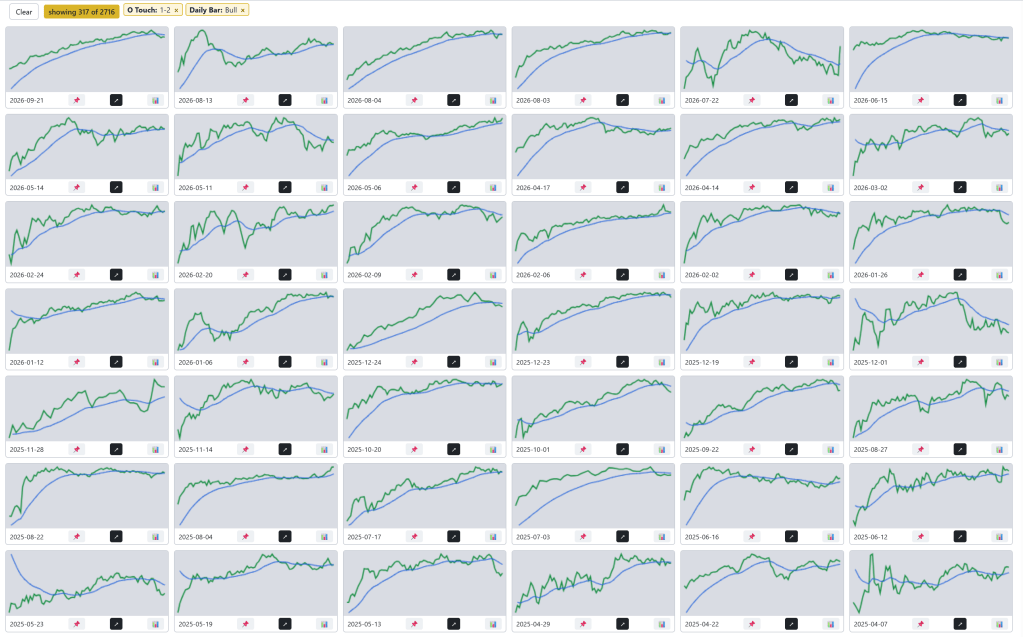
Summary I want to research trend days so I can improve my ability to trade them, but how do I get a list to study? I tried and failed to get AI to find me all the trend days on ES. So I classified them manually – all 2,716 days…
-
 Continue reading →: My Trading Edge Research Kit #4: Last Week’s Close, How Often Does ES Trade Back to It? (Free + Claude)
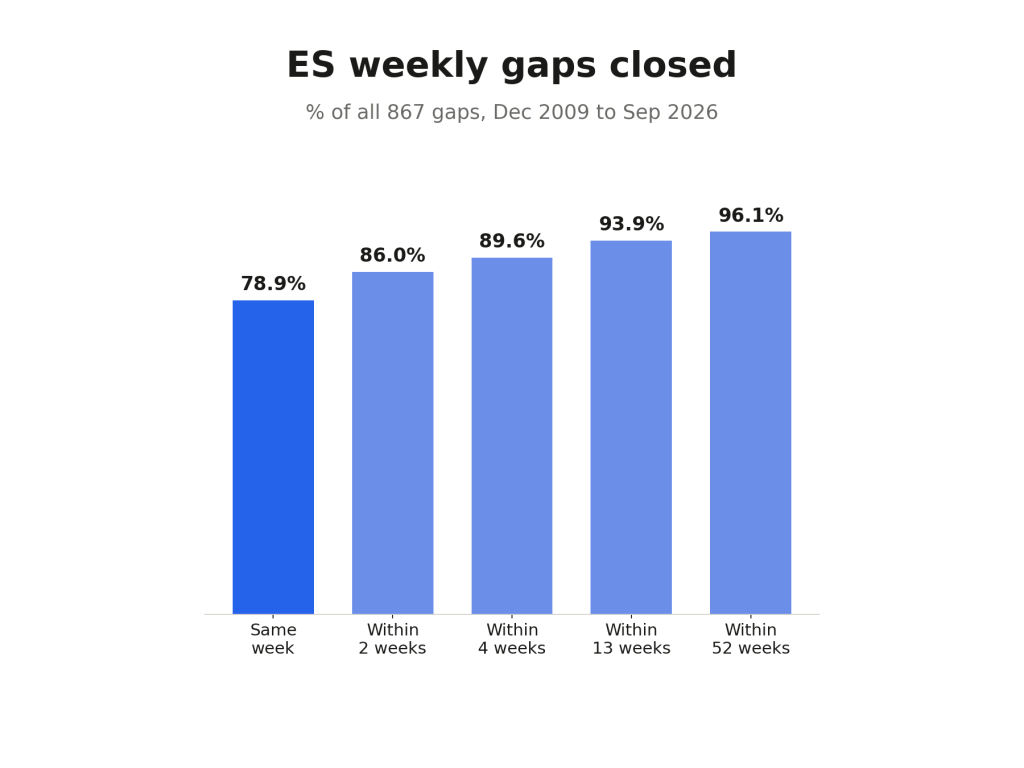
17 years of ES weekly gaps: how often price trades back to last week’s close, which day it happens, how gap size changes it, and how many weeks the rest take. Data, rules and script free on GitHub.
-
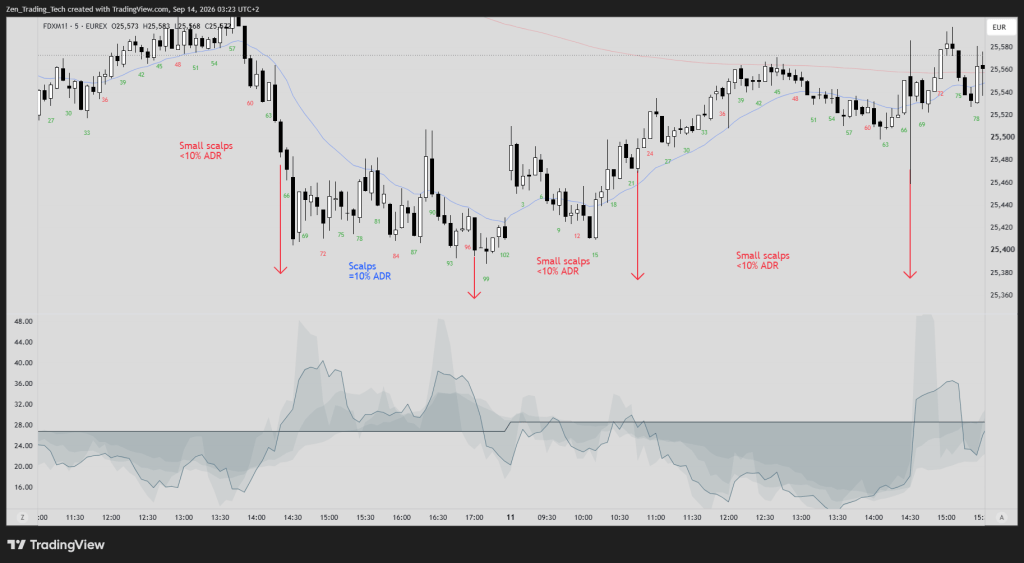 Continue reading →: Is a Scalp Worth Taking on This Timeframe?
A free TradingView indicator that puts your scalp target and the market’s own average bar size on the same scale, in points, so you can see at a glance whether one bar can carry the trade.
-
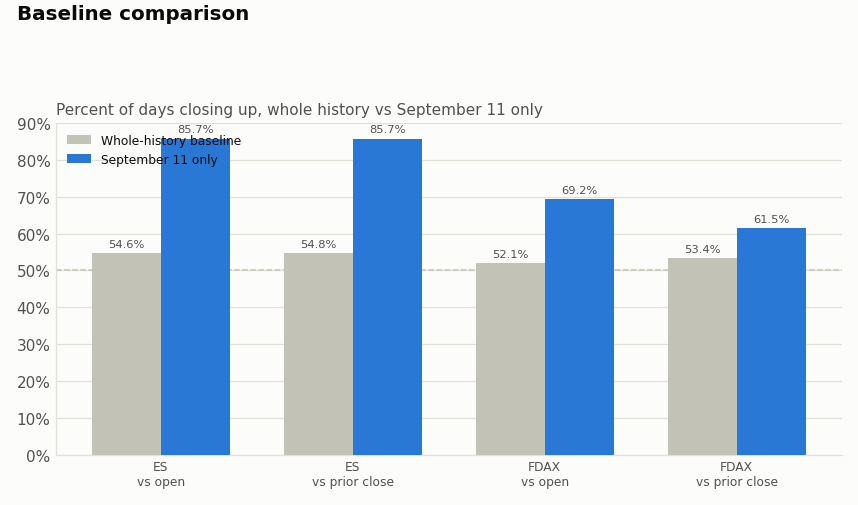 Continue reading →: Does the Market Always Go Up on September 11th? Friday Stats-Snack
The hypothesis: does the market always go up on September 11th? Someone said it in the room this morning, after FDAX opened — it’s trading right now as I write this. ES trades tonight. Here’s how I tested it, and what the data shows. Maybe I cnan use it when…
-
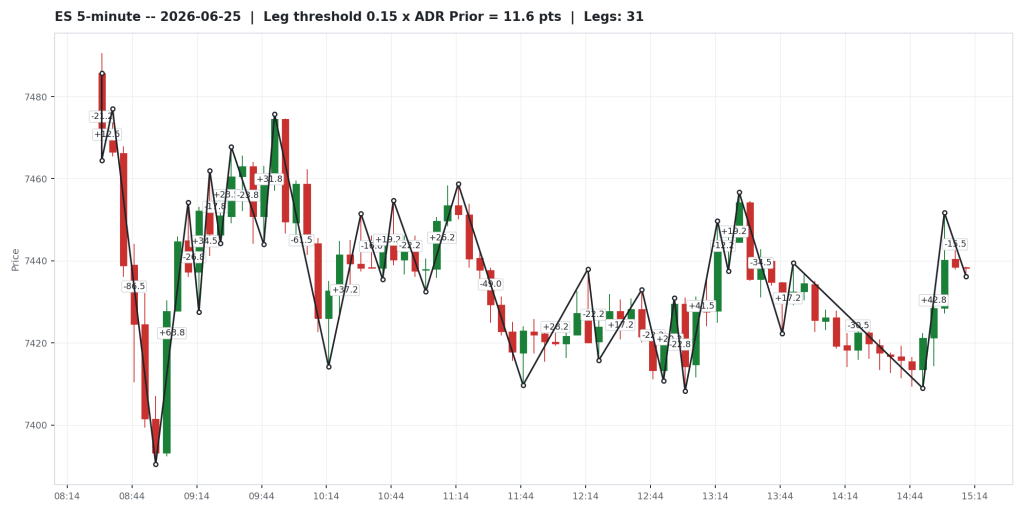 Continue reading →: Not Another Post on Leg Counting!
Some traders couldn’t care less about leg counting. I get that. Yet as a scalper, I can’t help thinking that my study and focus on leg counting is part of my success! Breakouts get second legs, reversals get second legs – it’s exactly what I’m looking for. In English we…
-
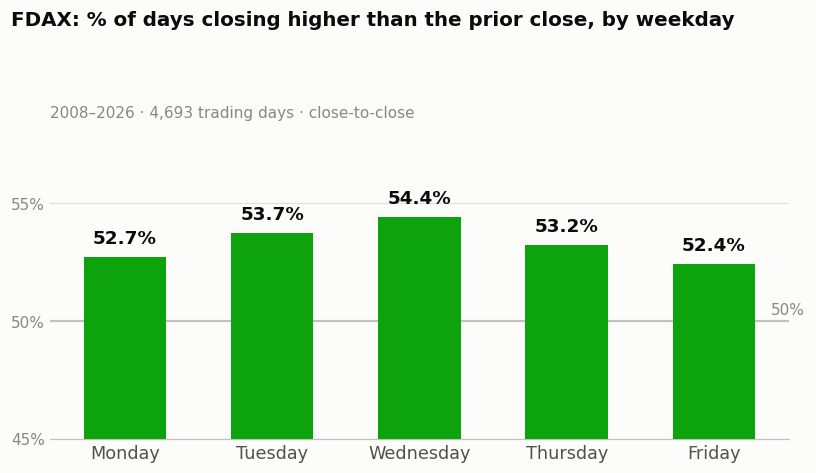 Continue reading →: Do Thursday’s Sell off on DAX?
Someone said it again this week: “Everyone knows Thursdays sell off into the weekend on the DAX…. I’ve heard some version of that line for years — on Fridays too, on other markets, always stated as fact, never with a number attached. So I ran it. FDAX daily data, 2008…
-
 Continue reading →: Consecutive 60 Min Bars on the Open – Researching How We Can Trade it
Here’s a question I couldn’t stop thinking about: if the first two 60-minute bars of the day are the same color, how much does that actually tell you about the rest of the session? I got here from a different chart. I trade the 5-minute, and I kept noticing how…
-
 Continue reading →: Boost Your Trading with Free Opening Spike Analysis Indicator
I built a small indicator for something I check every morning anyway: what did the first couple of bars do. This is an enabler for research in trading the open – and with this tech and AI you can run a lot of cool ideas. The code is open-source so…
-
 Continue reading →: My Trading Edge Research Kit #3: 29 Years of ES Bull Streaks (Free + Claude + TradingView)
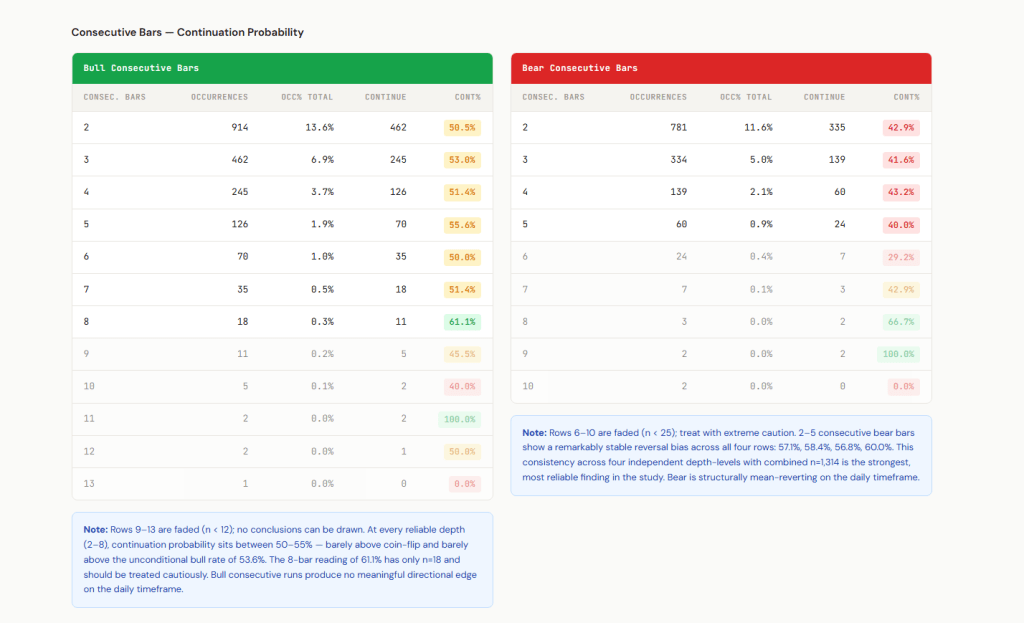
Here’s a question I couldn’t stop thinking about: after nine consecutive bull weeks on ES, is the tenth week more likely to continue or reverse? The answer is reverse, and it was high probability which you will find out below. We were talking about it in the Brooks Price Action…
-
 Continue reading →: My Trading Edge Research Kit #2: The DAX Pre-Market Stat That Changed How I Trade the Euro Open (Free + Claude + TradingView)
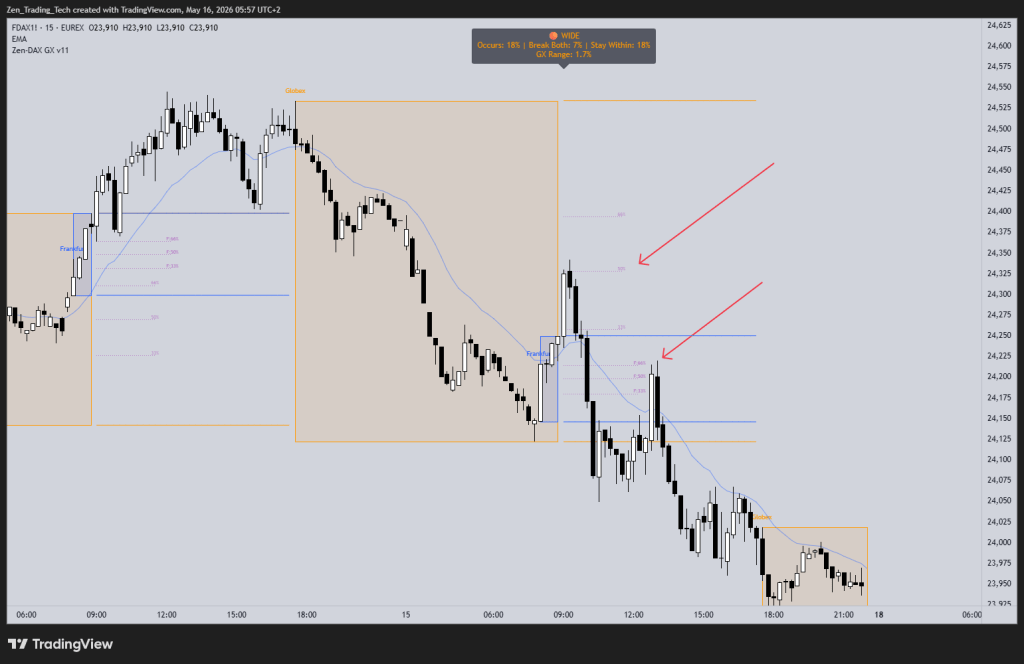
Intro In this post, I’m looking at strategies relating to a breakout of the pre-market on DAX the German Index Futures. My intention for this post is to explain the research I did and give you access to all the materials for you to replicate the research. There is a…
-
 Continue reading →: My Trading Edge Research Kit #1: Daily Range Distribution (Free + Claude + TradingView)
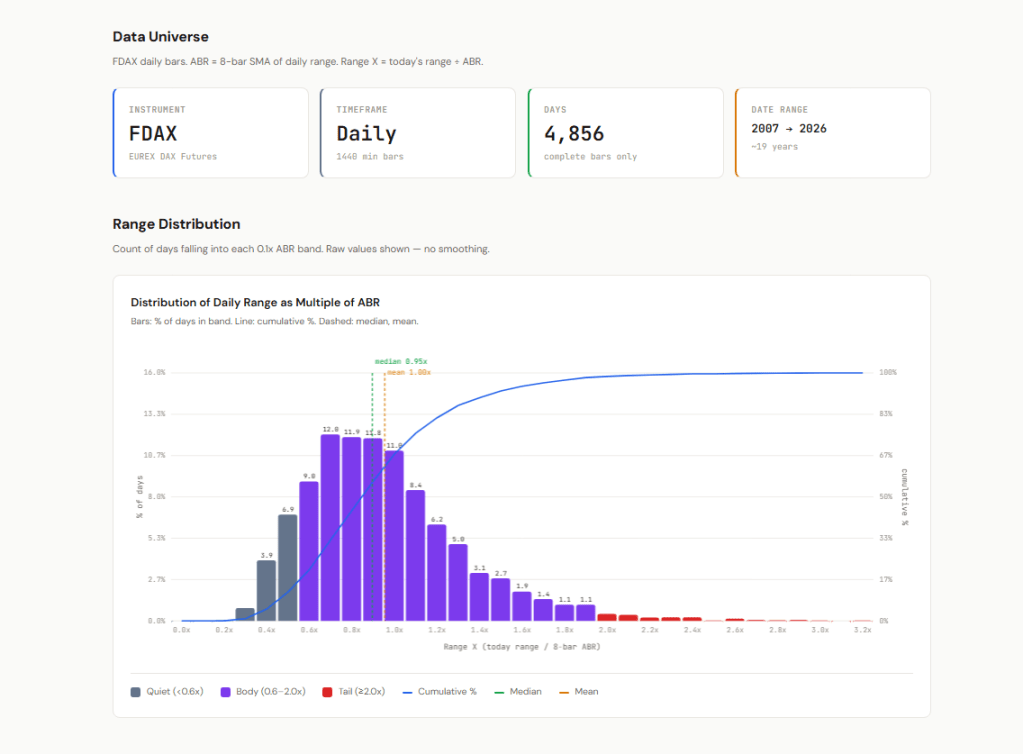
On the open, the range is often small. You can see it on the DAX most days. First hour prints a 100-point box. Maybe a double top, maybe a double bottom, maybe just sideways. And the question every day trader asks themselves at this point is the same one: Will…
-
 Continue reading →: Free Risk/Reward Ruler for NinjaTrader 8
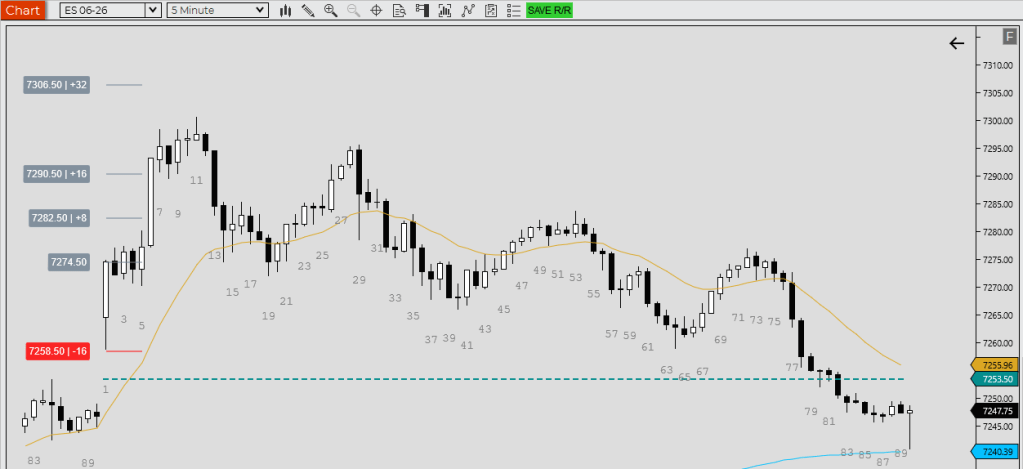
I built a free, open-source risk/reward ruler for NinjaTrader 8 and I’m putting it on GitHub. No catch. It’s a single .cs file you drop into your indicators folder, compile, and use. It does three things: measure R-multiples from the close (Buy/Sell the Close), measure R-multiples from a breakout entry…
-
 Continue reading →: DAX Post-FOMC Reaction Day: How Should We Trade It?
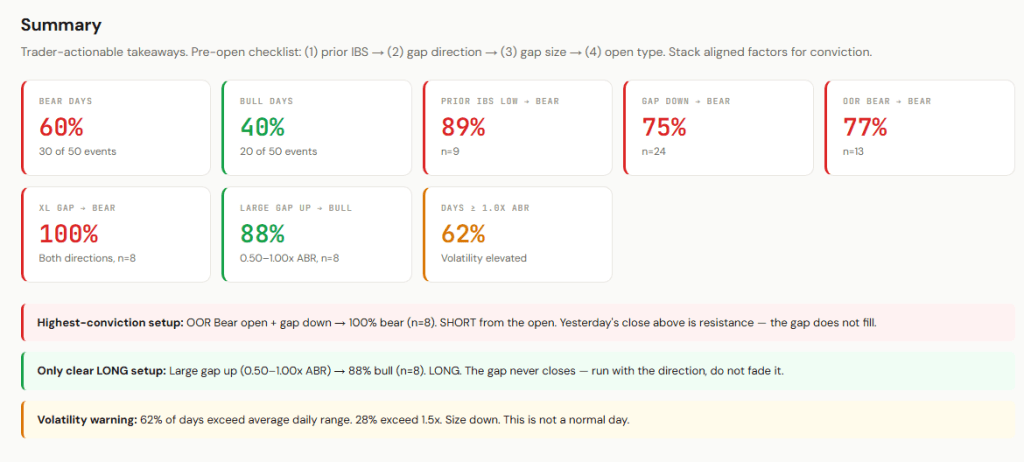
I just finished a study on every scheduled FOMC meeting since December 2019. Fifty events, looking at how the DAX reacts the next morning. Today is the first day I’ll trade with it. Caveat going in: 50 events isn’t a lot. The 2022–2023 hiking cycle is a big chunk of…
-
 Continue reading →: Trading Like a Grandmaster: What Chess Teaches Us About Price Action Mastery
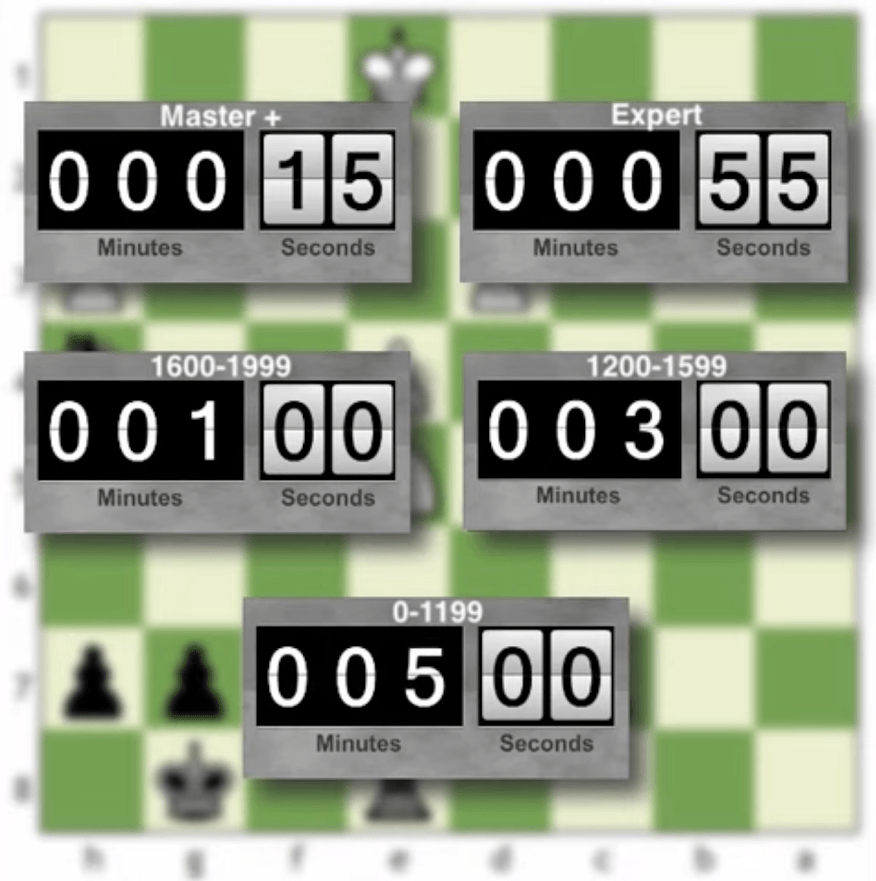
In my own trading journey I’ve come a long wya from thinking trading is about setups and indicators. I’m trying to synchronise myselfwhat the market is doing right now, and choosing the right response. A parallel discipline that trains that kind of thinking is chess. One of the best frameworks…
-
 Continue reading →: Zen Trading Toolkit Indicator — Three Research Modules, One Indicator
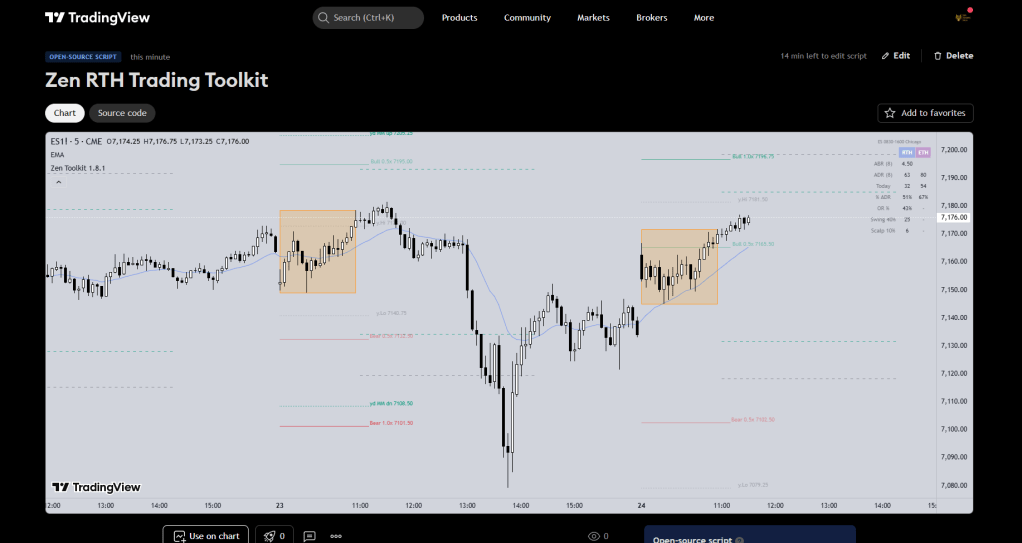
Three research modules in one indicator — ABR Measured Moves, 18-bar Opening Range, and a Volatility Stats Table. Free on GitHub. ES, FDAX, HSI, Nikkei presets built in.
-
 Continue reading →: Why Do I Keep Blowing My Account?
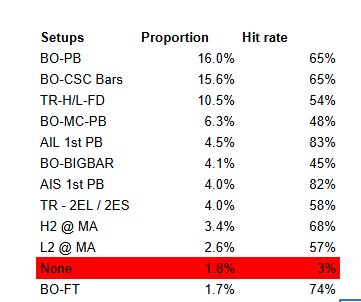
You hear that all the time from traders. So in this post let’s talk about the why? This post is for the trader stuck in a cycle — doing well for a while, building the account, feeling confident… and then blowing it up. I was there for a looooong time.…
-
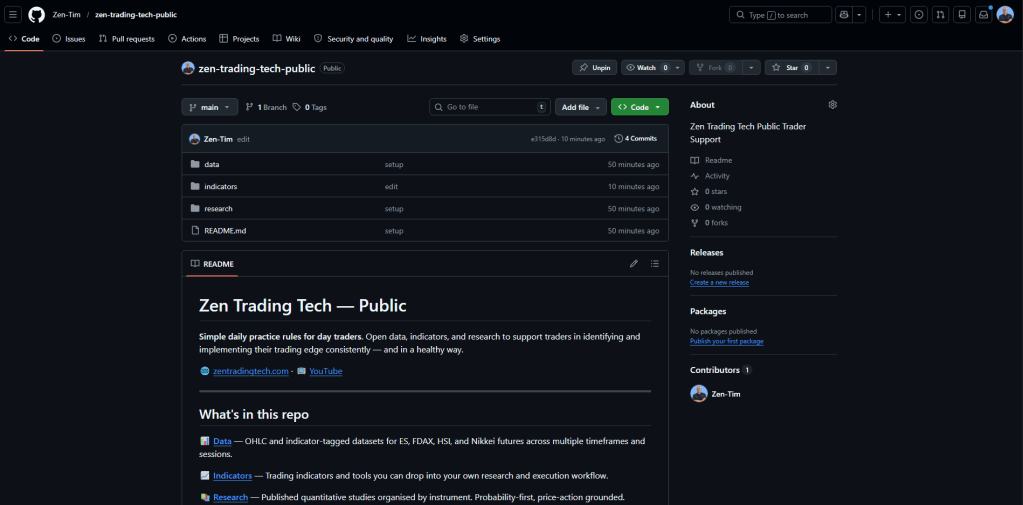 Continue reading →: Zen Trading Tech on GitHub — Indicators, Data, Research
Quick one today. I’ve set up a public GitHub for Zen Trading Tech, and I want you to know it’s there. github.com/Zen-Tim/zen-trading-tech-public What’s on there Three folders at the moment: Indicators — free TradingView Pine Script indicators with a README for each one. First one up is the Zen OOH…
-
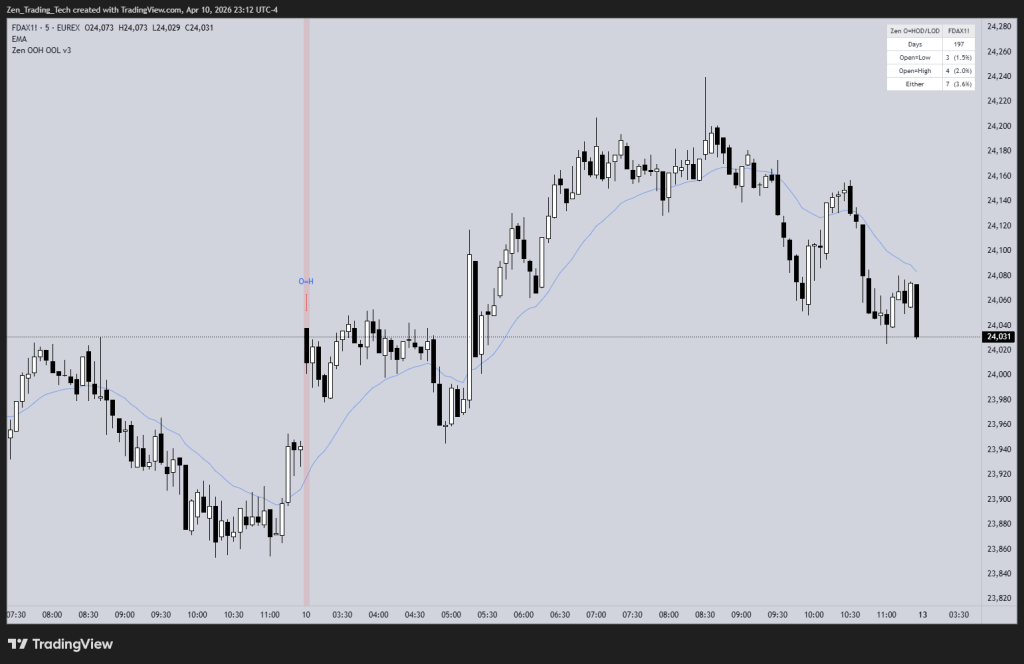 Continue reading →: Shaved Opens Revisited: Open on High, Open on Low
A couple of years ago I wrote a post about shaved opens — those rare sessions where the first bar of the day opens exactly on its high or low. I’ve been thinking about them again lately, and I wanted to come back and add a layer to what I…
-
 Continue reading →: How I Review My Trades Using Second Leg Concepts
I recently published a deep-dive post on second legs — Everything Can Get a Second Leg. Even a Second Leg! While writing it, I went back to Al Brooks’ books and took detailed notes on every second leg concept I could find. Then I did something simple: I took those…
-
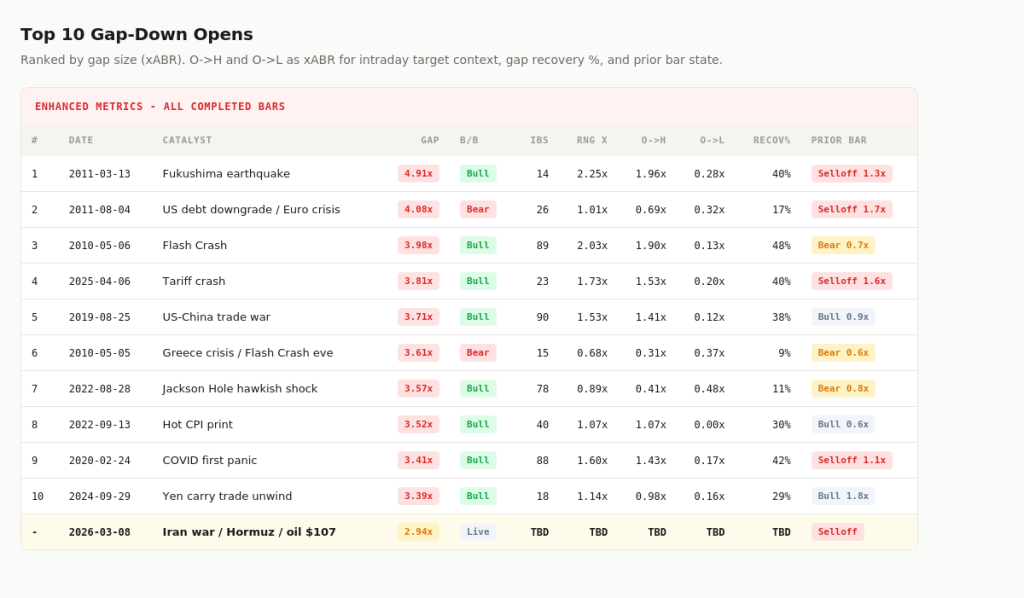 Continue reading →: Nikkei: What Happens After a Historic Gap-Down Open?
Today on March 9th, Nikkei 225 opened nearly 4,000 points below Friday’s close. That’s a gap-down of 2.94x the average bar range (ABR). The catalyst: Iran, the Strait of Hormuz closure, oil spiking above $107. When something like this happens, the instinct is to panic or to “buy the dip”…
-
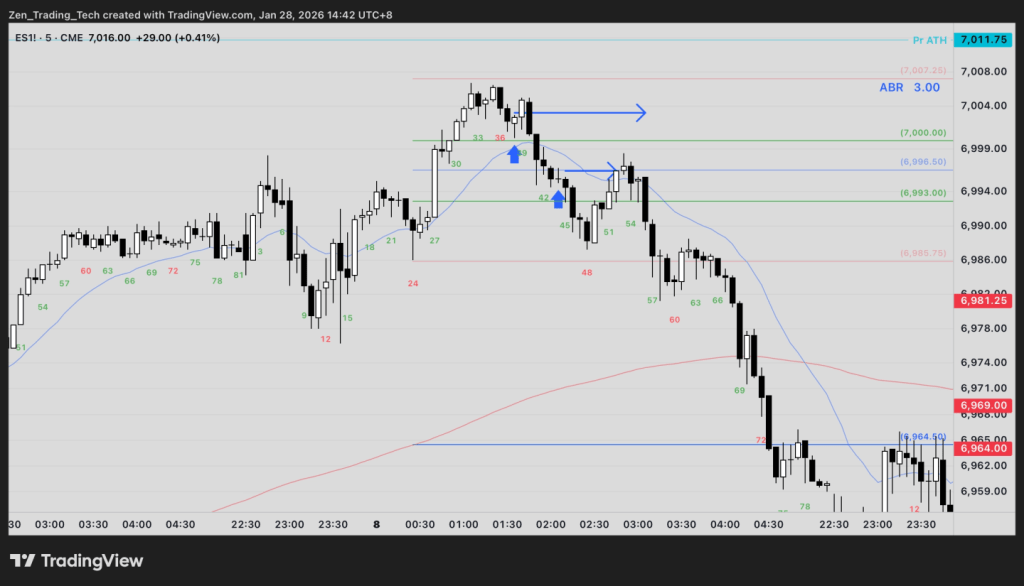 Continue reading →: Failure of a Failure: When the Test Target Fails Too (Part 2)
Introduction This is Part 2 of the “Failure of a Failure” series. If you haven’t read Part 1, start there — it covers the foundation: what happens when high probability trades like the H2, L2, and bear microchannel fade fail, and how each failure creates a test target. In this…
-
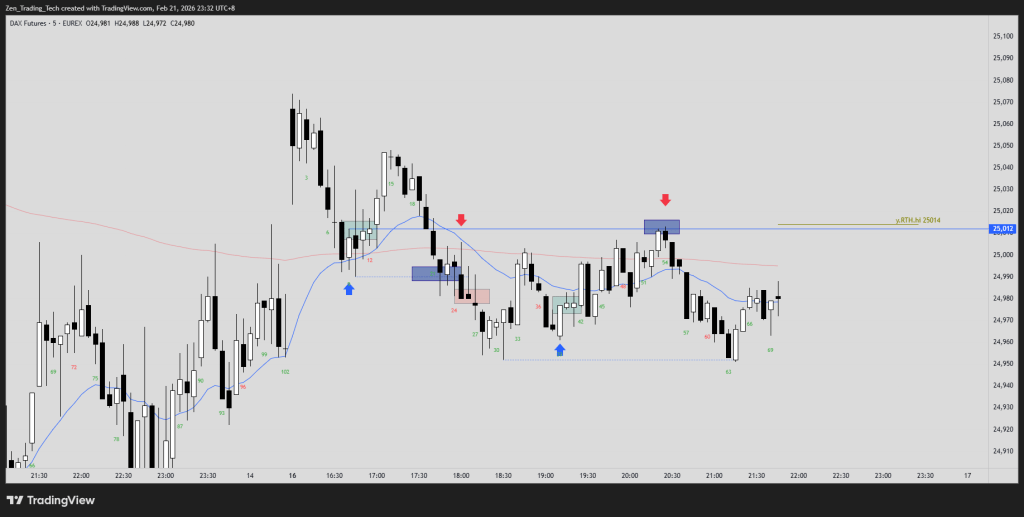 Continue reading →: When High Probability Trades Fail: How Losses Become Setups (Part 1)
Video Introduction Every trader has experienced this: you spot a textbook high probability setup, you take the trade, and it fails. The natural reaction is to take the loss and move on. But what if the failure itself is the setup? This is one of the most powerful concepts in…
-
Continue reading →: Everything Can Get a Second Leg. Even a Second Leg!
If there’s one idea that explains more of what happens on a chart for me than anything else, it’s this: everything gets a second leg. Maybe it works for you, maybe it doesn’t, but it helps me trade, so I’ll do my best to share it. Strong breakouts get a…
-
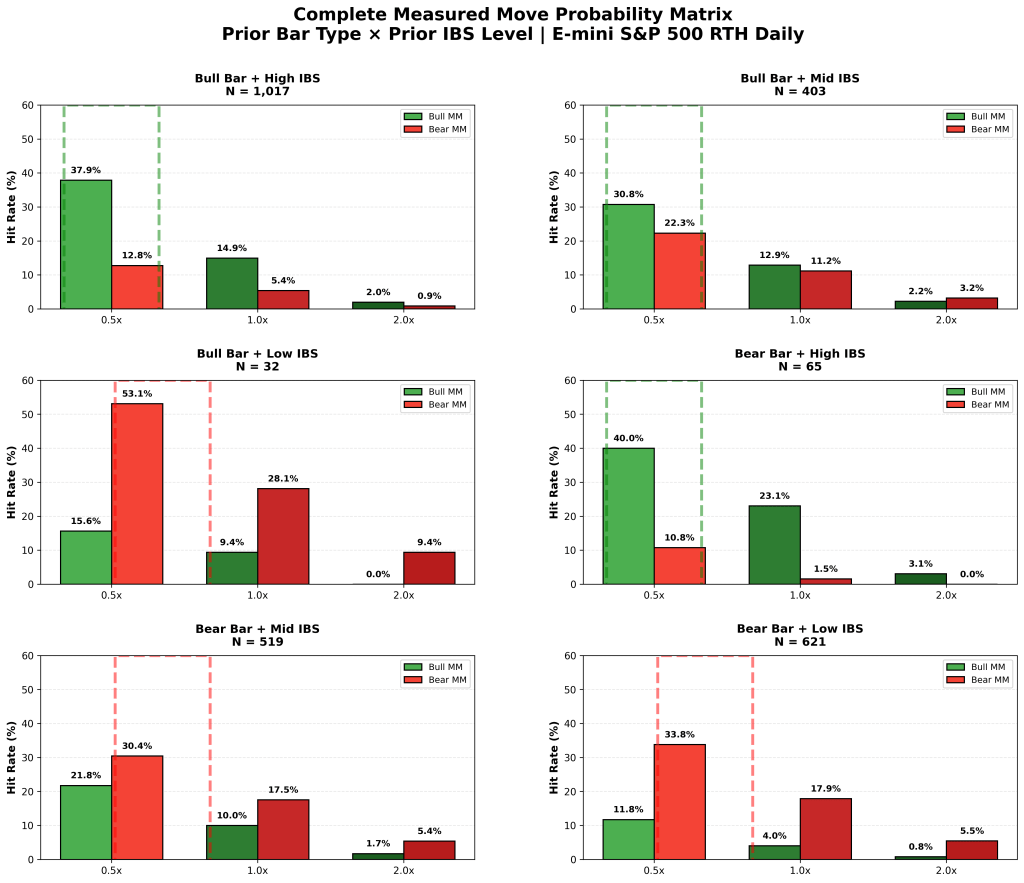 Continue reading →: Researching How to Trade a Measured Move of Yesterday’s Range
Yesterday was a bull trend from the open which ended at a measured move of the day before. Which got me thinking about some old research I needed to update. What really are the chance we get a measured move of yesterday’s range? In this post I will explore it…
-
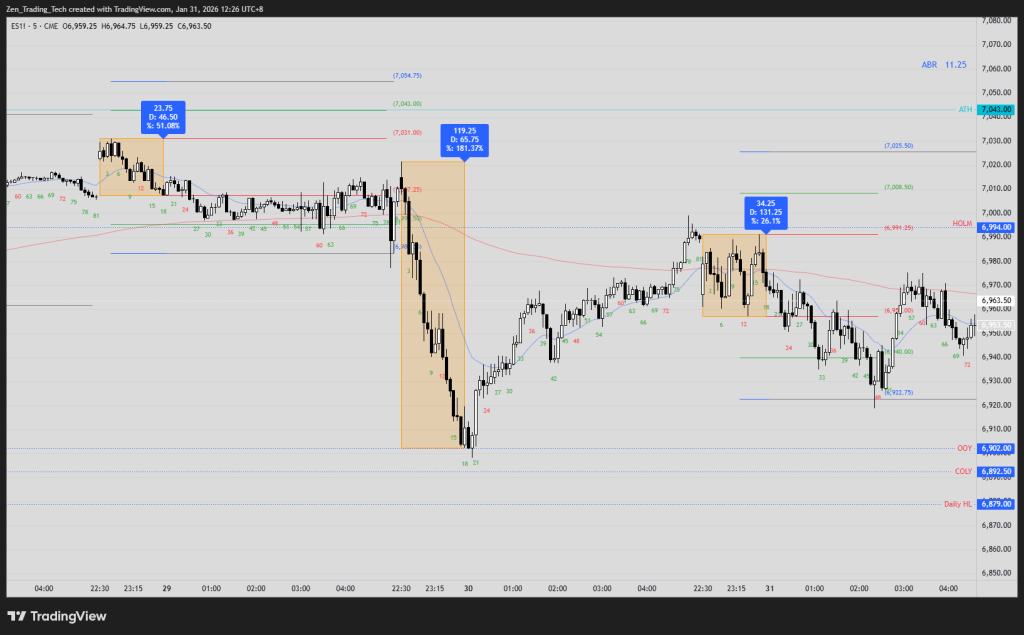 Continue reading →: ES Swing Trading and the 18-Bar Range
Introduction In this article, I propose ways to look at the open of the day and possible swing targets. I will use the 18-bar range show ways to research it. Then we will explore possible targets, probabilities and hit rates for a trading system. My hope is that this post…
-
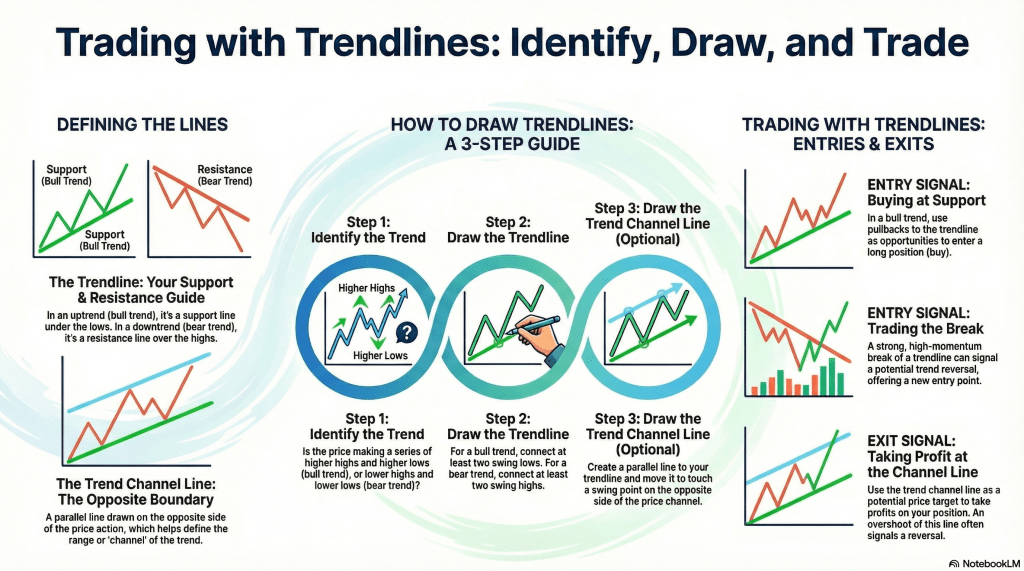 Continue reading →: The Art of the Retest: Refining My Trendline Strategies
I don’t think consistency in trading comes from finding a “perfect” indicator, setup, signal, size or exit; I think it comes from the relentless review of our performance every day. If Tiger Woods at #1 was still working on ‘fixing’ his swing… for sure I can keep reviewing the fundamentals…
-
 Continue reading →: Cash Indices and Higher Time Frame Pullbacks
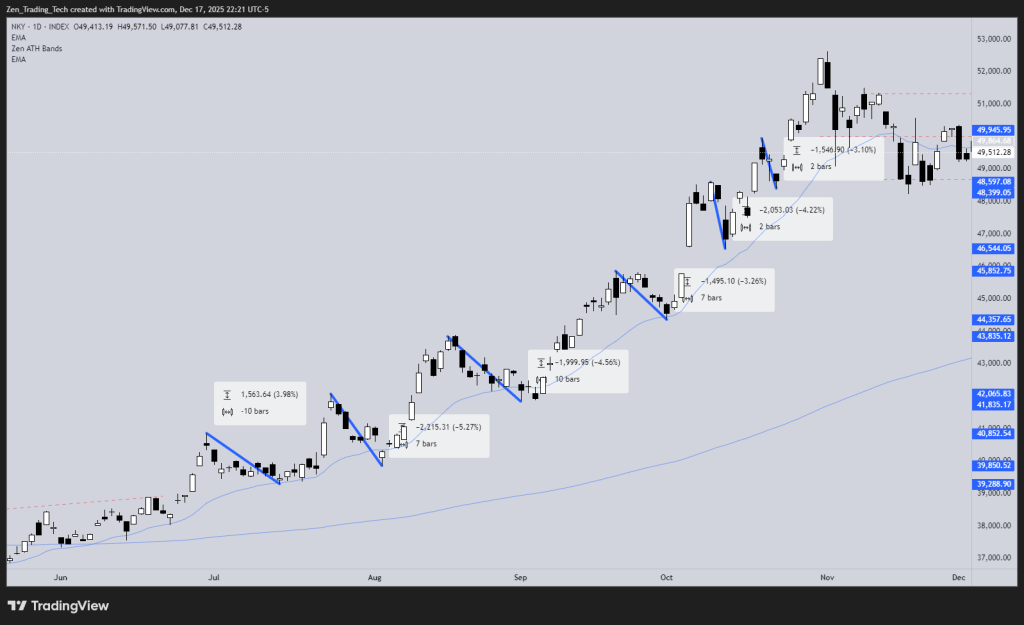
In this post I’m exploring ways traders use pullback % to trade higher time frame indices (using futures or other instruments as the cash index can’t be traded directly) It reminded me of an old funny quote by trader Michael Burry. Post with Indicator here Futures and Cash Indices Futures…
-
 Continue reading →: Mapping “The Dip”: A Visual Tool for Long-Term Investors
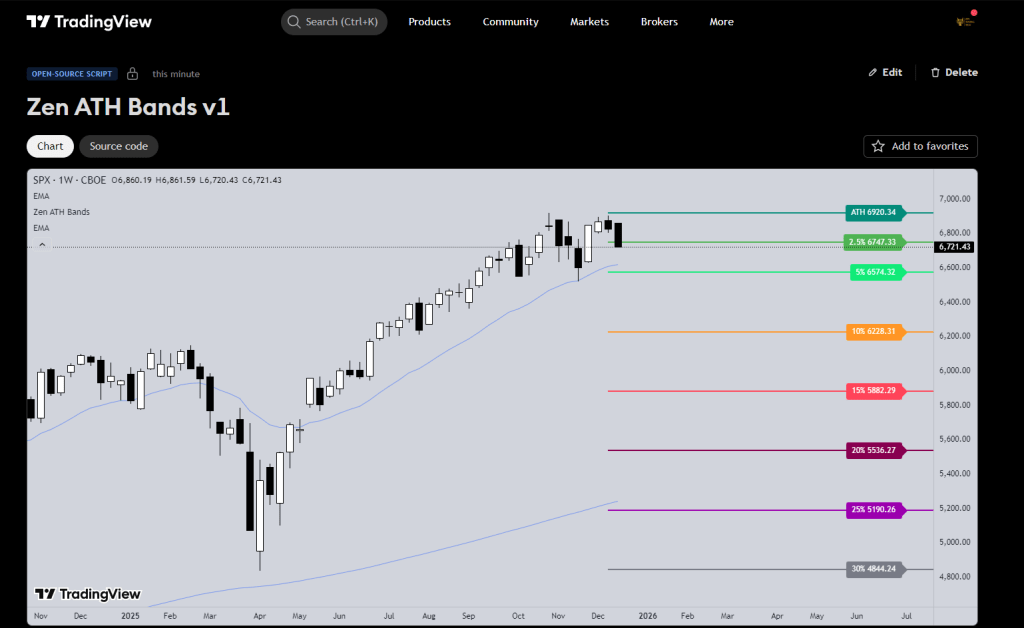
Here is a free All Time High and Pullback Indicator for TradingView This one is quite useful for higher time frame and investing. Code is open-source so you can adjust yourself 🙂 Technical Details This indicator plots horizontal drawdown levels projected into the right-hand margin. It calculates percentage drops from…
Hi,
I’m Tim

Welcome to Zen Trading Tech.
I’m a Aussie day trader and I post trading tips, practice drills, and indicators that helped my trading get to a professional level.
Everything here is to help train the eyes and hands to trade better. If it helped me I’ll post it for others. Hope you enjoy!
Join the fun!
Stay updated with our latest tutorials and ideas by joining our newsletter.

