-
 Continue reading →: Big ES Days – What follows?
10/10/2025 – ABR 3.37 – ? 31/7/2025 – ABR 2 – 2LD MM Down 9/4/2025 – ABR 2.15 – 50% PB, 2LU 4/4/2025 – ABR 2.15 – 50% PB, 2LD 18/12/2024 – ABR 3.6 – 66% PB 2LD 6/11/2024 – ABR 2.03 – 33% PB, 2LU 22/5/2024 – ABR 2.06…
-
 Continue reading →: Brooks Price Action Seminar – Workbook
Please find a workbook for today’s presentation: View Online (Click Save a Copy) https://docs.google.com/spreadsheets/d/1hChlLnojPUxGNYSVdwrOmIy_47q7_qAZAfexH0hwhuU/edit?usp=sharing Download .xls https://docs.google.com/spreadsheets/d/e/2PACX-1vQp5Q2NfQ8Zi5DfUbLuxrc0pp2hqbZLodJSFGvvLzGmj3-8Dn-O13eS3Rj1dvm0QWrxQufESLd0v3ah/pub?output=xlsx
-
 Continue reading →: 7 Common Trade Mistakes and How to Fix Them
Every trader makes mistakes. The difference between an edge which survives the market and one that doesn’t is not the absence of errors, but being aware of where they show up. All of the below have haunted me from time to time. Being aware of them already improves my edge.…
-
 Continue reading →: Practice Drills for Trading Ranges: Relief Bars, S/R and Gaps
Most of the time, when traders look at bars, the question is: “Is this a signal to get in?”But there’s another way to use them. A relief bar is not a signal to enter — it’s a signal to exit. Instead of thinking “BTC/STC” (buy the close / sell the…
-
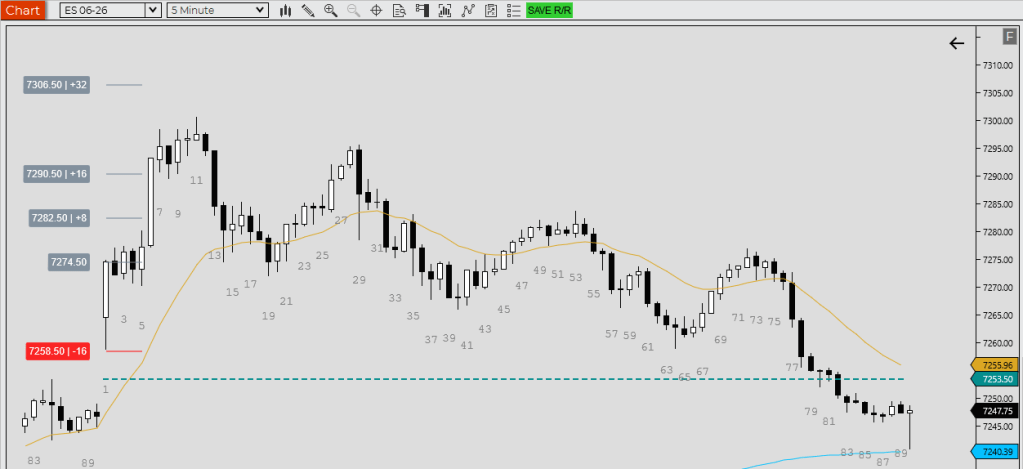
Continue reading →: ES Trading Stats for Day Traders: Bookmark This!
These are useful stats for day traders (Both scalp and swing traders.) I built a database of charts for the past 5+ years of ES RTH 5 minute data as part of a broader research project. But I have found they work on the other index futures instruments I trade.…
-
 Continue reading →: Orlando Workshop: Back to Basics – Docs & Replay
Thanks to everyone who joined the live stream this weekend: Orlando Workshop – Back to Basics + Price Action Coaching Introduction. If you missed it, here’s the replay: (Video loaded to where I start.) During the session, I walked through a couple of documents that are worth revisiting. Below are…
-
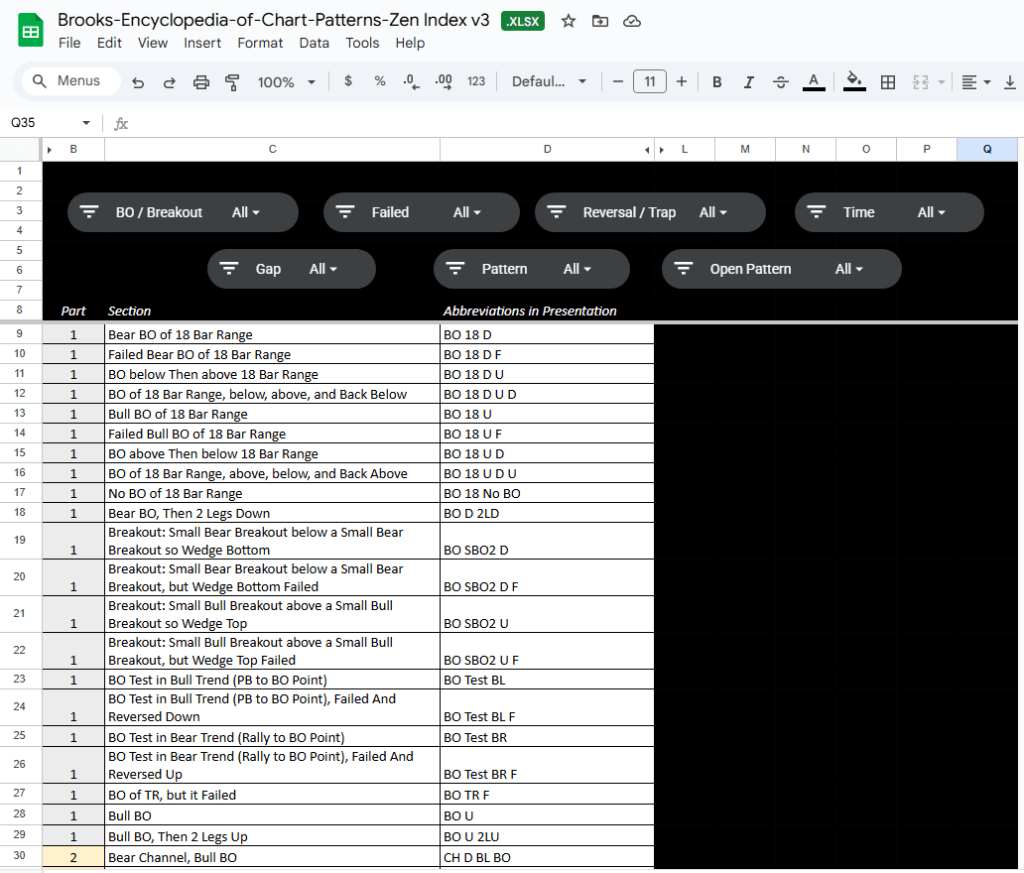 Continue reading →: The Brooks Encyclopedia of Chart Patterns — Now Searchable with Updated Index v3
One of the most requested resources from traders in our community has finally been cleaned up and indexed. If you’ve ever tried to go through Al Brooks’ full Encyclopedia of Price Action, you know how overwhelming it can be — over 7,000 slides across 600+ sections. If you don’t have…
-
 Continue reading →: Can We Breathe Our Way to Better Trading? 6 Methods For You to Try
Slightly different kind of post but no less valuable for you, I believe! Over the years, I’ve used seven distinct breathing methods to train my body, sharpen focus, and reset my nervous system. Each one has a clear purpose and method, and I use them in different parts of training—before,…
-
 Continue reading →: Consecutive Bars Research
Intro Indicator Strategy Link here: https://www.tradingview.com/script/WEXwahbE-Zen-CSC-Bar-Strategy-v2/ 5 Consecutive bars, 5min RTH, ES 1/2R Reward 1R Reward 1.5R Reward 2R Reward Notes Idea: Timeframe as a filter – Try on 2min Chart Idea: MA as a filter – BUY ABOVE MA, etc Idea: ES mostly goes up, so just take longs?…
-
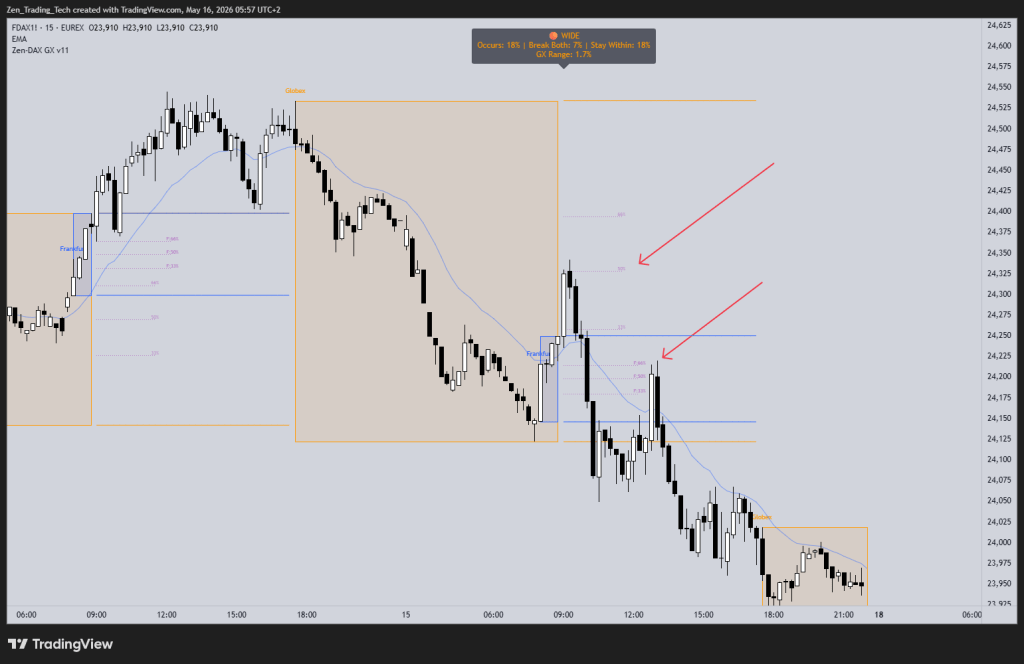
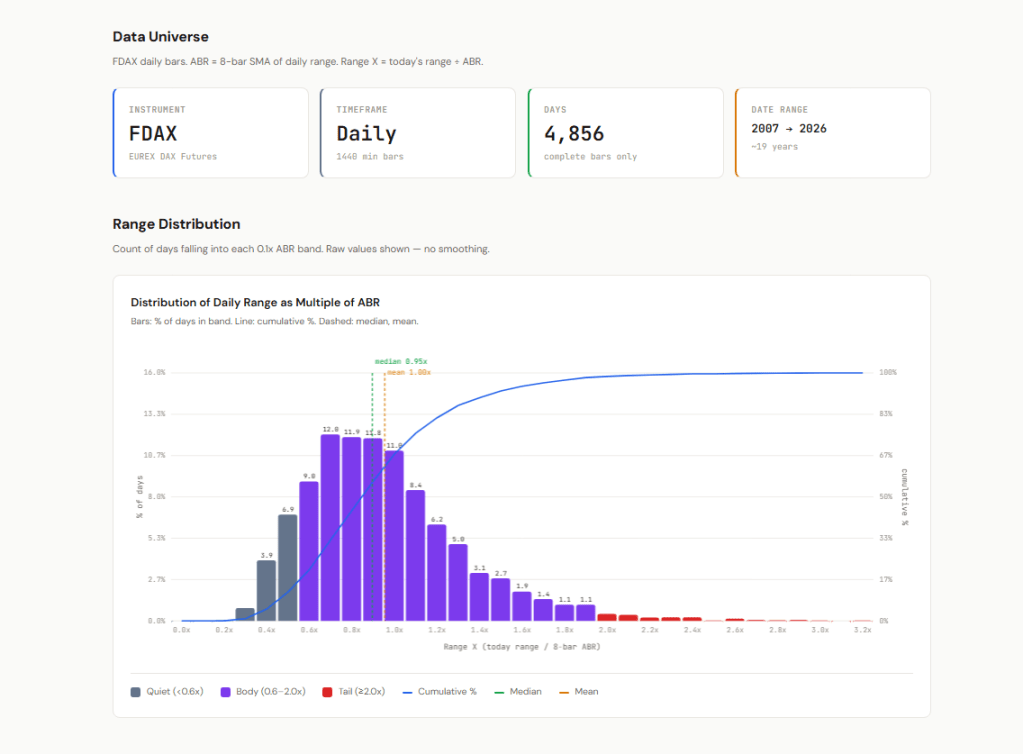
 Continue reading →: How to Research Bar Range Dynamics Using an Indicator
When you’re trading intraday, not all bars are created equal. Some are narrow and quiet — a sign of hesitation. Others are wide and explosive — often signalling strong conviction or emotional capitulation. Being able to classify and study these different kinds of bars can give you a deeper understanding…
-
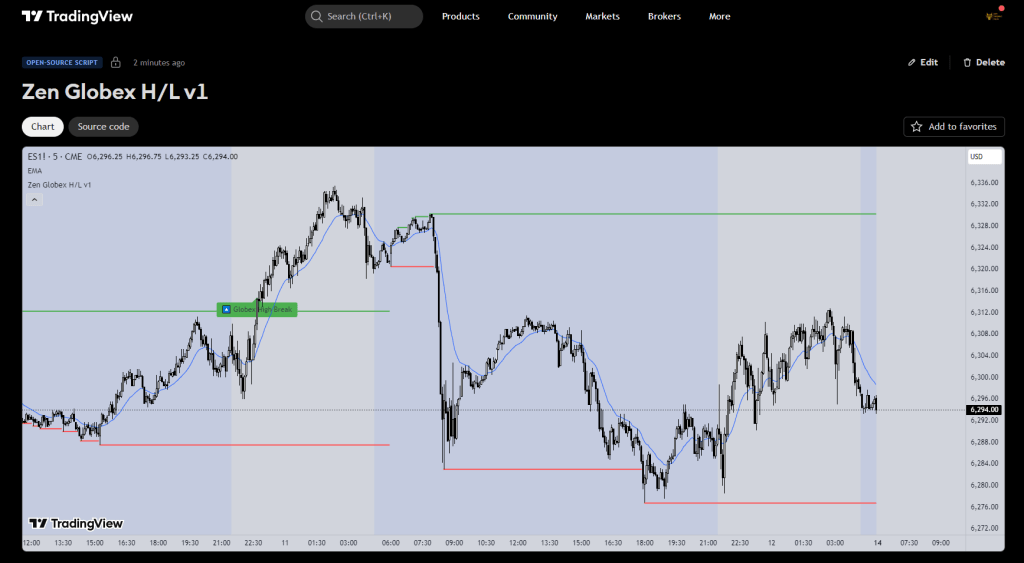 Continue reading →: 🕓 Globex H/L Breaks: A Simple Tool for RTH Session Awareness
If you’re day trading the ES futures or similar products, understanding the relationship between the Globex (overnight) session and the Regular Trading Hours (RTH) session is critical. The Zen Globex H/L v1 indicator is a simple research tool that tracks the Globex High, Low, and Open—and shows you when the…
-
 Continue reading →: 🔍 Researching the RTH Open: Consecutive Bull/Bear Bars
The open of the Regular Trading Hours (RTH) session is one of the most volatile, emotional, and misleading parts of the trading day. Many traders are drawn to spikes that form in the first few minutes—only to get caught fading strength or chasing weakness. Statistically, a large percentage of opening…
-
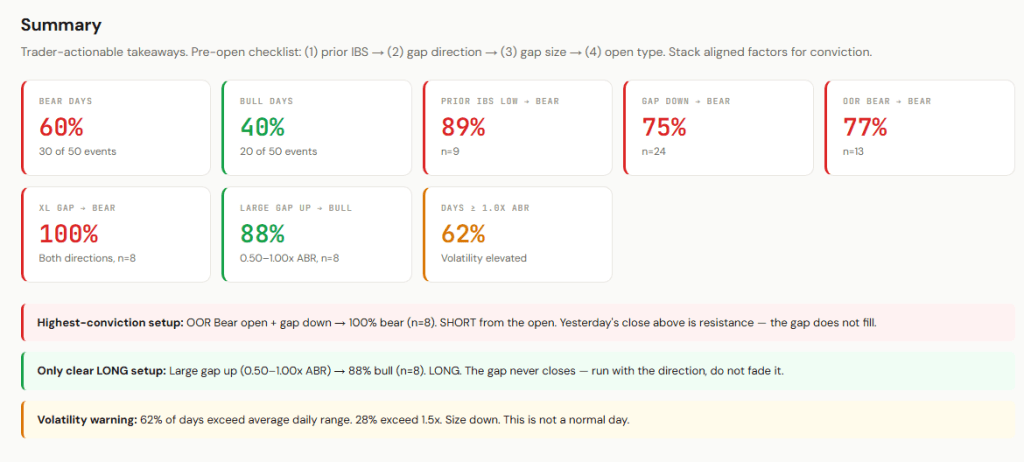
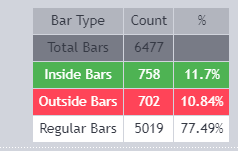 Continue reading →: 📊 Inside/Outside Bars — What They Really Tell Us About Daily Breakouts
Most traders know what an inside bar is. Most traders know what an outside bar is. But very few traders actually study how often these patterns show up—and what that might mean for their intraday strategy. I wanted real numbers. So I wrote a simple tool to count them. Here’s…
-
 Continue reading →: 🔍 A Simple Visual Tool for Spotting Spikes, Second Legs — and Now, Counter-Trend Reversals!
**Excerpt:** A clean visual tool for spotting momentum bursts, second legs, and now — potential counter-trend reversals. The latest update to the Zen 3CSC script adds an EMA-based filter to isolate exhaustion moves and failed breakouts, making it easier to study price behavior around key turning points. Ideal for traders…
-
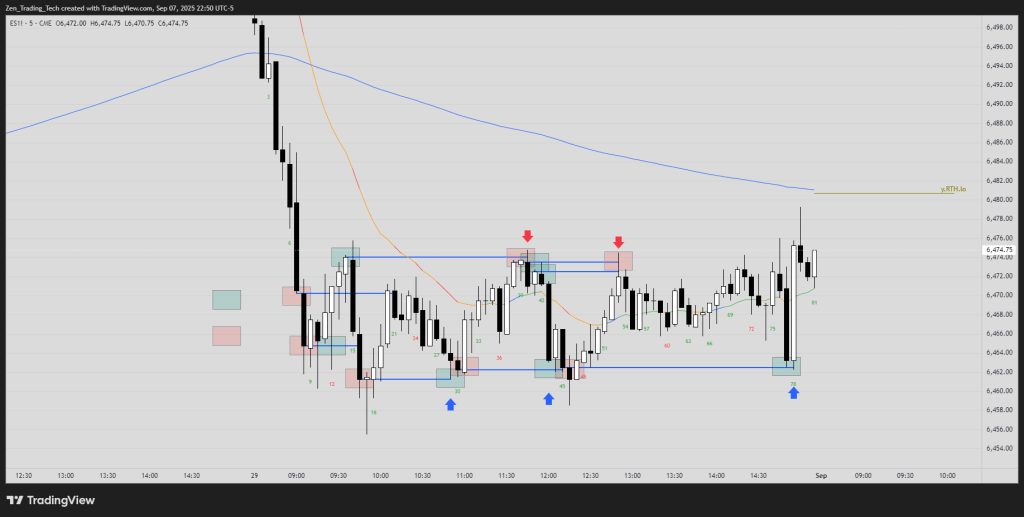
 Continue reading →: 18-Bar Range: A Simple Tool for Traders Studying the Open of the Day
Built for traders using the Al Brooks Method This free TradingView indicator helps you study how the first 18 bars of the regular trading hours (RTH) session affect the rest of the day. It’s designed to support the kind of market reading taught in the Brooks Trading Course. When you’re…
-
 Continue reading →: Trading Range Day – Interesting Practice Drills
H1 Failed – L1 Failed https://www.tradingview.com/x/XQjeGXdq/ Skunk Stop / Wide Stop https://www.tradingview.com/x/AkxakO3k/ 2 Bar Reversals https://www.tradingview.com/x/Faszyzzc/ Opening Range Measured Move https://www.tradingview.com/x/Vq1om4AR/ Gap Open – 50% PB, Test MA https://www.tradingview.com/x/2p9lZY5s/ STC BL High > MA / BTC BR Low < MA https://www.tradingview.com/x/cl7tdPx4/ Conclusion Tim
-
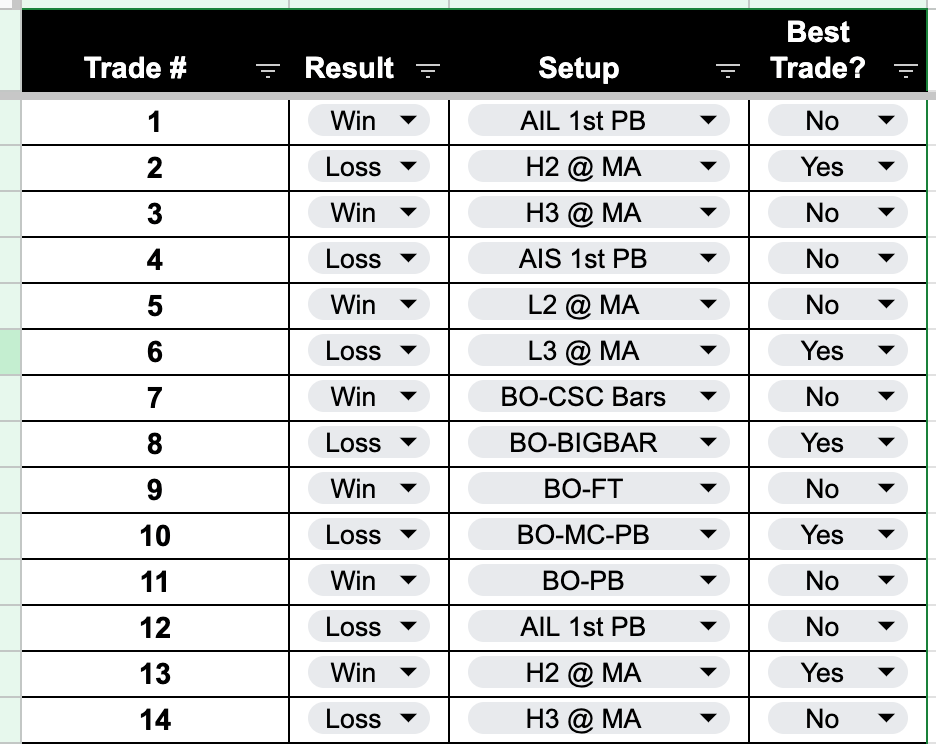
 Continue reading →: From Idea to Edge: One Trader’s Process for Setup Research
Introduction I often get asked how I research different setups. I’ve never actually written out my process before—this is my first go. What I’ve shared below is just one way I approach it. It’s not the only way, but it’s helped me turn ideas into something more concrete. I’m not…
-
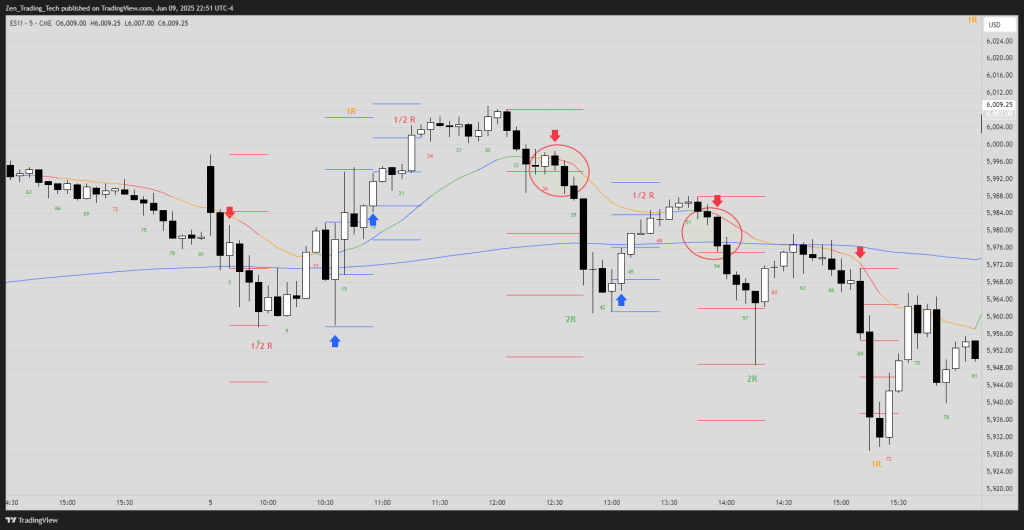 Continue reading →: Trading in Trading Ranges: 1/2R -> 1R
Introduction Main Idea Chart Example 1 Chart Example 2 Chart Example 3 Summary
-
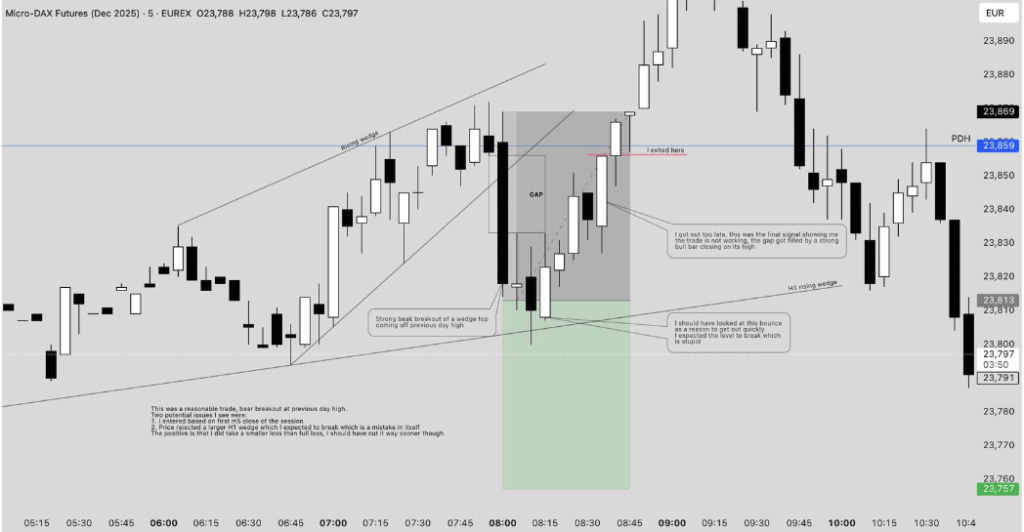
 Continue reading →: 🧠 Study Trade Failures: Obsess Over Exits
Most traders focus on where to get in. Few study where a setup breaks. This post walks through a wedge example and shows why knowing what shouldn’t happen is just as important as knowing what should. The real edge? Spotting failure early and cutting with precision.
-
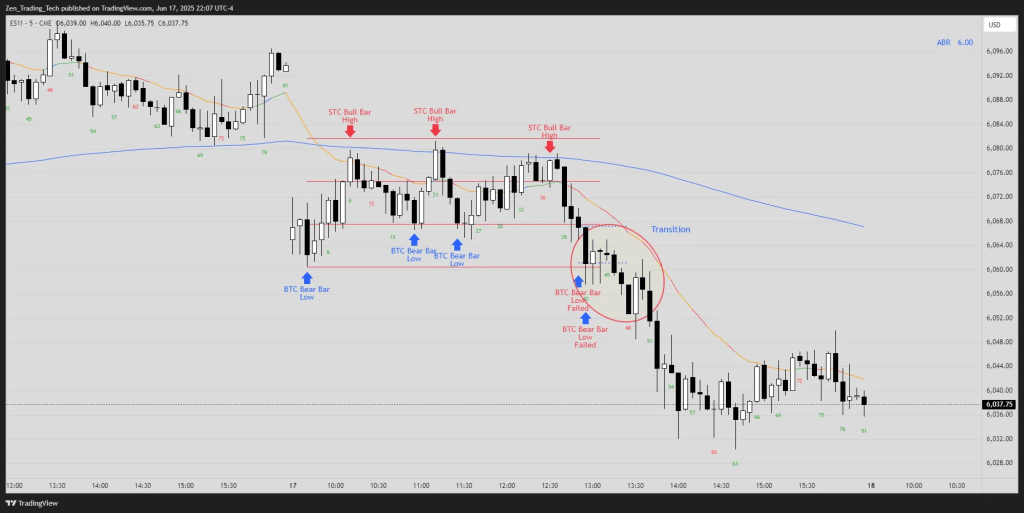
 Continue reading →: 📊 The #1 Trading Mistake: Confusing Setup with Signal
Let me make it simple: In my reviews with hundreds of traders, there’s one mistake I see more than almost any other.It’s subtle, but it sabotages your entries, messes with your stop placement, and creates hesitation in the moment. 👉 The mistake? Confusing a trade setup with a trade signal.…
-
 Continue reading →: 🎯 Same Trade, Two Outcomes – What That Really Means
Every trader eventually faces this moment:“I took the same setup two days in a row. One worked. One didn’t. What did I do wrong?” A trader recently sent me this exact question after trading two microchannels—one long, one short—with completely different outcomes. It’s a great question because it cuts to…
-
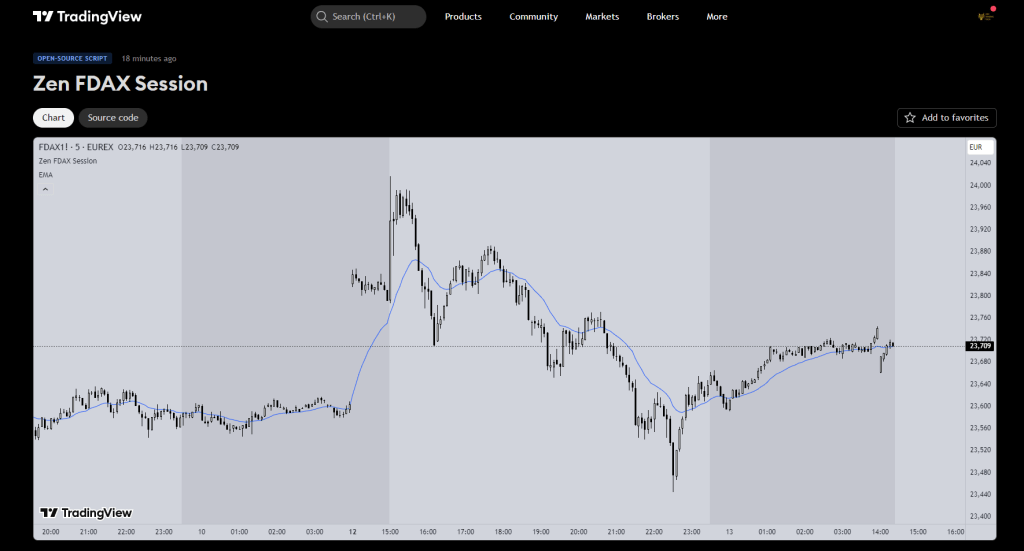
Continue reading →: Brooks Trading Course – European Trading Room Trial
✅ Webinar Links Start 30 mins before Frankfurt Open (8:30am CET European Time). Run for 3 hours. 20th May, 2025 https://attendee.gotowebinar.com/register/7210129310403638871 22th May, 2025 https://attendee.gotowebinar.com/register/6620457925892506454 🎯 Outcomes Help traders: FTSE 100 vs DAX 40 – Cash Index and Futures Comparison (May 2025, Central European Time) *I’ve done my best to…
-
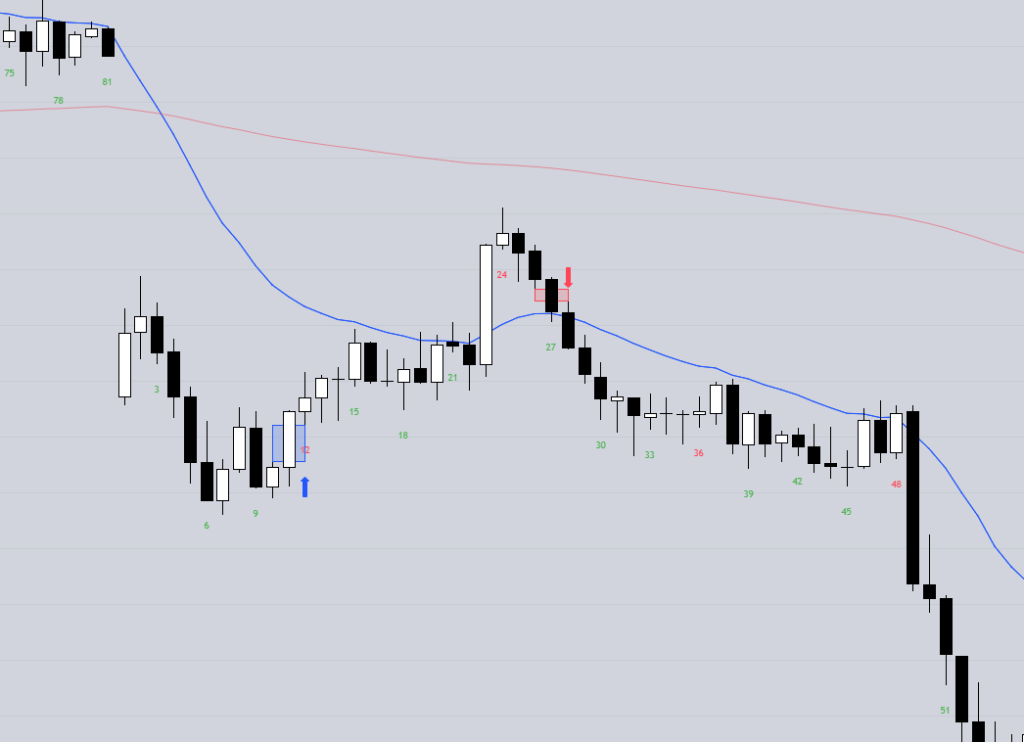
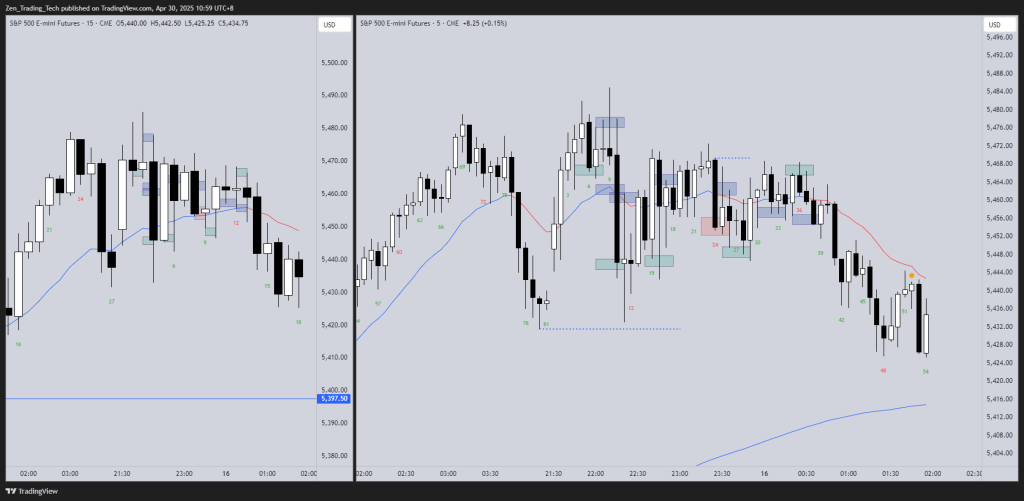 Continue reading →: How to Use 15-Min Charts to Confirm 5-Min Trade Setups: Trade Review Drill
Traders can enhance their strategies by using both 5-minute and 15-minute charts. Reviewing trades on the longer timeframe helps identify alignment with market structure and avoid mistakes. It encourages better timing and decision-making, reducing confusion. Practicing this routinely fosters improved trade execution and greater awareness of market dynamics.
-
 Continue reading →: 📈 1:1 Review Drill: Are You Always on the Wrong Side?
Here is a simple way to sharpen your entries:Split the range into halves and review your trades. Ask yourself: 🛠️ Exercises to Practice 🔹 Exercise 1: Find a 1R Exit Focus on small wins first — you’ll clean up a ton of mistakes just by making sure you’re taking trades…
-
 Continue reading →: Micro-Gap Reversal– Youtube Video is up!
I did a short video on ways you can use the indicator here. We’ve have a few great setups using this already this week. Hope it inspires you to research PA further. Cheers, Tim Original Post: Link to the indicator Zen MIG Reversal V1 on TradingView Note: This is not…
-
 Continue reading →: The Micro-Gap Reversal– A Simple and High Probability Pattern
This indicator is built to highlight a specific kind of 3-bar structure — something I’ve seen repeat after momentum gaps or aggressive moves. it is a micro-gap (gap between 3 same-colour bars) on the WRONG side of the moving average. Bears getting 3 consecutive bear bars ABOVE the MA? MIG…
-
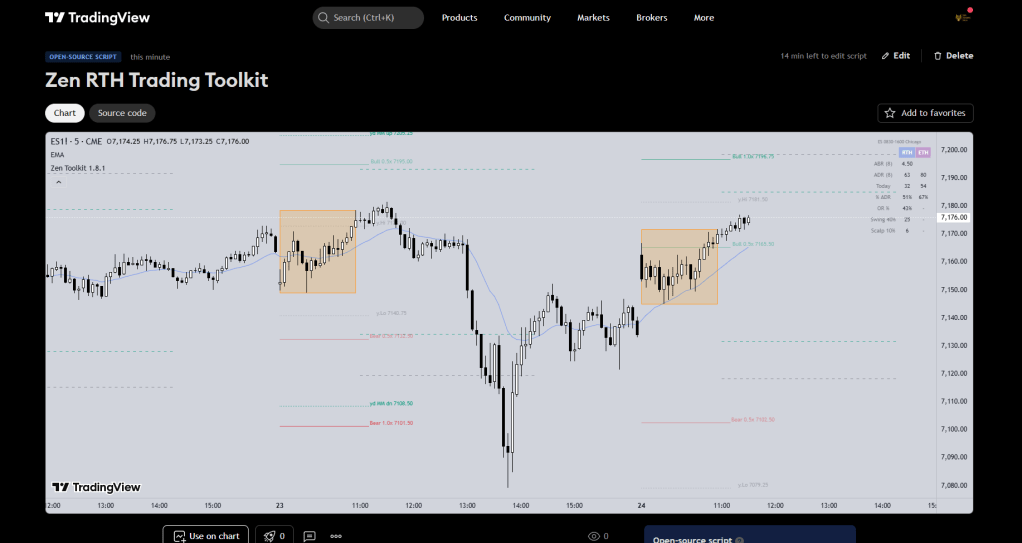
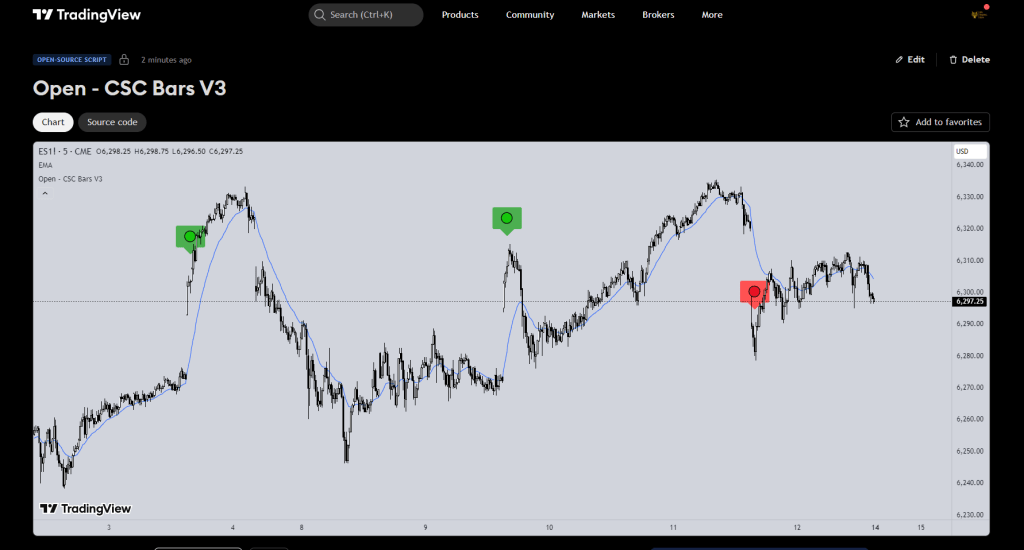
 Continue reading →: The First Three Bars: A Simple Tool for Deep Research
Today I’m sharing a new indicator I built for exactly that purpose. It’s called “3 CSC Bars”, and it does one thing only—but it does it well. It highlights the first three bars of the RTH session if they’re all bullish or all bearish. https://www.tradingview.com/script/exepFQlW-Open-CSC-Bars-3/ Why does that matter? Because…
-
 Continue reading →: 🧠 Build Your Own Trading Encyclopaedia – Part 1
Want to really understand a price action pattern? Don’t just memorize someone else’s notes—rebuild them yourself.This post shows you how I do it, using “Channel Failures” as the example. Below the post I include my notes for you to kick off from. 📚 The Exercise The goal is simple:Take a…
Hi,
I’m Tim

Welcome to Zen Trading Tech.
I’m a Aussie day trader and I post trading tips, practice drills, and indicators that helped my trading get to a professional level.
Everything here is to help train the eyes and hands to trade better. If it helped me I’ll post it for others. Hope you enjoy!
Join the fun!
Stay updated with our latest tutorials and ideas by joining our newsletter.