Some traders couldn’t care less about leg counting. I get that.
Yet as a scalper, I can’t help thinking that my study and focus on leg counting is part of my success! Breakouts get second legs, reversals get second legs – it’s exactly what I’m looking for.
In English we have a great expression:
‘to flog a dead horse.’
| The idiom “to flog a dead horse” originated from the fact that flogging a dead horse will not compel it to do useful work. |
I think the horse of leg counting is very much alive – but doesn’t need too much flogging.
So let’s explore a question I’m sure you all can’t stop thinking about as well:
“How many legs does the S&P actually make in a day?”
I use “legs” a lot when I talk about a session — this leg up, that leg down, the day made three legs before it found the high. But I’d never actually pinned the number down. So I built it into my own research database and ran it properly, on ES and FDAX, back to 2021.
Simply: there isn’t one number for how many legs a day has. It depends on how big a move you’re willing to call a leg. But once you fix that, the answer is stable, it’s measurable, and it tells you something useful about the kind of day you’re in.
First, how do you even define a leg?
I have several videos on leg counting on my YouTube channel, and several blog posts.
Not required reading, but sensational obviously…
But here I took a different, simpler approach.
“A leg has enough bars/distance for someone to get a scalp. When an opposite trader can get a scalp that leg has ended.”
Complete? Unlikely. Technical? Nope. Robust – surprisingly yes!
So what threshold to use – a scalp is 10% of a day’s range BUT it needs to be slightly larger so you have a chance to enter and exit to capture it.
That’s why I like 0.15 of an Average Daily Range (ADR). I use an 8-bar lookback, but feel free to find your own perfect spirit animal lookback period.
Then I (Insert AI program) walk the day bar by bar from the open. Price extends in one direction, I keep tracking the extreme. The moment it reverses by more than the threshold, that’s a leg closed, and a new one starts. Do that all day and you get the day’s leg count.
Enough chat, more charts.
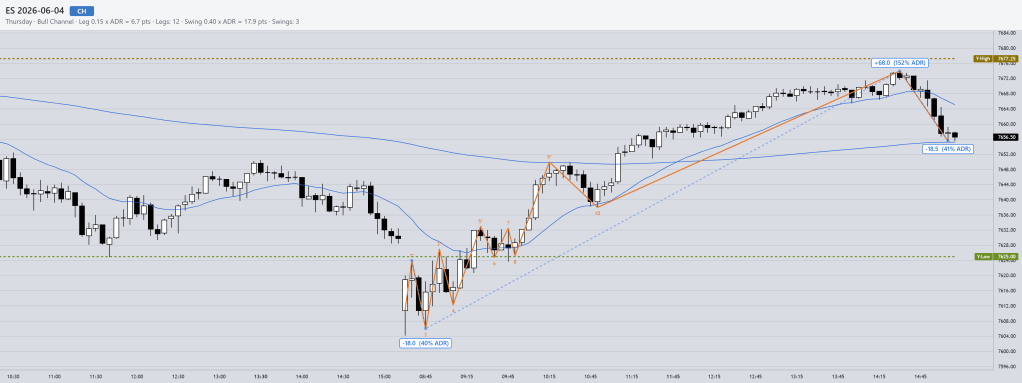
ES, yesterday’s session, threshold 0.15x ADR Prior — 12 legs
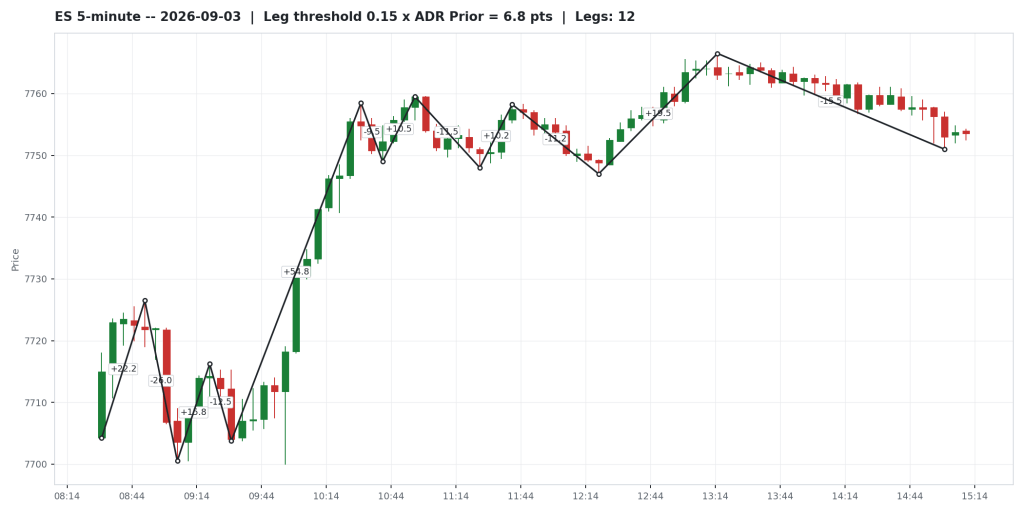
That’s the threshold I use as my default — 0.15 times the prior day’s ADR. Every dot on the chart is a pivot the walk locked in. Every line is a leg, labelled with its own size in points.
Same day, threshold 0.20x ADR Prior — also 12 legs
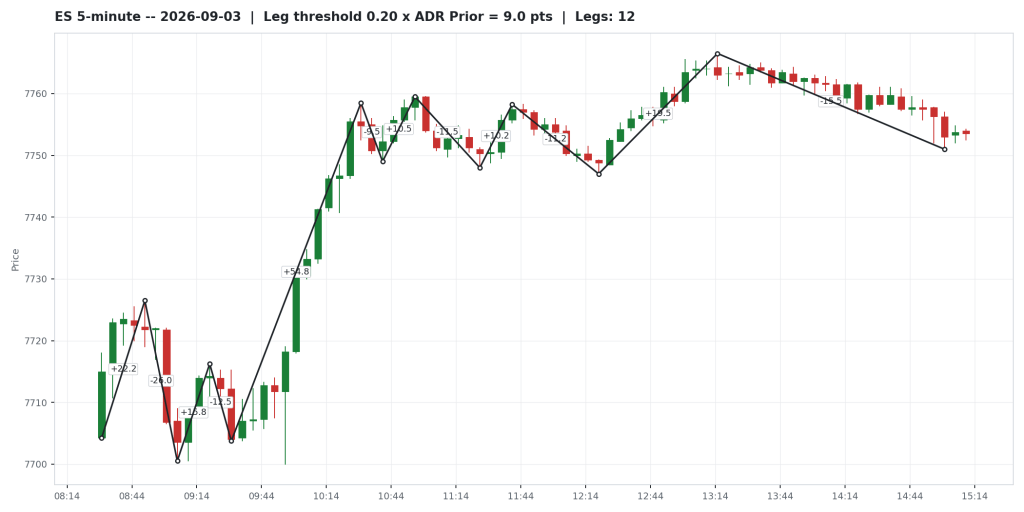
Loosen the threshold to 0.20x and yesterday, nothing changes — still 12 legs.
Same day, threshold 0.25x ADR Prior — 8 legs
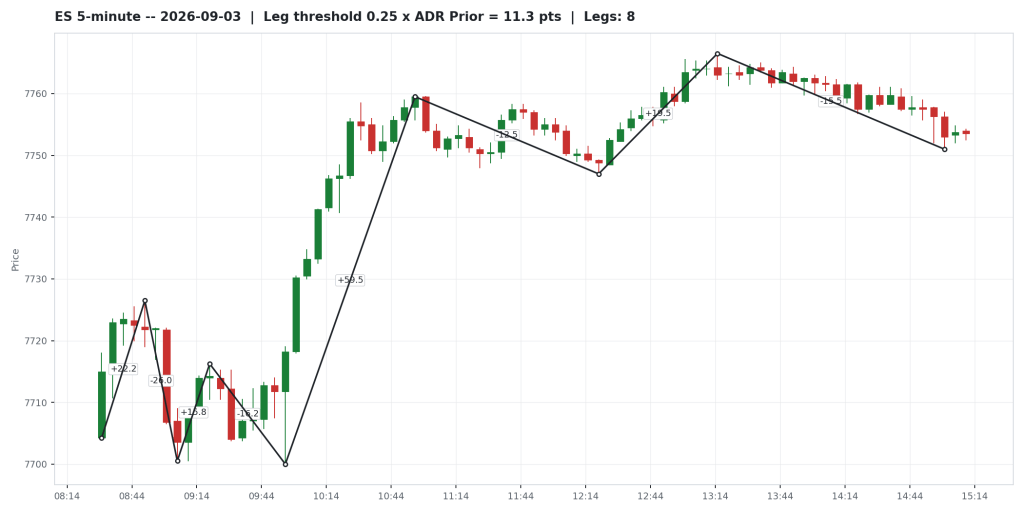
Loosen it to 0.25x and the middle trading range is gone, poof! Which is fair, tight trading range, etc.
OK, and let’s take it too far.
Same day, threshold 0.33x ADR Prior — 4 legs
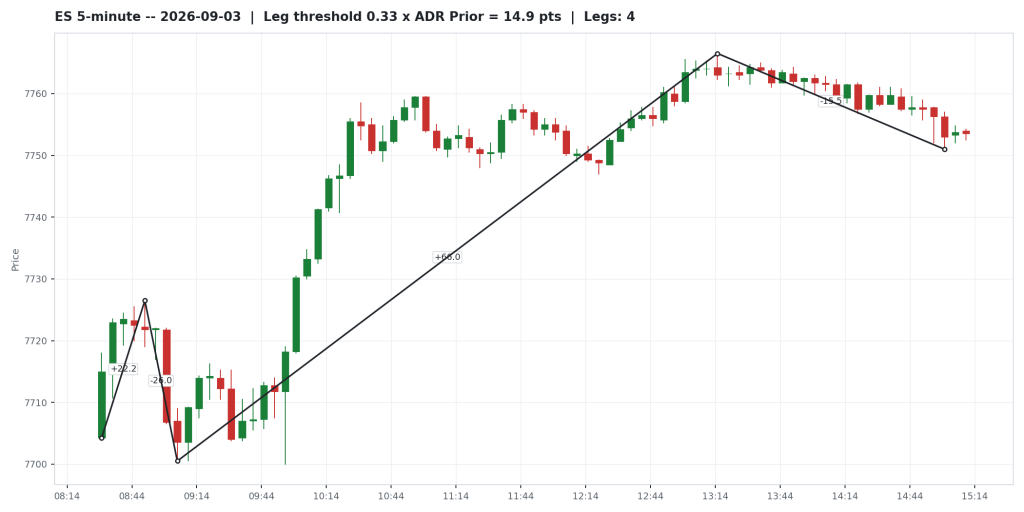
So 0.1 is too small for someone to actually take that scalp and 0.33 is too big to be useful.
I’ll leave it up to you. Season to taste!
So what’s the actual average?
At my default threshold — 0.15x the prior day’s ADR — the typical ES day runs 15 legs.
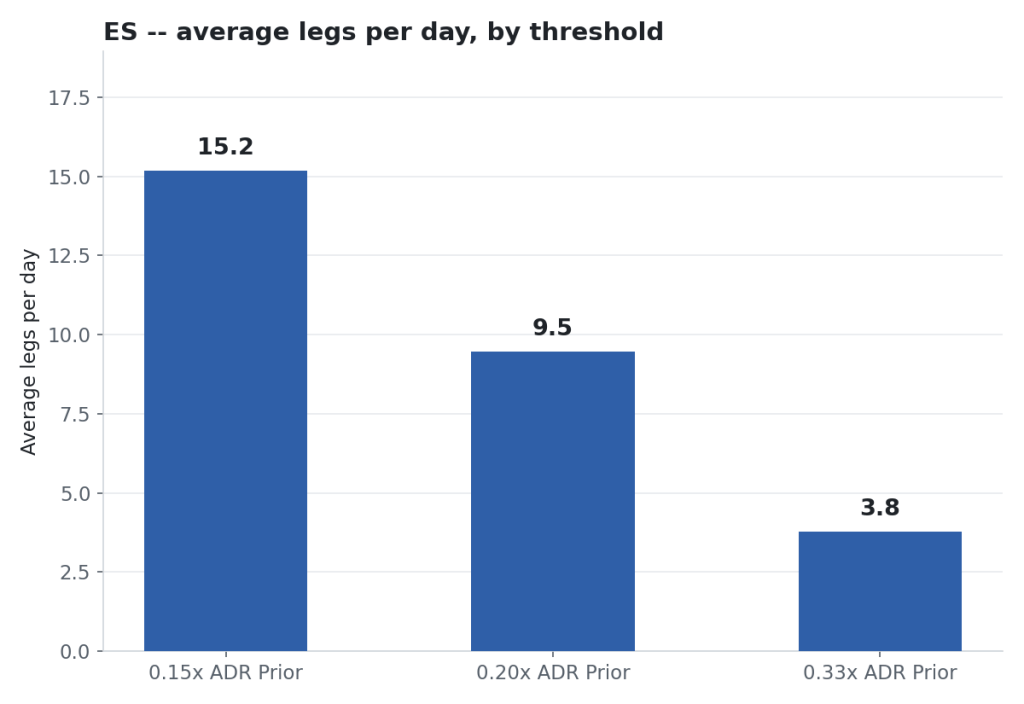
That’s the median across 1,279 trading days back to August 2021.
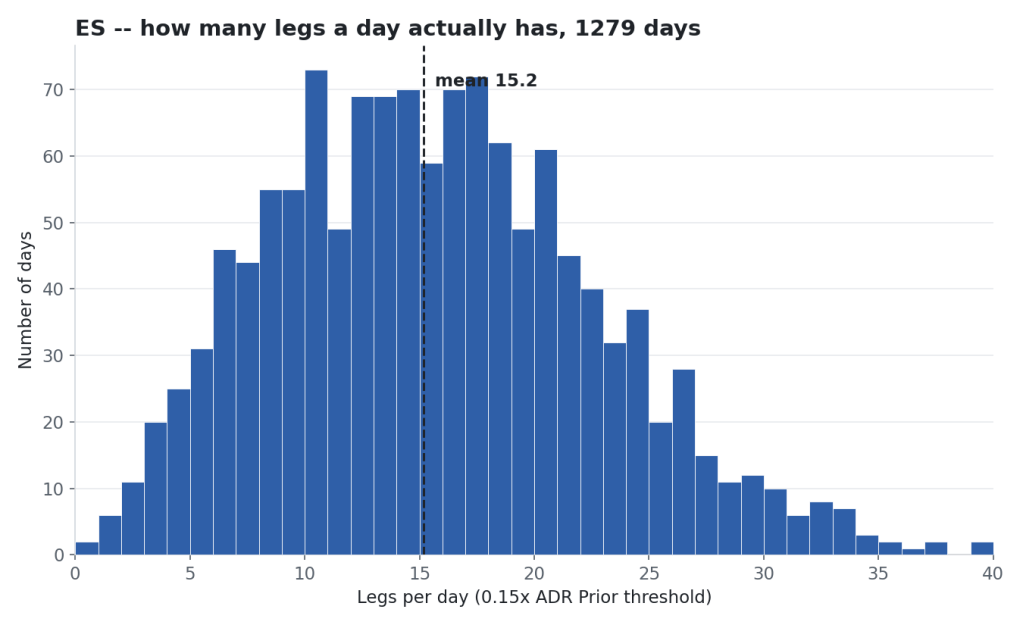
If you think that’s a lot of legs, you’re right. Trading range behaviour and two-sided trading!
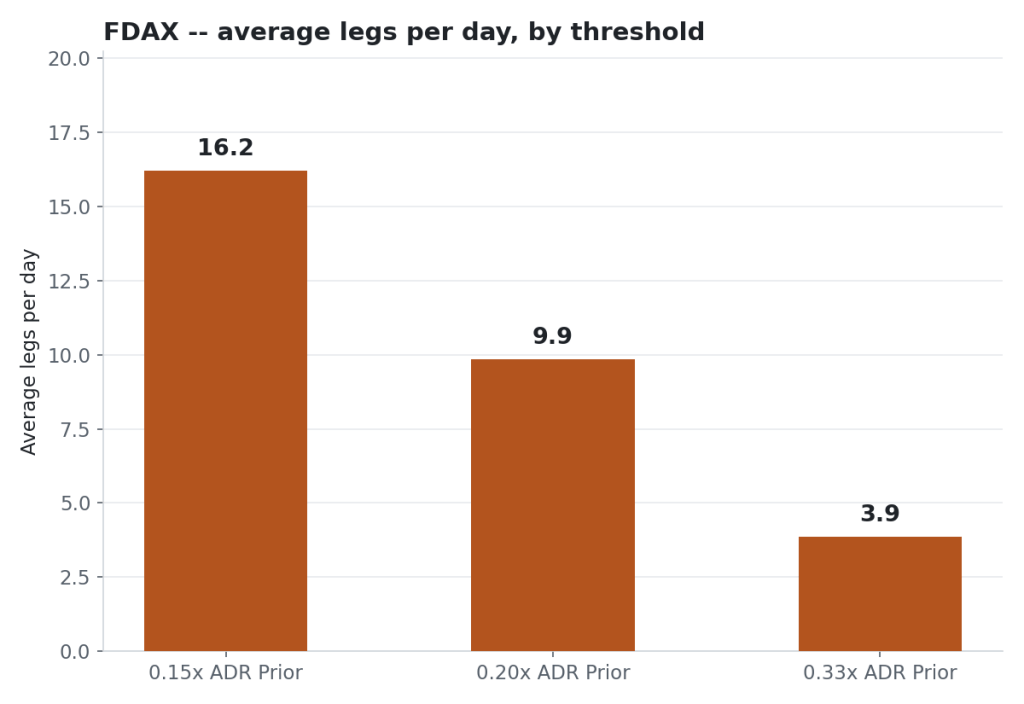
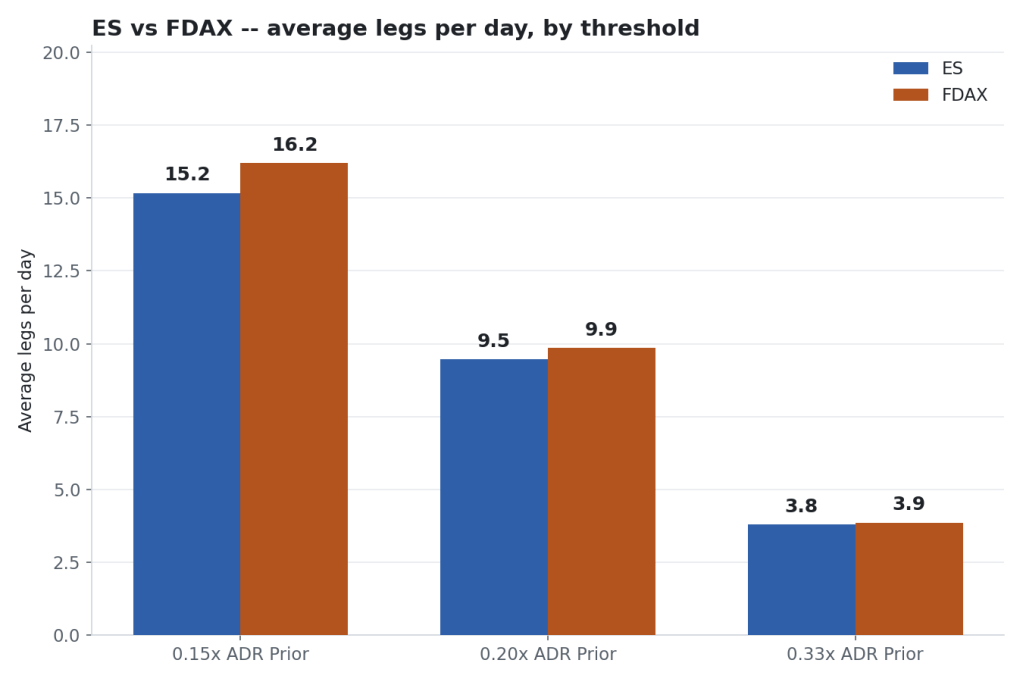
FDAX comes out the same, a median of 15, though its average sits a bit higher, 16.2 against ES’s 15.2, because FDAX throws more extreme high-count days (its worst was 51 legs, ES’s worst was 39).
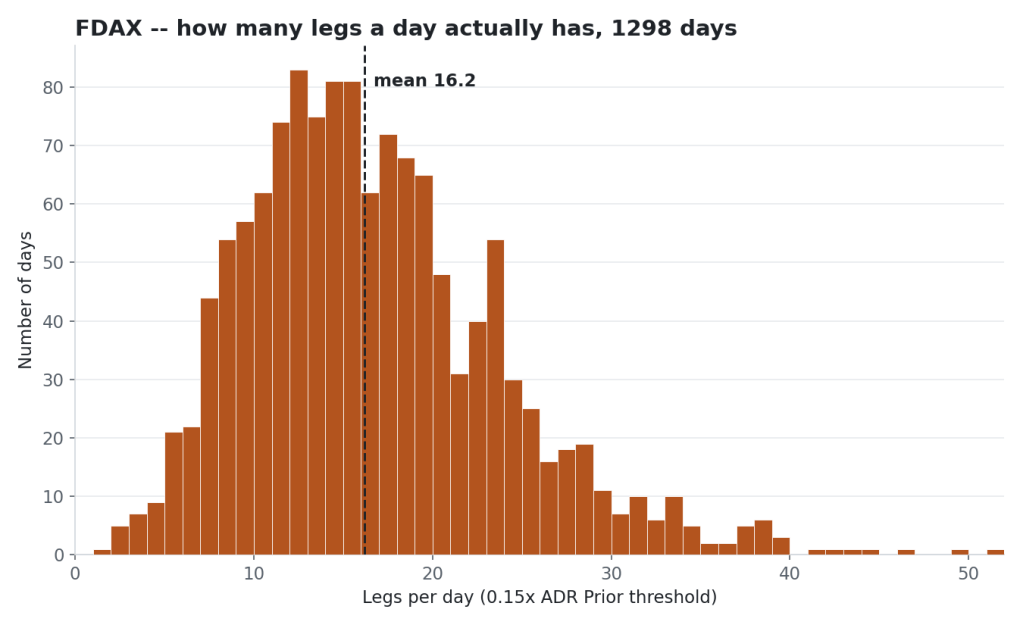
Widen the threshold and both markets fall together.
At 0.20x, ES averages 9.5 legs a day and FDAX averages 9.9. At 0.33x, ES averages 3.8 and FDAX averages 3.9.
That part actually surprised me. Two different products, two different sessions, two different time zones — and once you scale the threshold to each market’s own volatility, they reverse about the same number of times a day.
Has it changed over five years?
The old classic: will computers, algos, crypto-bros, peri-peri-naise, AI, crystal balls change trading…? Err, not yet! Which was interesting.
Average legs per day, both markets, four full years.
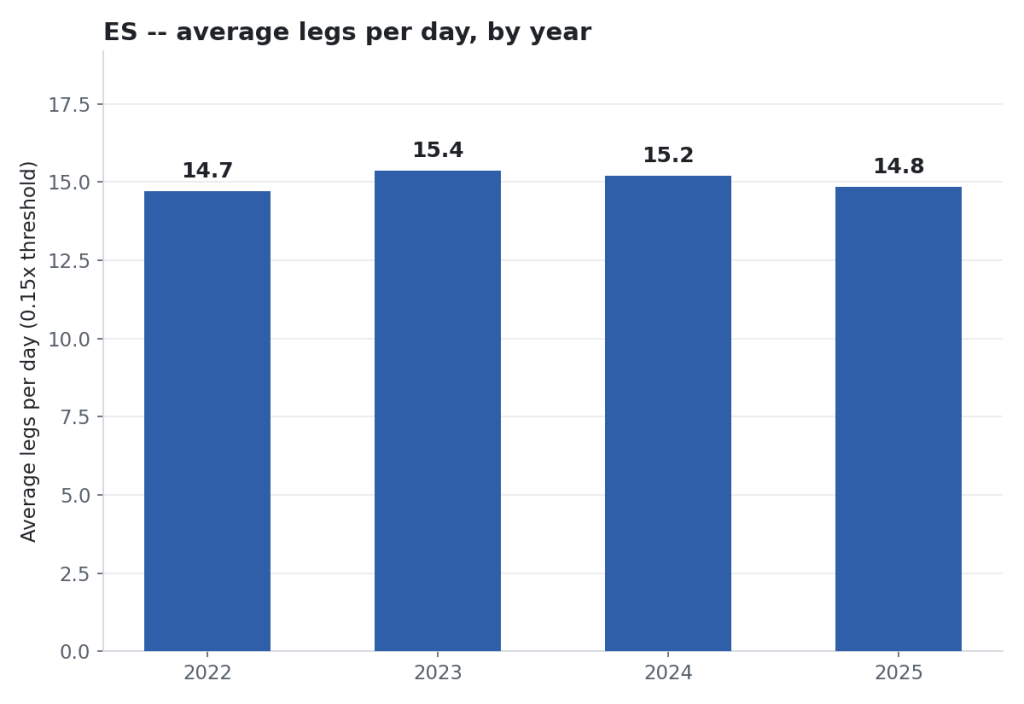
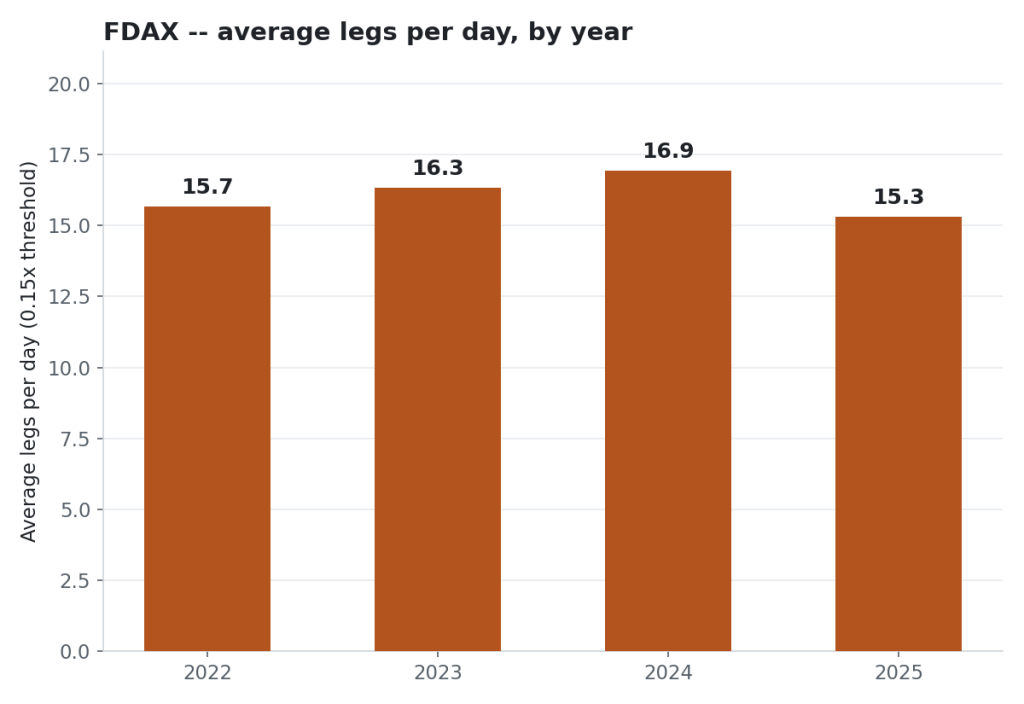
Leg count looks like a stable, structural property of the market, not something drifting with the times.
Does how directional a day is change the leg count?
Averaging across all days hides the real story. So I sorted every day by how directional it was, using something I built myself — I call it RLS.
It’s just a ratio: how far the day travelled above the open, versus how far it travelled below the open. A day that pushed up hard and barely dipped below the open gets a high RLS. A day that sold off hard gets a low one.
First, RLS band by day.
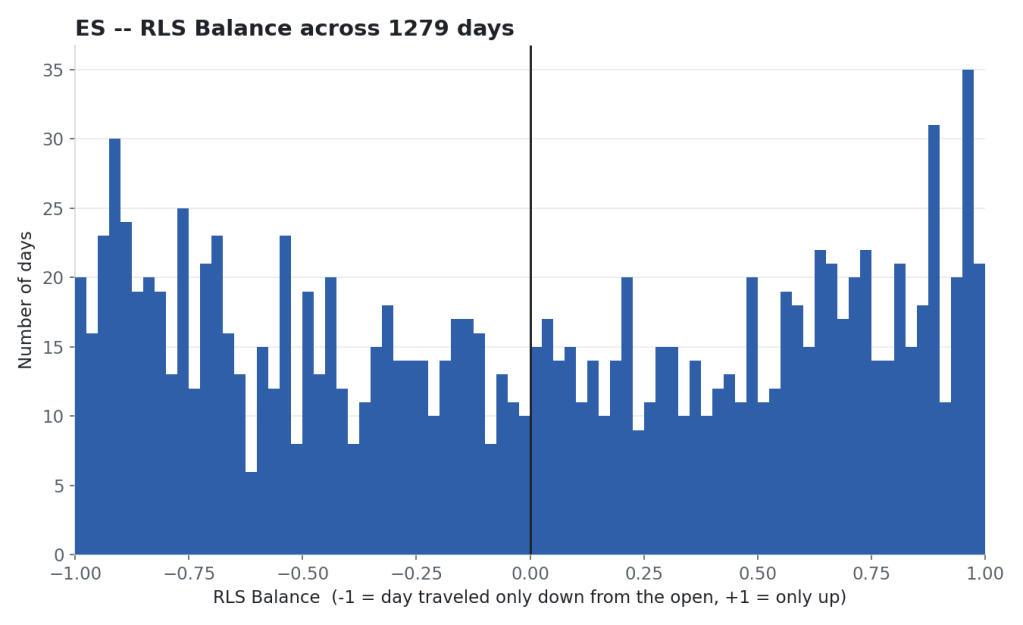
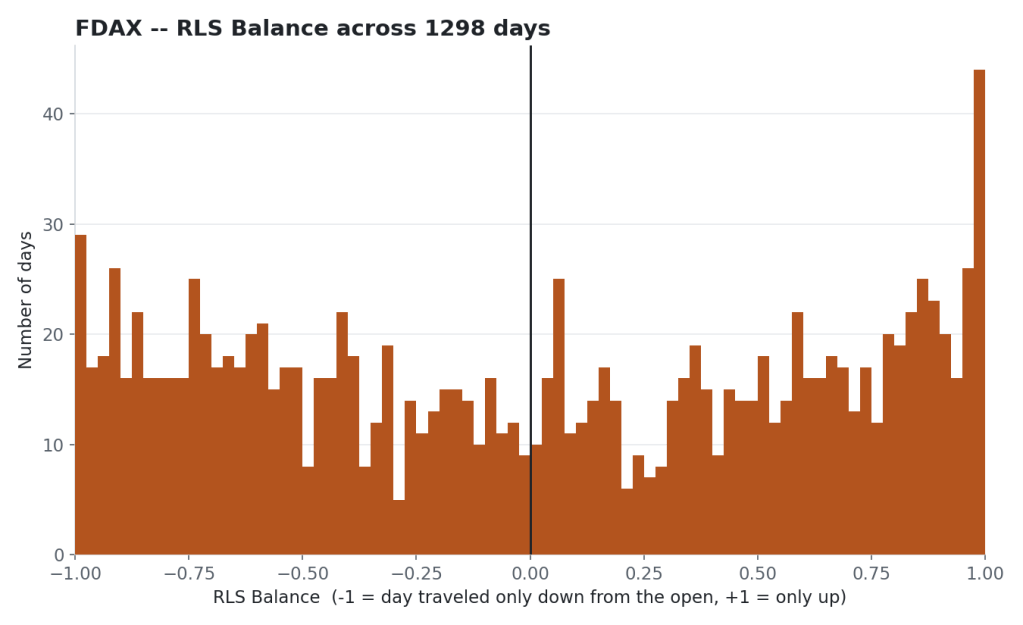
Interesting – yeah! That’s why trading is great, we are unlikely to hover around the bloody open all day! 🙂 It’s an inverse bell curve. Smaller in the middle, more at the ends.
Commonly known as a Lleb Curve.
Just a little stats joke. Lame.
Average legs by RLS band (how one-directional the day was), ES and FDAX. Does a big day have more or fewer legs?
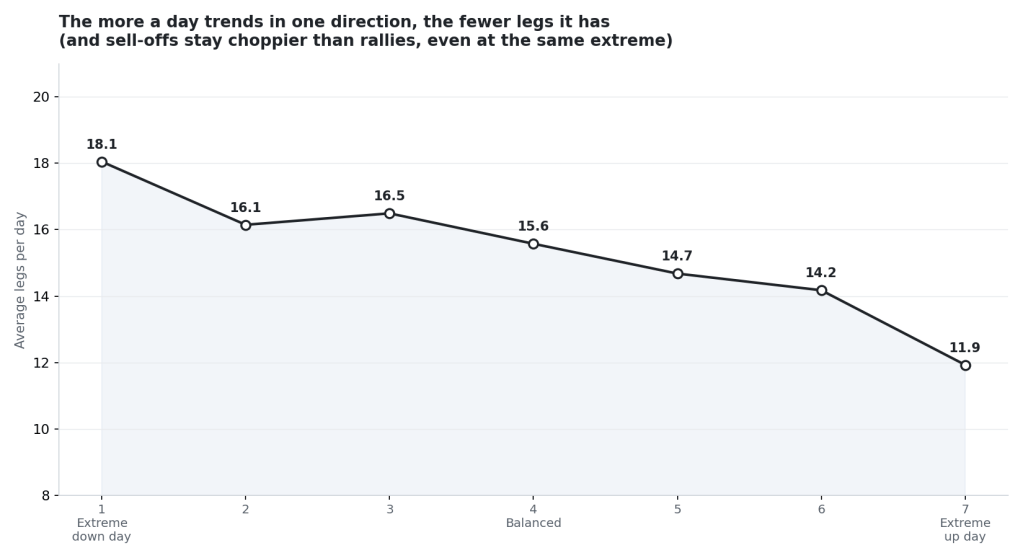
Sort days this way and you get a clean gradient. The more one-directional the day, the fewer legs it made. Balanced days sit in the middle at 15 to 16 legs. The most one-sided days, in either direction, drop as low as 12.
Full scatter plot here. Showing one-sided, trend-from-the-open days: big up days are cleaner than their sell-off counterparts.
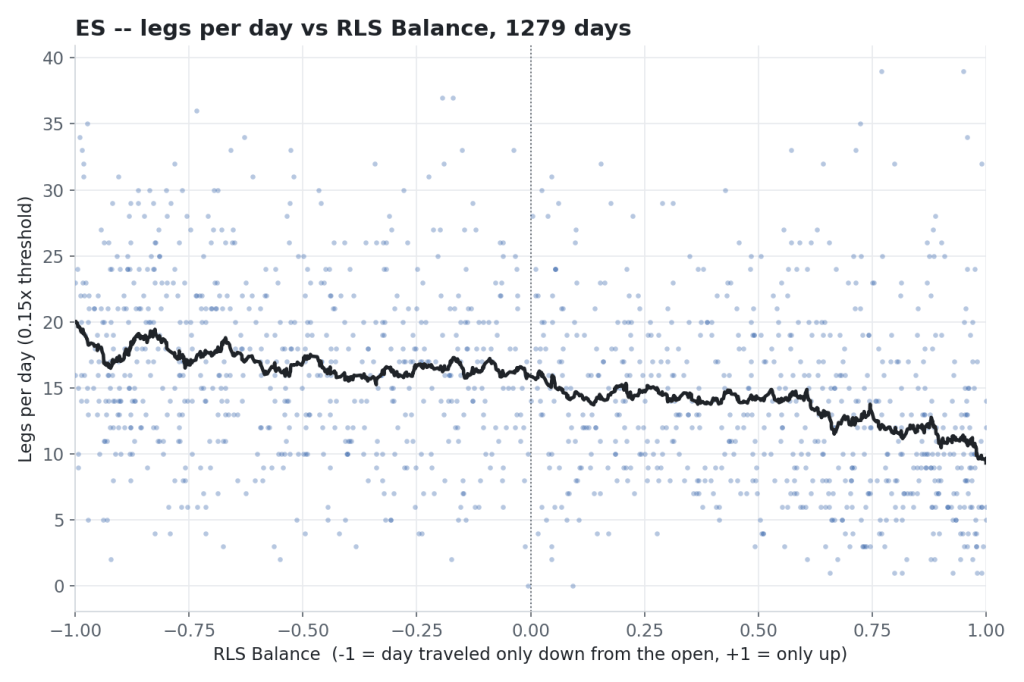
And I found something I wasn’t expecting: it isn’t symmetric. The most extreme down days still average 18 legs. The most extreme up days average 12. Sell-offs still make more legs than rallies, even at the same level of directional dominance. I don’t have a clean explanation for that yet — maybe panic doesn’t travel in a straight line the way controlled buying does?
A word on “day type”
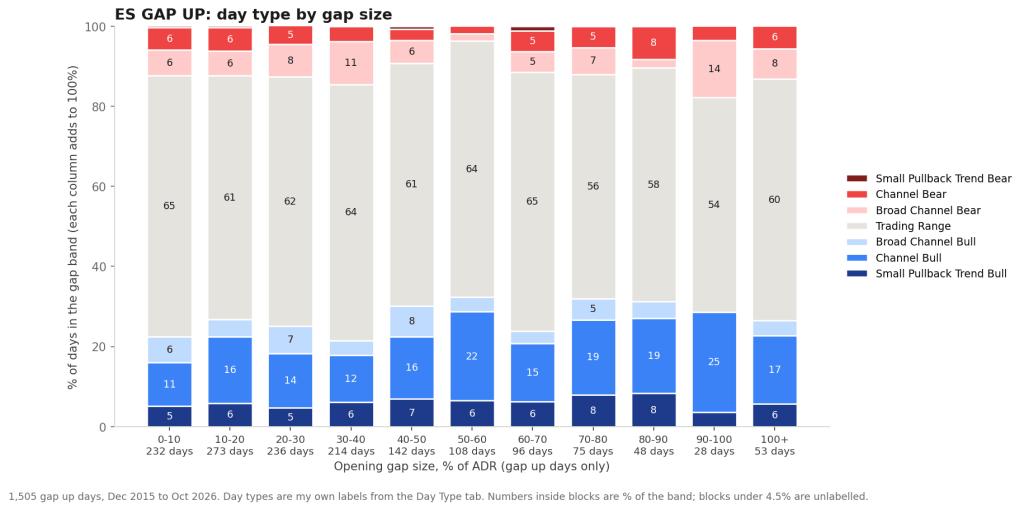
Legs are also one of the things I feed into an attempt at classifying what kind of day it was — trend day, range day, channel day, and so on.
I want to be straight about this one: it’s just an idea of mine, not a finished method.
I haven’t landed on the right way to do it yet, because it’s the kind of thing your eyes do instantly looking at a chart, and a computer really struggles to turn into a clean set of rules.
I’m not going to win the Nobel Peace Prize for financial innovation but it goes a little something like this…
Academia: The inverse logarithmic square of the leg count gives it a high trendiness factor.
Caveman: Less legs = More Trend
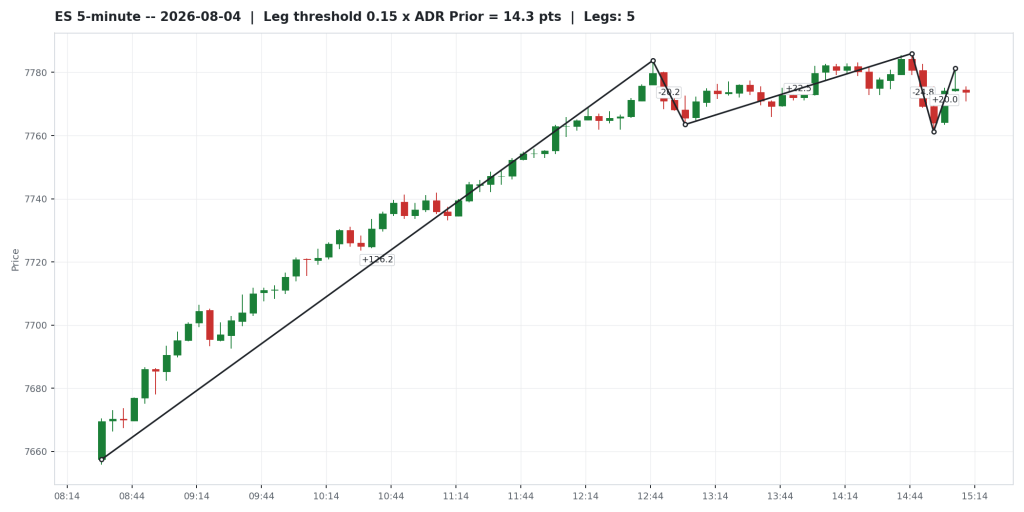
Below, apparently first discovered in East Rangia by Baron von Choppinowski, he postulated that the more frustrating the day, the higher the leg count.
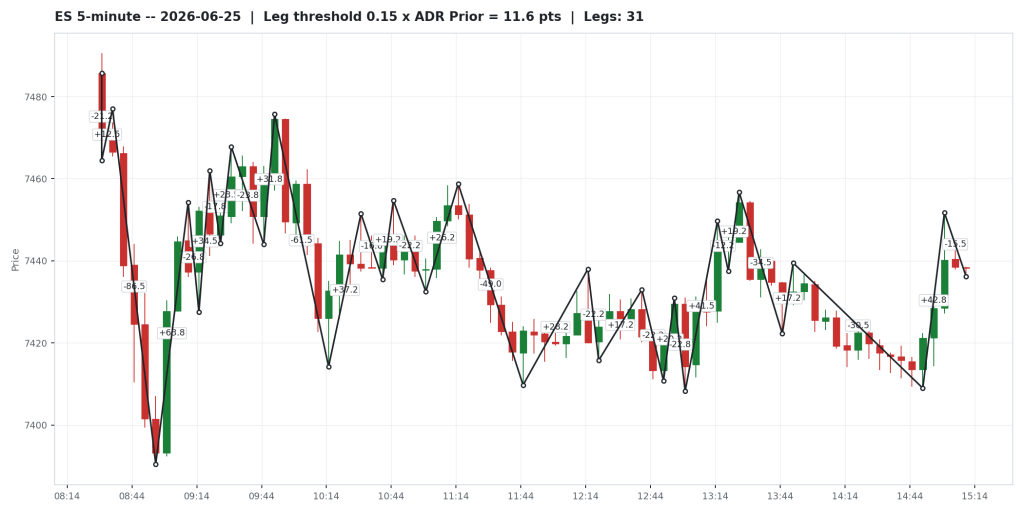
Ye olde favourite: spike and sideways.
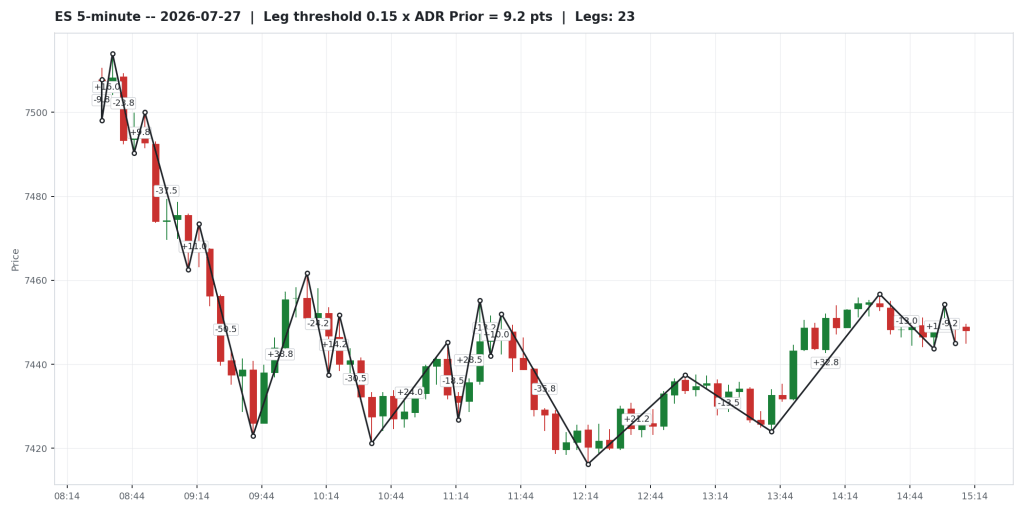
Which kinda sorta looks like this:
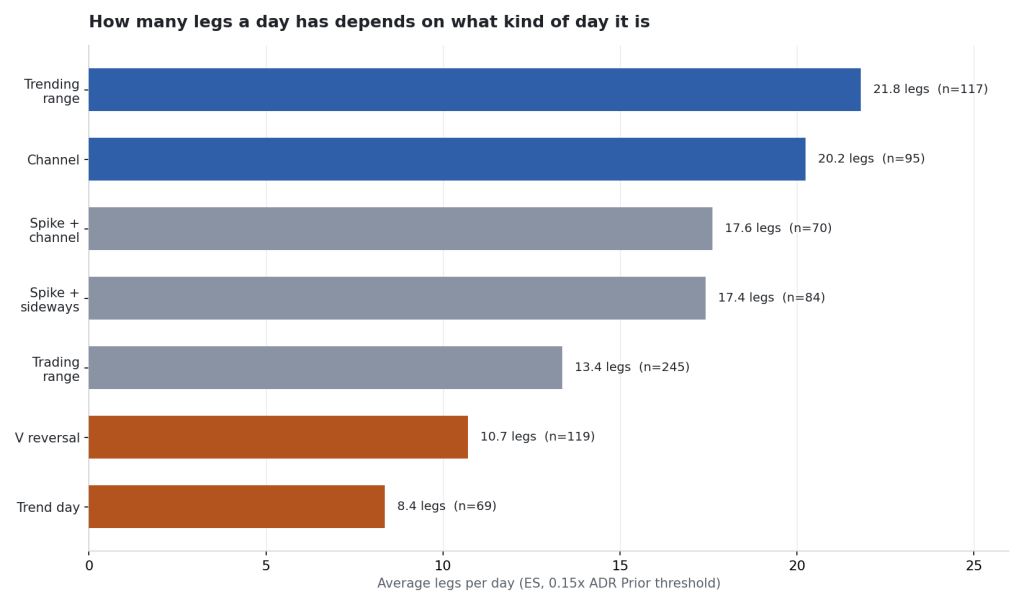
So here’s a question for you instead of a table of stats from me: have you gone through and classified your own days by type, and looked at what percentage fall into each bucket? Has that actually fed into a trading strategy? And does that even make sense as an approach, to you? I’d genuinely like to know how you’ve handled it, because I haven’t solved it to my own satisfaction.
Does a busy ES day mean a busy FDAX day?
Err – non.
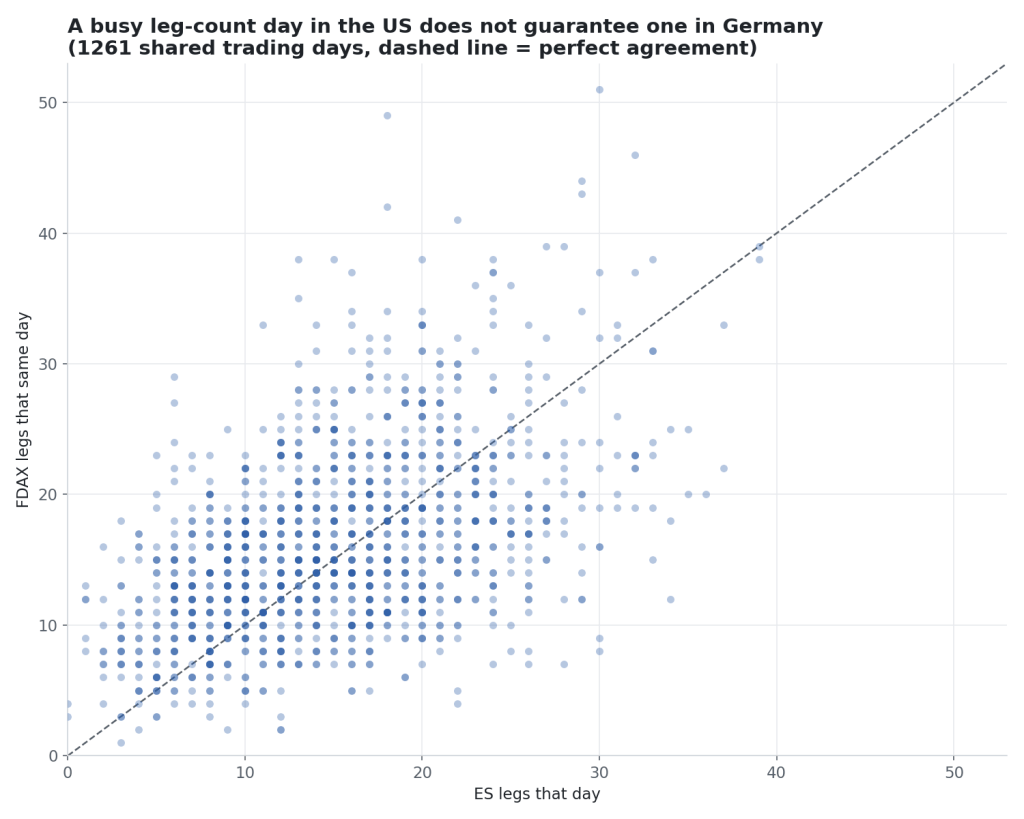
If the two moved together you’d see a tight line running up the diagonal.
What you actually get is more of a cloud.
Apparently in statistics terms it’s called a ‘loose lean’ which sounds like a posture used when chatting up girls. Looks like a similar hit rate?
Don’t borrow one market’s leg count as a read on the other. Mamma always said not to trust those correlations from down the street.
What I’d take from this
Well, if you’re a scalper like me, many legs = many opportunities.
If you’re a swing trader – now you know why it’s so hard to sit through pullbacks.
You could take this further and start reviewing day types and start tweaking your trading plan for mid and afternoon sessions.
Does it replace watching price action live? No.
Can my computer trade for me while I take up pickleball full-time? Unlikely.
The reads and the decisions are still yours. But it’s one more piece of context, and you should be able to pull the data and see it for yourself.
Next thing I want to test: whether the leg count in the first two or three hours predicts how the rest of the day plays out — which is the actual tradeable version of this question. That’s still open. I’ll report back.
Happy trading!
Tim
Zen Trading Tech





Leave a Reply